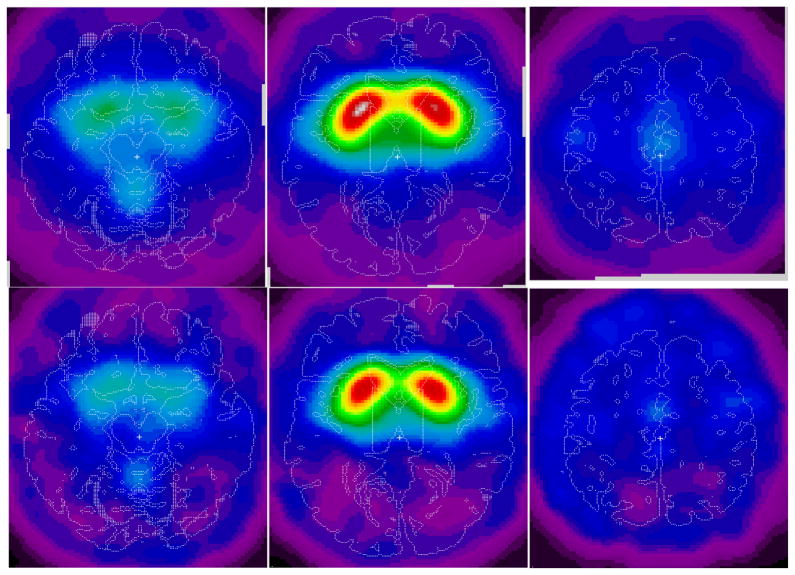
Fig. 6.
Upper panels: Voxel-to-cerebellar ratio images acquired by SPECT 24 h following the intravenous injection of approximately 333 MBq (9 mCi) (2)-5-[123I]iodobenzovesamicol ([123I]IBVM), spatially normalized and averaged across eight healthy volunteer normal control adult participants (upper panels). The left of each image corresponds to the left of the brain. The right of each image corresponds to the right of the brain. The top of each image corresponds to the anterior aspect (front) of the brain. The bottom of each image corresponds to the posterior aspect (back) of the brain. T1-weighted MRI was obtained on the brains of all subjects. The radioactivity from [123I]IBVM during SPECT is obtained for the striatum, the thalamus, the pons, the occipital cerebral cortex, and the cerebellum using VOIs defined on the MRI and transferred to the SPECT image space. The panels represent transverse slices of the brain at the level of the cerebellum (left), striatum (middle), and cingulate gyrus (right) (Haut et al., 2000a,b).
Lower panels: Schematic representations of areas of decreased voxel-cerebellar ratios of images of the brain generated by single-photon emission-computed tomography (SPECT) following the intravenous administration of approximately 333 MBq (9 mCi) (2)-5-[123I]iodobenzovesamicol ([123I]IBVM) spatially normalized and averaged across four participants with RTT. MRIs were not obtained for any participant with RTT. The left of each image corresponds to the left of the brain. The right of each image corresponds to the right of the brain. The top of each image corresponds to the anterior aspect (front) of the brain. The bottom of each image corresponds to the posterior aspect (back) of the brain. Clusters of voxels were identified for subjects with RTT with volumes exceeding 1 mL with voxel-cerebellar ratios reduced by at least 30% in subjects with RTT. Although the limited number of subjects precluded statistical inference, the findings suggested the potential presence of focal areas of decreased vesicular acetylcholine transporters in RTT. The panels represent transverse slices of the brain at the level of the cerebellum (left lower panel), striatum (middle lower panel), and cingulate gyrus (right lower panel). Presented in the figure are the decrements in uptake in the vermis (left lower panel), the striatum (middle lower panel), and in bilateral precentral cortices (left lower panel) and middle cingulate (right lower panel) (Haut et al., 2000a,b).

