Abstract
A three-dimensional (3D) finite element electromechanical model of the heart is employed in simulations of seismocardiograms (SCGs). To simulate SCGs, a previously developed 3D model of ventricular contraction is extended by adding the mechanical interaction of the heart with the chest and internal organs. The proposed model reproduces the major peaks of seismocardiographic signals during the phases of the cardiac cycle. Results indicate that SCGs record the pressure of the heart acting on the ribs. In addition, the model reveals that the rotation of the rib with respect to the heart has a minor effect on seismocardiographic signal morphology during the respiratory cycle. SCGs are obtained from 24 human volunteers and their morphology is analyzed. Experimental results demonstrate that the peak of the maximum acceleration of blood in the aorta occurs at the same time as the global minimum of the SCG. It is confirmed that the first SCG peak after the electrocardiogram R-wave corresponds to aortic valve opening, as determined from the impedance cardiogram (p = 0.92). The simulation results reveal that the SCG peaks corresponding to aortic valve opening and the maximum acceleration of blood in the aorta result from ventricular contraction in the longitudinal direction of the ventricles and a decrease in the dimensions of the ventricles due to the ejection of blood, respectively.
Keywords: Seismocardiography, 3D electromechanical model, Finite element analysis, Cardiac function, Doppler ultrasound, Impedance cardiography
1. Introduction
Blood flow in the major vessels, movement of the ventricular walls, and opening and closing of the heart valves produce vibrations on the body surface. Historically, measurements of these mechanical vibrations have been widely used in the diagnosis of cardiac diseases [1]. Specifically, precordial and cardiac examinations such as palpation and auscultation have been performed since the 16th century [2]. The pulsations of the heart and of the great arteries are assessed with palpation of the chest of the patient, while the examination of heart sounds is performed via auscultation using phonocardiograph [3].
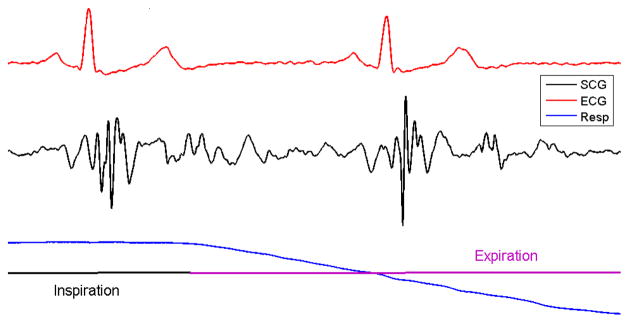
Seismocardiography is a method for quantifying low- frequency vibrations produced by the heart. In particular, seismocardiograms (SCGs) record the acceleration of the sternum produced by the contractions of the heart. The peaks in a seismocardiographic signal coincide with specific cardiac events of the cardiac cycle, such as the opening and closing of the heart valves [4–7]. The amplitude and morphology of seismocardiographic signals may be affected by factors such as respiration [7], cardiac contractility [8], and heart rhythm [9]. The effect of respiration on seismocardiographic signal morphology is shown in Fig. 1.
Figure 1.
SCG during respiration cycle. The ECG from lead II is shown at the top and the respiration signal is shown on the bottom.
Clinical application and further improvement of seismocardiography have been limited to some extent by the fact that the mechanisms underlying the morphology of the signal still remain unclear. To understand the processes that give rise to seismocardiographic signals, a mathematical model is required. Mathematical models have already provided insight into the physiological mechanisms that underlie signals recorded from other modalities that measure the pulsations of the heart, such as ballistocardiography [1]. The results from these models have justified the use of ballistocardiography in clinical studies [10].
In contrast to ballistocardiography and quantitative seismocardiography [11], SCGs are recorded from areas located close to the heart; therefore, the heart movements themselves have a major effect on the morphology of the signal. As such, a comprehensive model of the heart that includes a representation of the volume of the heart is required to simulate SCGs. Recently, we developed an anatomically accurate three-dimensional (3D) electromechanical model of heart ventricles and employed it to simulate seismocardiographic signals [6]. Although this computational model reliably reproduces some of the clinically observed peaks in SCGs during isovolumic contraction and ventricular filling phases, it fails to capture the morphology of the signal during the ejection and relaxation phases. Moreover, the model is unable to reproduce changes in the morphology of the signal observed clinically during respiration.
In this study, the previously developed 3D electro- mechanical model is extended to include a representation of the sternum and surrounding internal organs. It is hypothesized that the movements recorded by SCGs arise from pressure (compression and expansion) changes in the thoracic cavity between the heart and the chest wall. This hypothesis is confirmed by both model results and experimental data.
2. Materials and methods
2.1 Electromechanical model
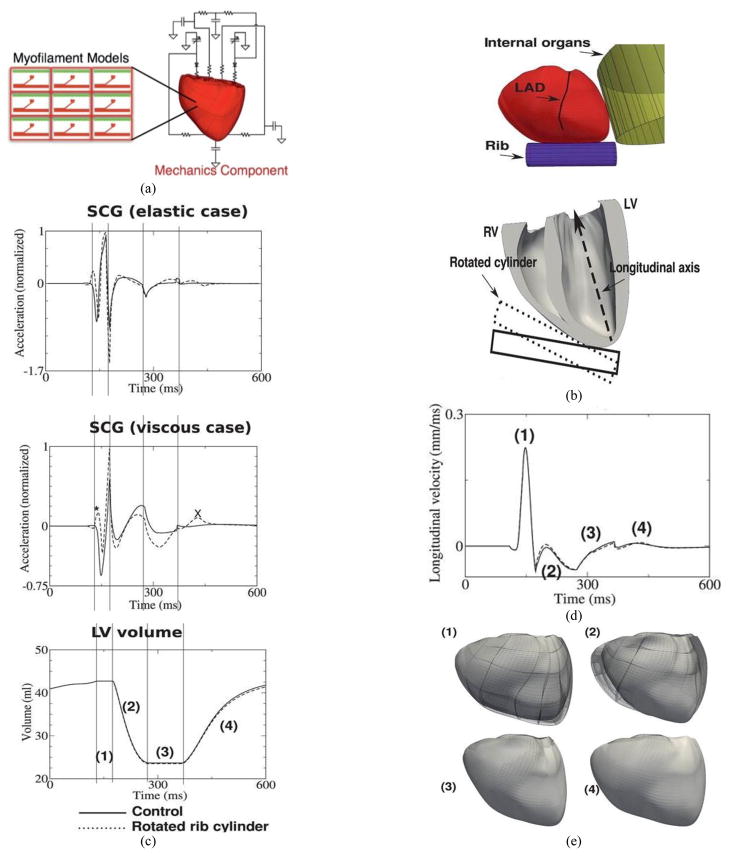
An image-based 3D electromechanical model of canine ventricles (Fig. 2(a)) was described in our previous study [12]. Briefly, the geometry of the model and the fiber and laminar sheet architecture were obtained from magnetic resonance (MR) and diffusion tensor MR images. The electromechanical activity of the heart is simulated by a combination of several models, namely a monodomain model of electrical propagation, a biophysical model of membrane kinetics, a biophysical model of cardiac myofilaments, and a continuous model of passive mechanics. Since the fiber orientations of the trabeculae and papillary muscles are unavailable from diffusion tensor MR imaging due to the partial volume effect, a functional layer of fibers is added to the endocardial surface of the ventricles. The fibers in this layer are oriented in the longitudinal direction. The electromechanical model is coupled with the circulatory model to simulate the phases of the cardiac cycle. The surrounding anatomical structures such as the ribs and internal organs are incorporated. To reproduce the SCG morphology of human subjects, the orientation of the ribs with respect to the ventricles was made similar to that in the human chest rather than in the canine chest.
Figure 2.
Electromechanical model of ventricular contraction and simulation of SCG signal. (a). Diagram of electromechanical model coupled with the model of blood circulation in the body. (b). Location of rib and thoracic organs in the model. (c). Temporal traces of acceleration in the elastic case (top), acceleration in the viscous case (middle), and LV volume (bottom). Asterisk and X highlight changes in SCG morphology due to rotated rib. (d). Longitudinal displacement velocity of LV apex. (e). Deformations of the ventricles during the phases of the cardiac cycle (view from the anterior surface). Notations: (1) – isovolumic contraction, (2) – ejection phase, (3) – isovolumic relaxation, (4) – ventricular filling, LAD – left anterior descending coronary artery. MC – mitral valve closing, AO – aortic valve opening, RE – rapid ejection. In all figures, solid and dashed lines represent simulations for control and rotated rib orientation, respectively.
2.2 Representation of the sternum and internal organs
A rib is represented as a solid cylinder with a 10-mm radius placed next to the right ventricular apex (Fig. 2(b)), according to the thoracic position of the heart observed from publically available cine-MR imaging videos [13]. Since the displacement of the ribs due to the contraction of the ventricles is much smaller than the movement of the ventricular walls and does not affect cardiac mechanics, the position of the cylinder is fixed. The pressure of the cylinder on the ventricular surface Pc (as well as the pressure of the ventricles on the cylinder) is simulated using a penalty term, which increases exponentially with the difference between the distance d to the point on the ventricular surface from the axis of the cylinder and the radius of the cylinder r:
| (1) |
where α = 1 kPa and β = 5 mm−1. Parameters of the model were chosen such that the cylinder did not penetrate the ventricular surface more than 2 mm. The internal thoracic organs that surround the heart are simulated with a cylinder with a 100-mm radius placed behind the posteriolateral wall of the left ventricle (LV).
Since the orientation of ribs changes during inspiration and expiration, simulations were performed with a control orientation (inspiration) and a rotated orientation (expiration) (Fig. 2(b)), where the ribs were directed 15° more toward the longitudinal axis of the ventricles than in the control case.
2.3 Seismocardiographic signals
The seismocardiographic signal was represented as a function of pressure acting on the rib cylinder. Since the mechanical properties of the sternum during contraction were unknown, two extreme cases were considered: 1) the elastic term was much greater than the viscous term (elastic case); and, 2) the viscous term was significantly greater than the elastic term (viscous case) of the Kelvin–Voigt model. Thus, the acceleration of the chest was proportional to either the first or second temporal derivative of the pressure on the rib cylinder for the viscous or elastic case, respectively.
2.4 Clinical SCG and doppler ultrasound recordings
The experimental seismocardiographic signals were recorded by placing a piezoelectric accelerometer on the sternum of each patient in the midline with its lower edge at the xiphoid process, as shown in Fig. 3. The sensor (model 393C, PCB Piezotronics, New York, USA) had a linear response between 0.3 and 800 Hz and a sensitivity of 1.0 V/g. A 2-MHz pulsed Doppler instrument (MultiFlow, DWL GmbH, Sipplingen, Germany) was used in the parasternal region to record the velocity of the blood in the aorta. This velocity was differentiated with respect to time to obtain the acceleration of aortic blood.
Figure 3.
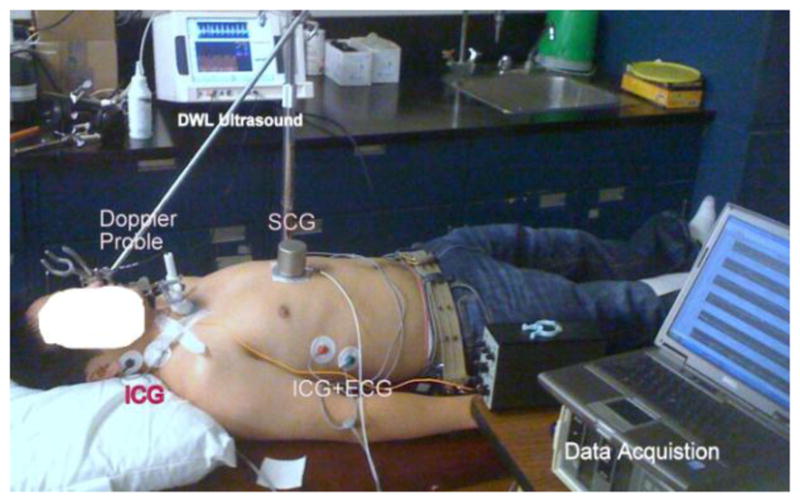
Data acquisition setup for simultaneous recording of SCG, ICG, and parasternal Doppler ultrasound from a participant in the supine position.
The ultrasound measurements in the present study were made at an insonation depth of 6.5–7.5 cm with the sample volume located 1.0 to 1.5 cm above the aortic valve. The optimum position of the probe was chosen to give the maximum peak velocity with minimal spectral broadening and a clearly identified upstroke on each beat. This was assessed from the spectrum analyzer display and also by listening to the audio-frequency Doppler signal. The velocity envelope of the Doppler signal was synchronously recorded with the seismocardiographic signal.
The velocity envelope provided the most accurate representation of the velocity profile of the blood within a beat and represented the maximum velocity of the blood at any given time. As this study was not designed to investigate absolute values of blood flow velocity but rather the changes in velocity within the aorta, the velocity envelope was an appropriate choice. The Doppler velocity was then differentiated with respect to time in Matlab™ to obtain the acceleration of the blood in the aorta.
The impedance cardiogram was recorded using a bioimpedance cardiac output monitor (BoMed NCCOM3, BoMed Instruments, Irvine, CA). Data were recorded for 10 minutes for each participant while he or she was breathing and lying still in the supine position, as shown in Fig. 3. A sampling rate of 2.5 kHz was used to record all the signals synchronously using a data acquisition system (NI 9205, National Instruments, Austin, TX).
There were 24 participants in the clinical study. Nineteen participants were young adults under the age of 33 (average age of 31 years) without any diagnosed cardiac disorder. The remaining five participants (average age of 66 years) had a history of heart attack and low ejection fraction (<35%) in the past two years. The average age and body mass index for all participants were 38.6 years and 24.4 kg/m2, respectively. The impedance cardiogram was not recorded for one participant, and the Doppler ultrasound was not recorded for another participant.
3. Results
3.1 Morphology of simulated seismocardiographic signals
Normalized simulated seismocardiographic signals for cases when the rib are considered elastic (top) and viscous (middle) are shown in Fig. 2(c) along with the temporal changes in LV volume (bottom). Although the seismocardiographic signals in the elastic and viscous cases look similar, only that in the viscous case exhibits key features during isovolumic contraction. Consistent with previous publications [5–7] and the experimental results presented in this paper, the negative and the global positive peaks occur at the beginning of isovolumic contraction and at the instant of aortic valve opening (the beginning of the ejection phase (2) during which the LV volume decreases), respectively. During ejection (2), there is a rapid decrease followed by a slow increase in the acceleration in both the elastic and viscous cases. The negative peak of acceleration in the seismocardiographic signal during the ejection phase coincides with the largest velocity and the largest acceleration of ejected blood from the ventricles in the elastic and viscous cases, respectively. Local negative and positive peaks occur during the isovolumic relaxation (3) and ventricular filling (4) phases.
3.1.1 Longitudinal displacement velocity
Since the sternum is located near the right and left ventricular apex, SCG morphology is affected by ventricular contraction in the longitudinal direction of the ventricles. To explain the origins of the negative and positive peaks in an SCG, which occur during the isovolumic contraction phase, the longitudinal displacement of the LV apex was recorded. As shown in the previous section, the viscosity of the ribs plays a major role in the formation of SCG peaks during the isovolumic phase; therefore, the longitudinal velocity of the LV apex was calculated (Fig. 2(d)). The rapid increase of longitudinal velocity during the isovolumic phase (1) results in a negative peak in the SCG since the pressure on the rib cylinder decreases. The negative peak of longitudinal velocity, which follows this positive peak, is much smaller. However, the rising LV intracavitary pressure amplifies the force acting on the rib cylinder, which, in turn, results in a pronounced positive peak of the seismocardiographic signal at the end of isovolumic contraction. The longitudinal displacement of the LV apex is illustrated in the images of the anterior ventricular surface in Fig. 2(e). This figure confirms that the longitudinal dimension of the ventricles decreases at the end of isovolumic contraction.
3.2 Effect of rib orientation on seismocardiographic signal
Changing the orientation of the rib by 15° affected the peak amplitudes in the SCG as well as the morphologies (Fig. 2(c)), signals represented by dashed lines). Unlike in the experiment (see Fig. 1), the morphology of the simulated seismocardiographic signal does not change significantly during respiration. An additional positive peak (indicated by asterisk in Fig. 2(c) appears at the beginning of isovolumic contraction and the magnitude of the negative peak decreases in both the elastic and viscous cases. The magnitude of the seismocardiographic signal also changes during the ejection and isovolumic relaxation phases of the cardiac cycle. These differences are especially pronounced in the model with a viscous term. There is a local positive peak during ventricular filling, which appears after rotation of the rib in the viscous case (indicated by X in Fig. 2(c)).
3.2.1 Experimental observations
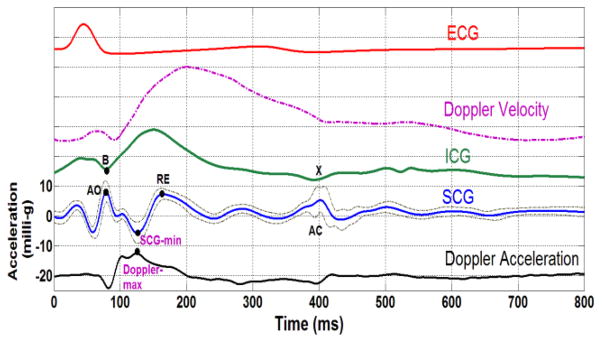
The ensemble averages of the Doppler velocity, acceleration signal, SCG, impedance cardiogram (ICG), and electro-cardiogram (ECG) for one participant are presented in Fig. 4. It can be seen that the acceleration of the blood in the aorta (black curve) begins to decrease just prior to the SCG point, which corresponds to aortic valve opening indicated in the SCG and starts to increase after the opening of the valve. This is confirmed by point B in the ICG. The acceleration reaches its global peak at approximately the same time as the SCG global minimum. To show that the global maximum of acceleration in the aorta (Doppler-max) and the minimum of the seismocardiographic signal (SCG-min) occur at approximately the same time, the experimental data were analyzed as described below.
Figure 4.
Ensemble averages of patient data over 650 cardiac cycles. From bottom to top: the acceleration of aortic blood derived from Doppler ultrasound, SCG and its 95% higher and lower confidence intervals, impedance cardiogram (dotted), Doppler velocity ultrasound (dashed dotted), and ECG from lead II (red). The Doppler ultrasound measurement in this subject was made at an insonation depth of 5.4 cm with the sample volume located 0.5 cm above the aortic valve. The participant was a 27-year- old male (weight: 75 kg; height: 167 cm). AO: aortic valve opening, AC: aortic valve closure, RE: rapid ejection period, SCG-min: global minimum of SCG, Doppler- max: global maximum of the Doppler blood acceleration signal.
Doppler-max was determined from the suprasternal Doppler ultrasound signal and compared to SCG-min, as shown in Fig. 4. For each subject, the Doppler signal was ensemble averaged over multiple heartbeats and the timing of the global maximum of the ensemble averaged signal was identified as Doppler-max. SCG-min was determined as the local minimum in the seismocardiographic signal following the aortic valve opening (the local maximum on the seismocardiographic signal after the Q-wave of the ECG) for every heartbeat.
For each subject, the data acquisition lasted 10 minutes and the final ensemble average was performed on 550 to 800 heartbeats depending on the heart rate of the individual participant. The ensemble averaging was performed by detecting the ECG’s QRS complex for each heartbeat and aligning all the signals with respect to the detected R peaks. An algorithm based on filter banks was used for the detection of the QRS wave [14].
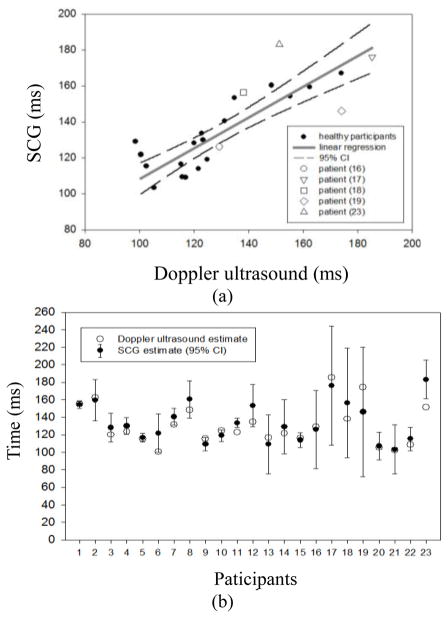
The SCG-min and Doppler-max values are presented in Table 1 and plotted in Fig. 5(a). The mean of SCG-min values (black dot) and the 95% confidence interval are shown in Fig. 5(b). The 95% confidence interval was calculated as the (mean ± 1.96 × standard deviation) of the SCG-min values. It was found that the Doppler-max values are located within the 95% confidence interval of SCG-min for 21 out of the total 23 participants for whom a Doppler recording was made. The one clear outlier was subject 23, who was one of five patients with low ejection fraction. The other exception was subject 11, for whom Doppler-max was slightly below the 95% interval while still being very close to the average (see Fig. 5(b)). A strong correlation coefficient between these two independent measures by Doppler and SCG (r = 0.85, Fig. 5(a)) and a paired t-test (p = 0.15) indicate that there is no significant difference between the two means of Doppler-max.
Table 1.
Timings of various cardiac events measured for 23 subjects. Data in columns 2–5 and 6–7 (shaded) were used in the analysis of blood acceleration in the aorta and aortic valve opening, respectively. Subjects 16, 17, 18, 19, and 23 had a history of heart attack.
| Participant | Doppler accel. Max. (ms) | Average of SCG-MIN (ms) | Higher 95% C.I. (ms) | Lower 95% C.I. (ms) | SCGAO point (ms) | ICGB point (ms) |
|---|---|---|---|---|---|---|
| 1 | 155.2 | 154.3 | 158.6 | 150.0 | 105.2 | 106.8 |
| 2 | 162.4 | 159.4 | 182.6 | 136.1 | 121.6 | 107.2 |
| 3 | 120 | 128.1 | 144.4 | 111.8 | 86.8 | 81.6 |
| 4 | 123.2 | 129.9 | 139.5 | 120.3 | 84 | 88 |
| 5 | 115.2 | 116.5 | 121.4 | 111.7 | 74.4 | 82.8 |
| 6 | 100.4 | 121.7 | 143.7 | 99.7 | 88.4 | 86 |
| 7 | 131.2 | 140.5 | 150.2 | 130.7 | 89.2 | 100 |
| 8 | 148.4 | 160.3 | 181.6 | 139.1 | 104.4 | 102.8 |
| 9 | 115.6 | 109.3 | 116.9 | 101.6 | 73.2 | 85.6 |
| 10 | 124.8 | 119.0 | 125.4 | 112.6 | 78.4 | 88 |
| 11 | 122.8 | 133.5 | 138.6 | 128.5 | 96 | 86.4 |
| 12 | 134.8 | 153.3 | 177.3 | 129.3 | 84.4 | 84.8 |
| 13 | 116.8 | 109.0 | 142.6 | 75.4 | 96 | 84 |
| 14 | 121.6 | 129.0 | 159.8 | 98.2 | 112 | 108 |
| 15 | 116 | 113.8 | 122.4 | 105.2 | 82 | 82.8 |
| 16 | 129.2 | 126.0 | 170.6 | 81.4 | 90 | 94 |
| 17 | 185.2 | 176.0 | 244.0 | 108.0 | 160 | 147.2 |
| 18 | 138 | 156.3 | 218.9 | 93.7 | 112 | 109.6 |
| 19 | 174 | 146.0 | 220.0 | 72.0 | 120 | 120 |
| 20 | 105.2 | 107.0 | 122.6 | 91.4 | 73.6 | 78.4 |
| 21 | 102.4 | 103.2 | 131.2 | 75.2 | 60.8 | 67.6 |
| 22 | 108.8 | 115.2 | 128.5 | 101.9 | 109.6 | 108 |
| 23 | 151.2 | 183.1 | 205.1 | 161.1 | 112 | - |
| 24 | - | - | - | - | 116.4 | 115.2 |
| Average ± std | 130.6 ±23 | 134.4 ±23 | - | - | 96.26 ±21.5 | 95.43 ±17.38 |
C.I.: confidence interval
Figure 5.
A: SCG-min vs. Doppler-max (linear regression: SCG-min = (0.87 ± 0.1) × Doppler-max + (22.6 ± 15.2) ms). B: SCG-min and Doppler-max for each subject.
Since subject number 23 had a pacemaker, the ICG could not be recorded for safety reasons but in the other 23 subjects for whom a ICG recording was made, the time of aortic valve opening was calculated from SCG and ICG, respectively. Due to noise in the baseline (zero velocity) signal of the Doppler ultrasound, the aortic blood flow velocity could not be used to determine the aortic valve opening. The aortic valve opening point was estimated from the ensemble averaged ICG signal by determining the B point and from the local maximum of SCG after the ECG R-wave (Table 1). A paired t-test (p = 0.92) indicates that the null hypothesis that the means of the two methods are equal cannot be rejected. Finally, Bland and Altman analysis [15] yielded a mean bias of 0.15 ms with a standard error of 1.54 ms and lower and upper limits of agreement of −14.6 ms and 14.9 ms, respectively (Fig. 6). An M-mode echocardiography study also found that the first positive peak in the SCG comes after the ECG R-wave due to the opening of aortic valve [4].
Figure 6.
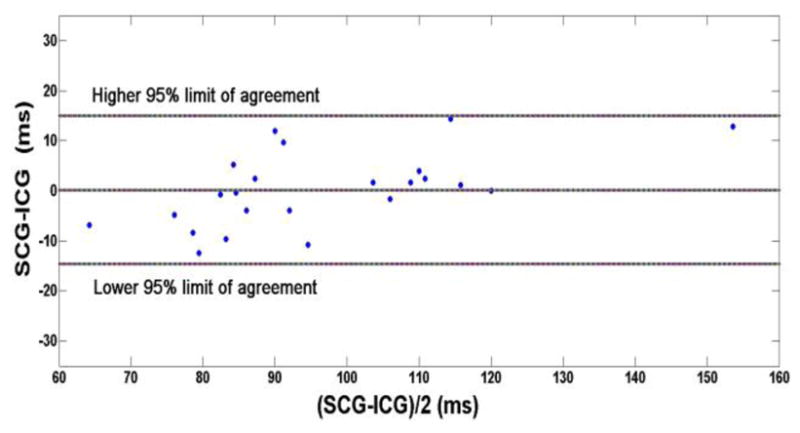
Bland and Altman comparison of SCG and ICG measurements of aortic valve opening derived from the last two columns of Table 1.
4. Discussion
This study employed a modified image-based anatomically accurate canine model of ventricular contraction to investigate SCG morphology and to explain the morphology of clinically recorded SCG. The main findings of this study are as follows: The simulation results reveal that the SCG peaks corresponding to aortic valve opening and maximum acceleration of the blood in the aorta result from ventricular contraction in the longitudinal direction of the ventricles and decrease in the dimensions of the ventricles due to the ejection of blood. Both the elastic and viscous properties of the chest affect the seismocardiographic signal morphology. The isovolumic peaks of the seismocardiographic signal arise from the longitudinal contraction of the ventricles. Doppler-max and SCG-min are related peaks in the Doppler and seismocardiographic signals. The relationship between these two signals was observed in both experiments and simulations. The model results suggest that the rotation of the rib with respect to the heart has a minor effect on seismocardiographic signal morphology during the respiratory cycle.
4.1 Elastic and viscous components of seismocardiographic signal
To explain the SCG morphology, the seismocardiographic signal was simulated in the model with either elastic or viscous properties of the chest. The major peaks in the experimental SCG can be found on the SCG computed from the model with the elastic or viscous case (see Fig. 2(c)). The seismocardiographic signal of the viscous case contains a peak that corresponds to aortic valve opening, as observed in the experiments. The negative peak in the SCG at the ejection phase (SCG-min), which occurs at the maximum acceleration of blood flow in the aorta, was found in the simulated seismocardiographic signal for the elastic case. Representing the ribs with both viscous and elastic properties would likely produce a signal that exhibits the morphology observed in the experiment.
4.2 Changes in longitudinal displacement velocity during isovolumic contraction
The negative and positive peaks during the isovolumic phase of contraction are key features of SCG morphology during systole. The results demonstrate that the negative peak arises due to longitudinal displacement of the ventricles. During isovolumic contraction, the LV apex moves rapidly towards the base, as evidenced by an increase in longitudinal velocity. The longitudinal velocity then decreases at the end of isovolumic contraction. These changes in longitudinal velocity are consistent with experimental recordings of longitudinal strain [16].
In the framework of the model, contraction in the longitudinal direction is explained by the ventricular activation sequence and the fiber geometry of the heart. The electrical impulse travels through the Purkinje network to the endocardium, the inner most layer of the working myocardium. The endocardial myofibers are oriented preferentially longitudinally. Activation of these myofibers results in the development of active stress in the longitudinal direction, which in turn leads to longitudinal contraction of the ventricles. Then, electrical activation propagates transmurally from the endocardium to the epicardium (outer layer of the ventricles), resulting in activation of myofibers oriented more circumferentially. As these layers contract, the short-axis diameter of the ventricles decreases, and since the ventricular volume is constant, the shortening of these circumferentially oriented myofibers impedes longitudinal contraction, leading to a positive peak in the SCG. Other factors that may determine the positive isovolumic peak in the SCG include the asymmetry in contraction between the right and left ventricles and increasing intracavitary pressure.
4.3 Comparison of SCG in simulations and the experiment
The simulation results provide an interpretation of the experimental findings described above. The origins of SCG peaks during the isovolumic contraction phase, and in particular the origin of the aortic valve opening peak, have been elucidated. In this section, the morphology of the signal during the ejection and isovolumic relaxation phases of cardiac cycle is analyzed. It is difficult to definitively determine the origin of all peaks in the experimental SCG. Therefore, the analysis is limited to the major peaks.
In the model, the maximum acceleration of the blood in the aorta (Doppler-max) coincides with the negative peak in the SCG (SCG-min) for the elastic case. During ejection, the dimensions of the ventricles decrease, thus releasing the pressure of the ventricles acting on the ribs. Note that because the aortic valve opens instantly and inertia of blood flow is not taken into account in the model, there are no slow and rapid phases of ejection (Fig. 2(c)). Therefore, in contrast to the experimental data, the maximum acceleration of blood ejected from the ventricles and the negative peak in the SCG for the elastic case occur right at the beginning of ejection.
The experimental positive peak of rapid ejection (RE) follows SCG-min at the beginning of the ejection phase (see Fig. 4). In the model, this peak corresponds to a positive peak of the simulated SCG in the elastic case (see phase (2) in Fig. 2(c)). Similar to Doppler-max, this peak is related to the acceleration of blood ejected from the ventricles, which decreases when this peak occurs.
The acceleration in the experimental SCG decreases following the peak of aortic valve closing (see peak AC in Fig. 4). The model reproduces this finding and reveals that this decrease in acceleration, which occurs in both the elastic and viscous cases (see phase (3) in Fig. 2(c)), arises from a decrease in the intraventricular pressure during relaxation.
4.4 Effect of rib orientation on SCG morphology
The results demonstrate that changes in the amplitude and morphology of the seismocardiographic signal can be only partially attributed to the changes in orientation of the heart relative to the chest during respiration. Rotation of the cylinder, which represents a rib, results in new peaks right before the isovolumic contraction and at the beginning of the ventricular filling phase (see Fig. 2c, SCG peaks marked by asterisk and X). However, the simulations do not reveal drastic changes in the SCG, as observed experimentally. There may be additional mechanisms that underlie the amplitude and morphology of the seismocardiographic signal. Specifically, the increased pulmonic pressure during inspiration elevates the afterload of the right ventricle and end-systolic right ventricular pressure [17], thus increasing the pressure of the ventricles acting on the chest. In addition, respiration leads to changes in LV contraction. These alternative mechanisms will be tested with the model in the future.
4.5 Limitations
This study is the first step in the modeling of the interaction between the heart and external objects. The particular configuration of the external objects affects the seismocardiographic signal as well as overall cardiac contraction; thus, further studies with a more detailed model of external organs and the chest are required. The aim of the present study was to reproduce only the general shape of the seismocardiographic signal, for which a two-cylinder configuration is sufficient.
A model of canine ventricular electromechanics was employed to simulate seismocardiographic signals, which were compared to clinical data. Both human and canine ventricular walls have similar fiber geometry, in which the fibers rotate transmurally. Because the durations of different cardiac cycle phases are different for canines and humans, the absolute values of the timings of SCG peaks were not compared.
Acknowledgments
This study was supported by US NSF grant CBET- 0601935 and NIH grants R01-HL063195, R01- HL082729, and F31-HL103090 (J.C.). We would like to thank Brandon Ngai and Amanmeet Garg for help in data acquisition.
References
- 1.Weissler AM, editor. Noninvasive Cardiology. New York: Grune & Stratton; 1974. [Google Scholar]
- 2.Stapleton JF, Groves BM. Precordial palpation. Am Heart J. 1971;81:409–427. doi: 10.1016/0002-8703(71)90112-8. [DOI] [PubMed] [Google Scholar]
- 3.Perloff JK, editor. Physical Examination of the Heart and Circulation. Shelton, CT: People’s Medical Publishing House; 2009. [Google Scholar]
- 4.Crow RS, Hannan P, Jacobs D, Hedquist L, Salerno DM. Relationship between seismocardiogram and echocardiogram for events in the cardiac cycle. Am J Noninvasive Cardiol. 1994;8:39–46. [Google Scholar]
- 5.Giorgis L, Hernandez A, Amblard A, Senhadji L, Cazeau S, Jauvert G, Donal E. Analysis of cardiac micro-acceleration signals for the estimation of systolic and diastolic time intervals in cardiac resynchronization therapy. Computers in Cardiology. 2008;35:393–396. [Google Scholar]
- 6.Akhbardeh A, Tavakolian K, Gurev V, Lee T, New W, Kaminska B, Trayanova N. Comparative analysis of three different modalities for characterization of the seismocardiogram. Conf Proc IEEE Eng Med Biol Soc. 2009:2899–2903. doi: 10.1109/IEMBS.2009.5334444. [DOI] [PMC free article] [PubMed] [Google Scholar]
- 7.Tavakolian K, Vaseghi A, Kaminska B. Improvement of ballistocardiogram processing by inclusion of respiration information. Physiol Meas. 2008;29:771–781. doi: 10.1088/0967-3334/29/7/006. [DOI] [PubMed] [Google Scholar]
- 8.Korzeniowska-Kubacka I, Kumierczyk-Droszcz B, Biliska M, Dobraszkiewicz-Wasilewska B, Piotrowicz KMR. Seismocardiography-a non-invasive method of assessing systolic and diastolic left ventricular function in ischaemic heart disease. Folia Cardiol. 2006;13:319–325. [Google Scholar]
- 9.Libonati JR, Colby AM, Caldwell TM, Kasparian R, Glassberg HL. Systolic and diastolic cardiac function time intervals and exercise capacity in women. Medicine & Science in Sports & Exercise. 1999;31:258–263. doi: 10.1097/00005768-199902000-00009. [DOI] [PubMed] [Google Scholar]
- 10.Starr I, Noordergraaf A, editors. Ballistocardiography in Cardiovascular Research: Physical Aspects of the Circulation in Health and Disease. Philadelphia: Lippincott; 1967. [Google Scholar]
- 11.Stork M, Trefny Z. Quantitative seismocardiography system with separate QRS detection. Analysis of biomedical signals and images: 15th Biennial Int EURASIP Conf Euroconference Biosignal; 2010. pp. 61–68. [Google Scholar]
- 12.Gurev V, Lee T, Constantino J, Arevalo H, Trayanova NA. Models of cardiac electromechanics based on individual hearts imaging data: image-based electromechanical models of the heart. Biomech Model Mechanobiol. 2011;10:295–306. doi: 10.1007/s10237-010-0235-5. [DOI] [PMC free article] [PubMed] [Google Scholar]
- 13.INRIA. Asclepios Research Project. available: https://gforge.inria.fr/frs/?group_id=726.
- 14.Afonso VX, Tompkins WJ, Nguyen TQ, Luo S. ECG beat detection using filter banks. IEEE Trans Biomed Eng. 1999;46:192–202. doi: 10.1109/10.740882. [DOI] [PubMed] [Google Scholar]
- 15.Martin-Bland J, Altman DG. Statistical methods for assessing agreement between two methods of clinical measurement. Lancet. 1986;327:307–310. [PubMed] [Google Scholar]
- 16.Edvardsen T, Gerber BL, Garot J, Bluemke DA, Lima JA, Smiseth OA. Quantitative assessment of intrinsic regional myocardial deformation by Doppler strain rate echocardiography in humans: validation against three- dimensional tagged magnetic resonance imaging. Circulation. 2002;106:50–56. doi: 10.1161/01.cir.0000019907.77526.75. [DOI] [PubMed] [Google Scholar]
- 17.Jardin F, Delorme G, Hardy A, Auvert B, Beauchet A, Bourdarias JP. Reevaluation of hemodynamic consequences of positive pressure ventilation: emphasis on cyclic right ventricular afterloading by mechanical lung inflation. Anesthesiology. 1990;72:966–970. doi: 10.1097/00000542-199006000-00003. [DOI] [PubMed] [Google Scholar]


