

Abstract
Ventral tegmental area (VTA) dopamine neurons are crucial for appetitive responses to Pavlovian cues, including cue-induced reinstatement of drug seeking. However, it is unknown which VTA inputs help activate these neurons, transducing stimuli into salient cues that drive drug-seeking behavior. Here we examined 56 VTA afferents from forebrain and midbrain that are Fos activated during cue-induced reinstatement. We injected the retrograde tracer cholera toxin β subunit (CTb) unilaterally into rostral or caudal VTA of male rats. All animals were trained to self-administer cocaine, then extinguished of this behavior. On a final test day, animals were exposed to response-contingent cocaine-associated cues, extinction conditions, a non-cocaine-predictive CS−, or a novel environment, and brains were processed to visualize CTb and Fos immunoreactivity to identify VTA afferents activated in relation to behaviors. VTA-projecting neurons in subregions of medial accumbens shell, ventral pallidum, elements of extended amygdala, and lateral septum (but not prefrontal cortex) were activated specifically during cue-induced cocaine seeking, and some of these were also activated proportionately to the degree of cocaine seeking. Surprisingly, though efferents from the lateral hypothalamic orexin field were also Fos activated during reinstatement, these were largely non-orexinergic. Also, VTA afferents from the rostromedial tegmental nucleus and lateral habenula were specifically activated during extinction and CS− tests, when cocaine was not expected. These findings point to a select set of subcortical nuclei which provide reinstatement-related inputs to VTA, translating conditioned stimuli into cocaine-seeking behavior.
Introduction
The ventral tegmental area (VTA) is important for reward-seeking behaviors, especially when these behaviors are triggered by Pavlovian cues (Roitman et al., 2004; Yun et al., 2004; Corbit et al., 2007; Kufahl et al., 2009; Zijlstra et al., 2009). VTA contains dopamine (DA) and non-DA neurons, and both are involved in the reinforcing and motivational effects of natural and drug rewards (Wise and Bozarth, 1981; Ikemoto and Panksepp, 1999; Salamone et al., 2007; Schultz, 2010).
Although VTA and its forebrain targets are essential for conditioned reward seeking, the inputs that control VTA responses to cues are poorly understood. Recent studies have examined Fos activation of VTA afferents after stimulant administration and opiate conditioned place preference (Colussi-Mas et al., 2007; Geisler et al., 2008; Fanous et al., 2011; Richardson and Aston-Jones, 2012), but none have examined VTA inputs activated by response-contingent cues (conditioned reinforcers) that drive instrumental drug seeking or reinstatement. This is an important question, as such discrete cues can strongly activate VTA DA neurons, and this activation is necessary for stimulus-triggered appetitive motivation (Berridge, 2007; Schultz, 2007; Wanat et al., 2009).
VTA receives inputs from a wide range of structures that release classical and peptide transmitters, and modulate reward-related functions of VTA (Phillipson, 1979; Ikemoto and Panksepp, 1999; Geisler and Zahm, 2005; Geisler et al., 2007, 2008; Wise and Morales, 2010). For example, prefrontal cortex, hypothalamus, and brainstem nuclei are major sources of glutamate inputs to VTA, whereas accumbens, ventral pallidum, lateral septum, and rostromedial tegmentum are major GABA inputs (Swanson and Cowan, 1979; Johnson et al., 1996; Geisler et al., 2007; Jhou et al., 2009b; Kaufling et al., 2010; Sesack and Grace, 2010). Both VTA glutamate and orexin transmission are required for cue-induced cocaine seeking (You et al., 2007; James et al., 2011; Mahler et al., 2012b), and GABA and peptide signaling there have also been implicated in conditioned drug seeking (Bechtholt and Cunningham, 2005; Sahraei et al., 2005; Li et al., 2009; Zhang et al., 2009; Luo et al., 2011). However, the particular afferents providing these reinstatement-related neurochemical inputs to VTA are largely unknown.
Furthermore, VTA contains multiple anatomically and functionally diverse subregions that may play distinct roles in conditioned drug seeking. For example, rostral versus caudal VTA have distinct histological features, and play distinct roles in reward-related behaviors (Johnson and North, 1992; Ikemoto et al., 1997; Carlezon et al., 2000; Ikemoto, 2007; Soderman and Unterwald, 2008). However, inputs to these VTA subregions are poorly characterized to date.
Here, we used a combination of anatomical tract-tracing, Fos immunohistochemistry, and behavioral analyses to characterize forebrain and midbrain projections to rostral vs caudal VTA, and to examine which of these projections were specifically recruited in relation to cocaine-seeking behavior in a cue-induced reinstatement procedure. Our findings therefore identify a restricted set of subcortical VTA afferents that participate in cue-triggered cocaine-seeking, and potentially are involved in cue-induced relapse in addictive disorders.
Materials and Methods
Subjects
Male Sprague Dawley rats (Charles River; n = 25) weighing between 250 and 350 g were used in these experiments. Rats were pair- or single-housed in a reverse 12 h light cycle, in clear tub cages with corn cob bedding, and ad libitum food and water. All procedures were approved by the Medical University of South Carolina's Institutional Animal Care and Use Committee.
Surgery
Animals were anesthetized with ketamine/xylazine (56.5/8.7 mg/kg), and received the non-opioid analgesic meloxicam (1 mg/kg). Chronic indwelling catheters were inserted into the right jugular vein, and exited the body via a port between the scapulae. During the same surgery, animals received intra-VTA pressure injections of ∼40 nl of cholera toxin β subunit using a stereotaxic device, aimed at either rostral or caudal VTA [relative to bregma: anteroposterior (AP), −5.3 (rostral) or −5.8 (caudal); mediolateral, +0.8; dorsoventral, −8.3). Micropressure injections were made with a Picospritzer (General Valve, Inc) via a glass pipette (internal diameter 10–15 μm), in ∼2–5 nl boluses over 5 min. Pipettes were left in place for an additional 20 min to minimize diffusion up the pipette track. Animals received prophylactic cefazolin (10 mg, i.v.) and heparin (10 U) daily starting 3 d after surgery and daily following self-administration training sessions, and were allowed to recover for 1 week before self-administration training.
Drugs and retrograde tracer
Cocaine HCl (NIDA) was dissolved in 0.9% sterile saline. The retrograde tracer cholera toxin β subunit (CTb; Sigma) was dissolved at a 0.5% concentration in 0.1 m PBS.
Behavioral training
Animals were handled for 5 min each day for at least 3 d before beginning self-administration training. Behavioral training and testing took place in Med Associates operant chambers located in a sound-attenuating box and equipped with two retractable levers with white lights above them, a red house light, and a tone generator. Intravenous cocaine was administered via a pump located outside the sound-attenuating box. Rats received 10 daily 2 h cocaine self-administration sessions (>10 cocaine infusions/day, 0.2 mg/50 μl infusion). Pressing one lever (active lever; fixed ratio 1 schedule) yielded a 3.6 s cocaine infusion, 2.9 kHz tone, and light presented above the active lever. A 20 s timeout period (signaled by turning off the house light) followed, during which additional lever presses yielded nothing. Presses on the other lever (inactive lever) had no consequences at any time.
One of the control groups (CS− group, n = 4) underwent an additional training session each day before the last 5 d of cocaine self-administration training sessions. In these 30 min sessions, animals were placed in physically distinct Med Associates boxes (taller boxes, with nonmodular steel walls). Here, they received 30 presentations of a CS− stimulus (1 Hz flashing light and tone for 8 s), non-contingently on a VI-60 s schedule. Levers were present during this session, and though presses on them were recorded, they yielded neither cocaine nor cue presentations. After this CS− training session, animals were removed from boxes and placed back in their home cages for 120 min. They were then placed in physically distinct Med Associates boxes, and underwent normal cocaine self-administration training as described above.
Upon completion of self-administration training, animals received at least 7 d of extinction training, during which active lever presses yielded neither cocaine nor tone/light cues. Rats received extinction training until they pressed <25 times on the active lever for two or more consecutive days.
Reinstatement and control behavior testing
Animals were randomly assigned to one of four experimental groups (CS+ reinstatement, and extinction, CS−, and locomotor control groups)—all of which underwent one additional 2 h session. Immediately following this session, animals were deeply anesthetized and killed. For the CS+ group (n = 8), active lever presses yielded the same tone/light presentations that had previously been paired with cocaine, but no cocaine was delivered in this session. As in self-administration training, cue presentations were followed by 20 s timeout periods during which lever presses were recorded but yielded no additional cue presentations. This procedure involves response-contingent presentations of cocaine cues, which therefore serve as conditioned reinforcers to reinstate cocaine seeking. Although use of this procedure is common for examining the neural substrates of cue-triggered cocaine seeking, it should not be confused with paradigms using non-contingent cue presentations to elicit appetitive motivation (e.g., Pavlovian to instrumental transfer or discriminative stimulus cue paradigms). In fact, cue-triggered motivation and conditioned reinforcement involve somewhat different neural substrates (Ito et al., 2000; Robbins and Everitt, 2002; Robbins et al., 2008).
Three control groups were compared with reinstatement animals, to allow identification of Fos expression in VTA afferents that is specific to conditioned cocaine seeking. An extinction control group (n = 7) received an additional 2 h extinction training session, where lever presses yielded neither cocaine nor cues. This group controlled for effects on Fos expression of mere exposure to a previously cocaine-paired, but subsequently extinguished context. A CS− control group (n = 4) underwent a 2 h session during which a distinct CS− stimulus was intermittently delivered (as during training, in the same box in which CS− training occurred, described above). Presses on both levers were recorded, but had no programmed consequences. It is important to note that stimuli were delivered non-contingently in CS− animals, unlike in CS+ animals. This was to provide relatively equivalent exposure to CS− stimuli (which predicted cocaine nonavailability, and therefore would not be likely to be self-administered), and CS+ stimuli (which elicited lever pressing during reinstatement sessions). The CS− group therefore controlled for effects on Fos of exposure to lights and tones that signaled lack of cocaine availability (though note that this group had equivalent self-administration/extinction history as other groups). Locomotor control group animals (n = 6) were placed in a novel environment, consisting of a rectangular chamber (40 × 40 × 30 cm) with clear plastic sides, corncob bedding, a 16 × 16 photobeam array to measure horizontal activity, and 16 additional beams to measure vertical activity (rearing). Locomotion was recorded in 5 min bins for 2 h with DigiPro software (Omnitech Electronics). This group controlled for effects on Fos of general locomotor activity or arousal, though the particular behaviors emitted during exploration of a novel environment are not the same as those emitted during instrumental drug seeking in the CS+ group.
Tissue preparation
Immediately following this last behavioral testing session, animals were deeply anesthetized with ketamine/xylazine, and transcardially perfused with 0.9% saline followed by 4% paraformaldehyde. Brains were removed and postfixed overnight, then cryoprotected in a 20% sucrose-azide solution. Frozen coronal sections (40 μm) were cut on a cryostat and collected from the level of the prefrontal cortex through the midbrain, and stored in PBS-azide.
Immunohistochemistry
Sections at 200 μm intervals (80 μm intervals in the area of VTA CTB injection sites) were stained for Fos and CTb using previously described procedures (Sartor and Aston-Jones, 2012). Briefly, sections were incubated in a rabbit anti-Fos primary antibody overnight (1:2000; Santa Cruz Biotechnology), followed by 2 h in a donkey anti-rabbit secondary (1:500, Jackson ImmunoResearch Laboratories), amplified with the avidin biotin complex (ABC; Vector Labs) method (1:500), and visualized with 3, 3′ diaminobenzidine (DAB) + nickel ammonium sulfate to yield a blue-black nuclear reaction product. CTb was subsequently visualized with a goat anti-CTb primary antibody (1:20,000; List Biological Laboratories), donkey anti-goat secondary (1:500, Jackson ImmunoResearch Laboratories), ABC, and DAB to yield a brown somatic stain in VTA-projecting cells.
Sections from the same brains at ∼2.8 and 3.2 mm caudal of bregma (near the center of the orexin field of the hypothalamus) were also stained for Fos, CTb, and orexinA using fluorescent immunohistochemistry. Rabbit anti-Fos (1:2500; Santa Cruz Biotechnology), mouse anti-CTb (1:500; AbD Serotec), and goat anti-orexinA (1:500; Jackson ImmunoResearch Laboratories) primaries were mixed, and sections were incubated overnight at room temperature. After washing, sections were incubated in donkey anti-rabbit Alexa Fluor 594 (1:500; Invitrogen) and donkey anti-mouse Alexa Fluor 488 (1:500; Invitrogen) secondary antibodies at room temperature for 4 h, washed, then incubated in biotinylated donkey anti-goat secondary antibody (1:100; Jackson ImmunoResearch Laboratories) for 3 d at 4°C. Finally, sections were incubated in a streptavidin-conjugated Alexa Fluor 350 chromogen (1:100; Invitrogen) for 4 h at room temperature. Slices were mounted and coverslipped with Citifluor mounting medium, and stored at 4°C until photographed at 20× magnification with a Leica fluorescent microscope.
Quantification of immunoreactivity
Rostral-caudal spread of CTb injection sites was quantified at 5× magnification using a Leica microscope, and compared with a rat brain atlas (Paxinos and Watson, 2007) to localize tracer injections (Fig. 1). Most injections spread to both medial and lateral sites within VTA. Brains with >15% of CTb injections located outside the borders of VTA were excluded from analyses. For primary analyses of behavior-related activation of VTA afferents, brain regions with substantial projections to VTA (significant numbers of CTb+ neurons), or that were previously reported to project moderately or heavily to VTA, were photographed at 10× magnification using a Leica microscope and OpenLab or Stereoinvestigator software. Photographs were compiled into mosaics (either manually in Adobe Illustrator, or automatically using the Steroinvestigator Virtual Slice module) to provide a wider, high resolution view of regions of interest with reference to anatomical landmarks. Neurons expressing CTb alone, or CTb + Fos, were quantified offline in Adobe Illustrator by an observer blind to experimental conditions. All CTb+ neurons were counted, and the total number of VTA-projecting neurons on a given slice (with or without Fos+ nuclei) within a given structure ipsilateral to the CTb injection site were counted. Multiple sections (3–6 slices/animal at 200 μm intervals, depending on the AP extent of the structure) were analyzed, and an average for each structure of interest in each animal was computed (number of CTb+ neurons, number of CTb+/Fos+ neurons, and percentage CTb+ neurons that were also Fos+). The structures quantified in this manner are listed in Table 1. Labeling was quantified only in the hemisphere in which CTb was injected, as most forebrain projections to VTA are predominantly ipsilateral (Geisler and Zahm, 2005). Borders of brain regions were determined with reference to anatomical landmarks, based on Paxinos and Watson (2007) and Swanson (1992) brain atlases.
Figure 1.
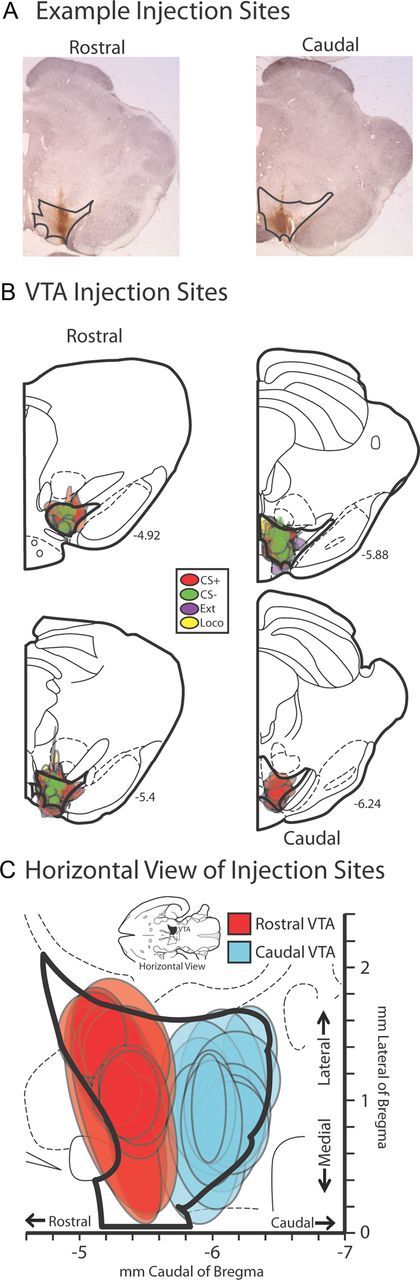
Localization of retrograde tracer injections in VTA. A, Representative examples of CTb injection sites in coronal views for rostral and caudal VTA. Darker black lines delineate the borders of VTA on each section. B, CTb injection sites from all animals are plotted in coronal views (mm caudal of bregma is noted for each slice). Colored areas represent the maximal extent of CTb injections in individual behaviorally tested animals. Red, cue reinstatement group (CS+); green, non-cocaine-associated cue control group (CS−); purple, extinction control group (Ext); yellow, novel environment locomotor control group (Loco). C, Injection sites from all animals are represented in a horizontal view, with colored areas representing maximal spread of CTb injection sites in individual animals, color coded based upon tracer placements in rostral (blue, n = 13) or caudal (red, n = 12) VTA. Coordinates relative to bregma are shown on the abscissa (rostral/caudal) and ordinate (medial/lateral).
Table 1.
Afferents to rostral versus caudal VTA
| Structure/Macrosystem | Subregion | CTb cells/slice |
|||
|---|---|---|---|---|---|
| Rostral VTA |
Caudal VTA |
||||
| Mean | SEM | Mean | SEM | ||
| Extended amygdala | AA | 16.6 | 3.2 | 13.3 | 2.6 |
| DBNST | 19.9* | 2.9 | 10.6 | 1.8 | |
| VBNST | 30.1* | 4.5 | 16.7 | 2.4 | |
| IPAC | 9.1* | 2.2 | 4.1 | 0.7 | |
| MeA | 7.2 | 1.2 | 6.1 | 1.1 | |
| CeA | 18.9* | 3.9 | 8.8 | 1.2 | |
| SLEA | 34.3 | 4.3 | 26.9 | 4.2 | |
| Stia | 4.2 | 1.0 | 3.0 | 0.7 | |
| Accumbens core | Core | 18.8 | 5.4 | 8.5 | 1.7 |
| Accumbens shell | Rostral Pole | 4.0 | 0.8 | 2.7 | 0.7 |
| Rostral-DM | 27.1 | 6.9 | 13.9 | 3.0 | |
| Rostral-VM | 26.8 | 5.7 | 21.4 | 6.2 | |
| Caudal-DM | 33.8 | 10.9 | 14.3 | 2.4 | |
| Caudal-VM | 47.8* | 6.5 | 29.3 | 5.7 | |
| Lateral | 16.6 | 3.5 | 18.0 | 4.4 | |
| Pallidum | VP | 61.0 | 7.7 | 48.4 | 8.1 |
| Septum | LS | 29.3 | 5.3 | 21.2 | 5.0 |
| MS | 18.4 | 5.5 | 14.2 | 4.2 | |
| Cortex-like amygdala | BLA | 1.9 | 0.4 | 1.3 | 0.3 |
| BMA | 9.1 | 1.9 | 4.9 | 1.3 | |
| Prefrontal cortex | CG1 | 3.2 | 0.8 | 2.6 | 0.6 |
| CG2 | 5.2 | 1.2 | 3.5 | 0.8 | |
| PLC | 19.9 | 2.1 | 20.6 | 5.5 | |
| ILC | 21.1 | 2.8 | 16.3 | 3.1 | |
| DP | 28.8 | 3.1 | 25.5 | 5.0 | |
| DTT | 40.1 | 10.5 | 26.0 | 4.1 | |
| NavN | 10.8 | 2.4 | 7.0 | 1.5 | |
| MOFC | 12.3 | 2.1 | 10.1 | 3.4 | |
| DLOFC | 6.8 | 2.2 | 3.5 | 1.8 | |
| LOFC | 11.4 | 2.0 | 9.5 | 2.6 | |
| VOFC | 9.5 | 1.9 | 5.3 | 1.4 | |
| DEn | 20.1 | 2.4 | 14.9 | 2.2 | |
| Claust | 13.2 | 2.4 | 9.6 | 1.4 | |
| Hypothalamus | AH | 17.5 | 3.0 | 13.4 | 3.3 |
| PH | 19.6 | 2.9 | 21.0 | 4.1 | |
| LH | 56.6 | 4.9 | 46.2 | 7.3 | |
| VMLH | 5.9 | 1.1 | 7.1 | 1.4 | |
| DMH | 31.7 | 3.8 | 28.6 | 4.6 | |
| VMH | 5.1 | 0.8 | 5.1 | 1.1 | |
| PFA | 27.0 | 3.0 | 31.1 | 5.0 | |
| LPO | 61.1 | 12.1 | 55.7 | 12.4 | |
| MPO | 51.9 | 9.3 | 42.9 | 7.8 | |
| PVH | 14.8 | 3.8 | 12.0 | 3.4 | |
| pmamm | 16.8 | 5.1 | 17.9 | 4.8 | |
| Habenula | MHb | 2.1 | 0.7 | 1.1 | 0.3 |
| LHb | 26.9 | 4.1 | 31.3 | 9.1 | |
| Raphe nucleus | Dorsal | 53.1 | 5.6 | 50.1 | 6.0 |
| Medial | 7.6 | 1.6 | 5.3 | 1.4 | |
| Paramedial | 7.7 | 1.1 | 5.7 | 0.9 | |
| PPT-Caudal | 44.2 | 5.6 | 33.2 | 4.7 | |
| RMTg/tVTA | 55.0 | 6.6 | 39.9 | 5.4 | |
| SC | 15.8 | 4.0 | 18.8 | 2.9 | |
Mean ± SEM CTb + cells per slice for forebrain and midbrain projections to rostral versus caudal VTA are shown.
*p < 0.05, stronger projection to the rostral than to the caudal VTA. All SEM values are variance values. AH, Anterior hypothalamus; BMA, basomedial amygdala; DLOFC, dorsolateral orbitofrontal cortex; LOFC, lateral orbitofrontal cortex; MHb, medial habenula, MOFC, medial orbitofrontal cortex; NavN, navicular nucleus; PVH, paraventricular hypothalamus; PH, posterior hypothalamus; pmamm, premammilary nucleus; RMTg/tVTA, rostromedial tegmental nucleus/tail of the ventral tegmental area; SC, superior colliculus; VOFC, ventral orbitofrontal cortex. Other abbreviations provided in the text.
For analysis of Fos activation in VTA-projecting orexin neurons, photographs were taken of fluorescently stained tissue at 20× magnification, at ∼2.8 and 3.2 mm caudal to bregma. Photomicrographs were centered on the areas of observed maximal orexinA expression within dorsomedial, perifornical, and lateral orexin fields (as defined by Harris et al., 2005), in the hemisphere ipsilateral to VTA CTb injections. All photos were entirely contained within the hypothalamic subnucleus of interest, so all neurons in each visual field (medial/lateral: 650 μm; dorsal/ventral: 500 μm) were quantified. Fos (Alexa Fluor 594 red), CTb (Alexa Fluor 488 green), and orexinA (Alexa Fluor 350 blue) channels were photographed separately, and layered in Photoshop for quantification. Each subnucleus was photographed in 2 sections/animal, and average numbers of Fos+, CTb+, and orexin+ (and costained neurons) were computed for each animal for subsequent analyses.
Analyses and statistics
Tract-tracing.
We computed the average number of CTb+ cells/section for each structure in each rat (in the coronal plane), and report the mean (±SEM) of these data in Table 1—based upon the strategy used in previous reports (Colussi-Mas et al., 2007; Geisler et al., 2008; Mejías-Aponte et al., 2009; Sartor and Aston-Jones, 2012). This analysis was not intended to quantify the total number of VTA-projecting cells in each structure, but rather to provide information about the relative projections to VTA from various regions. As sections at similar levels throughout each structure were obtained from all animals (so the area in which CTb+ cells were counted was equivalent across animals), we directly compared the total number of CTb+ cells/slice/structure between animals with CTb injections in rostral vs caudal VTA. This comparison was performed for each afferent structure with between-subjects t tests.
Behavioral analyses.
Self-administration and extinction behavior was compared between behavioral groups with mixed ANOVAs (between-subjects variable=behavioral group, within-subjects variable=day of self-administration or extinction training). Efficacy of extinction training was verified with a repeated-measures ANOVA on lever presses across the first 7 d of extinction training. Cocaine-seeking behavior on test day was examined by comparing active lever pressing in the first 30 min of cue reinstatement, extinction, and CS− test sessions using a between-subjects ANOVA. Cue-induced reinstatement was verified in the CS+ group with a paired samples t test comparing lever pressing on test day to the average of pressing on the last two d of extinction. Within session patterns of pressing and locomotion were examined with repeated-measures ANOVAs comparing active lever presses in the six 5 min bins encompassing the first 30 min of CS+, CS−, extinction, and locomotor test sessions.
Fos activation in VTA afferents
Our goal was to examine Fos activation of VTA afferents that was related to behavior; therefore, all analyses were focused on behavior emitted in the first 30 min of behavioral test days of all four groups (CS+, CS−, extinction, locomotion). This period was chosen because more reinstatement behavior occurs in the first 30 min of cue-induced reinstatement tests than in later periods (Smith et al., 2009; Smith and Aston-Jones, 2012), and because Fos expression is maximal at 60–90 min after a behavioral manipulation, corresponding to the first 30 min of behavioral test sessions here. Analyses of Fos activation of VTA afferents were performed with between-subjects ANOVAs comparing the percentage of Fos+ CTb neurons in each structure between the four behavioral groups. Tukey post hoc tests were used to examine the nature of significant main effects. Correlations of Fos expression with behaviors were conducted with Pearson r tests comparing active lever presses or locomotor behavior (horizontal or vertical beam breaks in the locomotor control group) with the percentage of VTA-projecting neurons that were also Fos+ (%Fos+/CTb+) for each structure of interest. Correlations were computed in three ways: 1) between %Fos+/CTb+ neurons and active lever presses for all groups in which cocaine seeking was measured (reinstatement, extinction, and CS− groups; hereafter called “cocaine seeking”), 2) between %Fos+/CTb+ neurons and active lever pressing within the reinstatement group alone (hereafter called “reinstatement behavior”), and 3) between %Fos+/CTb+ neurons and locomotor behavior (horizontal or vertical) in the locomotor control group (Table 2).
Table 2.
Correlations between Fos expression in VTA afferents and behavior
| Structure/Macrosystem | Subregion | Lever presses/% Fos + CTb cells |
Beam breaks/% Fos + CTb cells |
||
|---|---|---|---|---|---|
| All cocaine seeking | CS + Reinst. only | Horizontal locomotion | Vertical locomotion | ||
| Extended amygdala | AA | 0.63** | 0.07 | −0.37 | 0.22 |
| DBNST | 0.46* | −0.11 | 0.57 | 0.65 | |
| VBNST | 0.74** | 0.58 | 0.60 | 0.65 | |
| IPAC | −0.03 | −0.28 | 0.03 | 0.45 | |
| MeA | 0.29 | 0.48 | 0.01 | 0.83* | |
| CeA | 0.44 | 0.37 | 0.61 | −0.58 | |
| SLEA | 0.36 | −0.57 | 0.45 | 0.73 | |
| Stia | 0.43 | 0.53 | 0.01 | 0.01 | |
| Accumbens core | Core | 0.51* | −0.08 | 0.19 | −0.18 |
| Accumbens shell | Rostral Pole | 0.08 | −0.44 | 0.01 | 0.29 |
| DM-Rostral | 0.28 | −0.50 | 0.44 | 0.29 | |
| VM-Rostral | 0.20 | 0.18 | 0.58 | −0.79 | |
| DM-Caudal | 0.42 | −0.41 | 0.40 | 0.30 | |
| VM-Caudal | 0.88*** | 0.80* | 0.63 | 0.41 | |
| Lateral | 0.77*** | 0.43 | 0.04 | −0.77 | |
| Pallidum | VP | 0.63** | 0.91 | 0.58 | 0.54 |
| Septum | LS | 0.57** | −0.22 | 0.42 | 0.68 |
| MS | 0.55** | 0.41 | 0.31 | 0.87* | |
| Cortex-like amygdala | BLA | −0.25 | −0.95** | −0.18 | 0.69 |
| BMA | 0.30 | −0.10 | −0.59 | 0.19 | |
| Prefrontal cortex | CG1 | −0.11 | −0.74* | 0.56 | 0.27 |
| CG2 | −0.23 | −0.09 | 0.20 | −0.48 | |
| PLC | 0.26 | 0.42 | 0.05 | 0.27 | |
| ILC | −0.25 | −0.42 | 0.64 | 0.05 | |
| DP | 0.45 | 0.43 | 0.46 | 0.30 | |
| DTT | 0.40 | 0.01 | 0.30 | 0.06 | |
| NavN | 0.44 | 0.18 | 0.25 | −0.26 | |
| MOFC | 0.11 | −0.19 | −0.35 | 0.90* | |
| DLOFC | −0.19 | −0.15 | 0.98** | 0.35 | |
| LOFC | 0.27 | 0.14 | −0.32 | 0.10 | |
| VOFC | 0.34 | 0.26 | −0.60 | 0.34 | |
| DEn | 0.45 | 0.05 | 0.78 | 0.11 | |
| Claust | −0.16 | −0.78* | 0.71 | 0.36 | |
| Hypothalamus | AH | 0.10 | −0.69 | −0.69 | 0.46 |
| PH | 0.28 | 0.32 | −0.41 | 0.23 | |
| LH | 0.74*** | 0.06 | 0.11 | 0.49 | |
| VMLH | 0.39 | 0.38 | −0.40 | 0.91* | |
| DMH | 0.38 | 0.59 | −0.16 | 0.90* | |
| VMH | 0.46 | 0.57 | 0.51 | −0.08 | |
| PFA | 0.49* | −0.14 | −0.40 | 0.59 | |
| LPO | 0.38 | −0.34 | 0.32 | 0.48 | |
| MPO | 0.47 | 0.00 | 0.00 | 0.65 | |
| PVH | 0.32 | −0.72 | 0.38 | 0.54 | |
| pmamm | 0.18 | 0.52 | 0.16 | 0.94* | |
| Habenula | MHb | −0.36 | −0.71 | 0.53 | −0.56 |
| LHb | −0.44 | 0.03 | 0.76 | 0.13 | |
| Raphe nucleus | Dorsal | −0.12 | −0.19 | −0.05 | 0.21 |
| Medial | −0.28 | 0.32 | −0.37 | −0.72 | |
| Paramedial | −0.01 | 0.10 | −0.16 | −0.16 | |
| Tegmentum | PPT-Rostral | 0.07 | −0.11 | 0.51 | −0.29 |
| PPT-Caudal | 0.20 | −0.42 | 0.39 | 0.54 | |
| RMTg/tVTA | −0.48* | 0.16 | 0.71 | −0.45 | |
| SC | −0.20 | −0.12 | 0.12 | 0.10 | |
Correlations of Fos in VTA afferent neurons with cocaine-seeking behavior, cued reinstatement behavior, horizontal locomotion, and vertical locomotion are shown. “All cocaine seeking” behavior is defined as active lever presses in the first 30 min of CS + reinstatement, CS− control, and extinction control sessions (n = 19). “CS + Reinstatement Only” (Reinst. Only) behavior is defined as cue-triggered reinstatement within the CS + reinstatement group alone (n = 8). Horizontal and vertical locomotion was measured in the locomotor control group (n = 6). Significant correlations are designated as *p < 0.05, **p < 0.01, ***p < 0.001.
Results
Quantification of intra-VTA CTb retrograde tracer injections
Only animals with over ∼85% of tracer injections contained within one unilateral VTA were included in analyses (n = 25; Fig. 1). Animals were classified as having CTb injections centered in rostral (rostral of the interpeduncular nucleus; n = 13) or caudal VTA (n = 12) by comparison of each injection with the Paxinos and Watson (2007) brain atlas. As shown in Figure 1, animals with rostral VTA placements had CTb injections centered at mean (m) ± SEM = 5.4 ± 0.03 mm behind bregma, with injections spreading at maximum to between −4.8 and −5.7 mm caudal of bregma. Caudal VTA animals had injections centered at m = 5.94 ± 0.06 mm caudal of bregma, spreading at maximum to between −5.6 and −6.4 mm caudal. The distribution of injection placements within VTA did not differ by behavioral group (no difference in rostral-caudal coordinate of injection centers among behavioral groups: F(3,21) = 0.4, n.s.). Included injections were nearly exclusively contained within rostral or caudal VTA, with rostral-caudal spread of individual tracer injections ranging from 0.2 to 0.8 mm (m = 0.5 ± 0.04 mm). The size of injections did not differ systematically between behavioral groups (extent of rostral-caudal spread: F(3,21) = 0.2, n.s.).
Cocaine self-administration and extinction training
Animals assigned to each group did not differ in terms of cocaine self-administration performance [no main effect of behavioral group in self-administration behavior (active lever presses): F(3,21) = 1.2, n.s., or interaction of group × training day: F(27,189) = 0.9, n.s.]. No differences in the total number of cocaine infusions self-administered by each experimental group were found (F(3,21) = 1.5, n.s.; CS+ group: m ± SEM = 347.8 ± 30.4, CS−: m = 329.5 ± 31.7, Extinction: m = 267.3 ± 21.1; Locomotor: m = 298.33 ± 36.9). By the end of self-administration training (day 10), animals received m = 39.9 ± 2.6 cocaine infusions/day (Fig. 2A). On the first day of extinction, active lever presses increased over self-administration levels (active lever: t24 = 3.4, p < 0.01), but pressing decreased dramatically over the next 6 d of extinction training (F(6,144) = 35.1, p < 0.001; Fig. 2A). No difference in the number of extinction days to criterion was found between experimental groups (no main effect of group: F(3,21) = 1.6, n.s.; or interaction of group by day: F(18,126) = 0.9, n.s.).
Figure 2.

Self-administration, extinction, cued reinstatement, and control behaviors. A, Active and inactive lever presses, and cocaine infusions are shown during the 10 days of self-administration, and first 7 d of extinction training. No differences in cocaine intake between groups were seen, so average data from all animals are displayed. B, Active lever (white and gray bars) and inactive lever (black bars) presses are shown on test days of extinction (n = 7), CS− (n = 4), and CS+ reinstatement animals (n = 8). Lever presses on the day of extinction training before tests are also shown for each group for comparison. *p < 0.05, increase in active lever presses from prior extinction day. C, Active lever pressing during the first and second 15 min of test day is shown for CS+ reinstatement, CS− control, and extinction control animals. **p < 0.01, ***p < 0.001, decrease in pressing from first 15 to second 15 min. D, Horizontal (black) and vertical locomotion (gray) during first and second 15 min is shown for the locomotor control group (n = 6). *p < 0.05, decrease from first 15 min in vertical locomotion; **p < 0.01, decrease from first 15 min in horizontal locomotion. Error bars indicate SEM.
Reinstatement and control behaviors
Animals in the CS+ reinstatement group pressed significantly more on the previously cocaine-delivering active lever (but not the inactive control lever) on test day than on prior extinction training days (cocaine lever: t7 = 5.2, p = 0.001; control lever:t7 = 0.1, n.s.; Fig. 2B). In contrast to CS+ animals, CS− and extinction control groups did not reinstate compared with prior extinction days (extinction: t6 = 0.6, n.s.; CS−: t3 = 0.2, n.s.), and pressed far less than the CS+ reinstatement group (F(2,16) = 13.3, p < 0.001; CS+ higher than extinction (p = 0.001) and CS− (p < 0.01) groups, extinction and CS− groups were equivalent; Fig. 2B). Inactive lever presses did not significantly change from prior extinction days in any group. Active lever pressing was highest in the first 30 min of CS+, extinction, and CS− test sessions, compared with the other three 30 min bins of each 2 h test (CS+: F(3,21) = 6.8, p < 0.01; Ext: F(3,18) = 9.4, p = 0.001; CS−: F(3,9) = 12.7, p = 0.001). Across the first 30 min of each test (which was the period primarily sampled by Fos staining), active lever pressing also decreased in each group (repeated-measures ANOVA on first 30 min in 5 min bins; CS+ group: F(5,30) = 3.9, p < 0.01; extinction group: F(5,30) = 6.4, p < 0.001; CS−: F(5,15) = 1.9, p = 0.15; Fig. 2C). Like for the cocaine seeking groups, activity in the locomotor control group was greatest in the first 30 min of the session (horizontal activity: F(3,15) = 68.8, p < 0.001; vertical activity: F(3,15) = 7.3, p < 0.01), and also declined over the course of this first 30 min (horizontal activity: F(5,25) = 4.3, p < 0.01; vertical activity: F(5,25) = 3.6, p < 0.05; Fig. 2D). Group sizes in the CS− and locomotor groups in particular were relatively small, so null Fos results for these groups should be interpreted with this in mind.
Patterns of VTA afferents
The average strengths of projections to rostral and caudal VTA are listed in Table 1, and generally replicate previous findings of the relative strengths of VTA afferents confirmed with anterograde tracer injections (Conrad and Pfaff, 1976; Herkenham and Nauta, 1979; Swanson and Cowan, 1979; Zahm, 1989; Heimer et al., 1991; Groenewegen et al., 1993; Zahm and Heimer, 1993; Carr and Sesack, 2000; Fadel and Deutch, 2002; Geisler and Zahm, 2005; Geisler et al., 2007; Omelchenko et al., 2009; Gonçalves et al., 2012). Most forebrain structures projected largely ipsilaterally to VTA, and some of the strongest of these projections are exemplified in Figures 3 and 4. These included: (1) ventral medial prefrontal cortex including infralimbic, dorsal peduncular, and dorsal tenia tecta cortical areas (Fig. 3A), (2) medial accumbens shell extending dorsally into lateral septum (Fig. 3B), (3) a basal forebrain band extending from preoptic hypothalamus laterally through ventral bed nucleus of the stria terminalis (BNST) into ventral pallidum (Fig. 3C) (and more caudally, into sublenticular extended amygdala; not depicted), (4) lateral habenula and dorsal aspects of the lateral hypothalamic area (Fig. 4A), and (5) periaqueductal gray, dorsal raphe, pedunculopontine tegmentum, and rostromedial tegmental nucleus/tail of the VTA (Fig. 4B). A high-magnification (60×) view of Fos, CTb and Fos + CTb staining from ventral pallidum is also depicted in Figure 3D.
Figure 3.
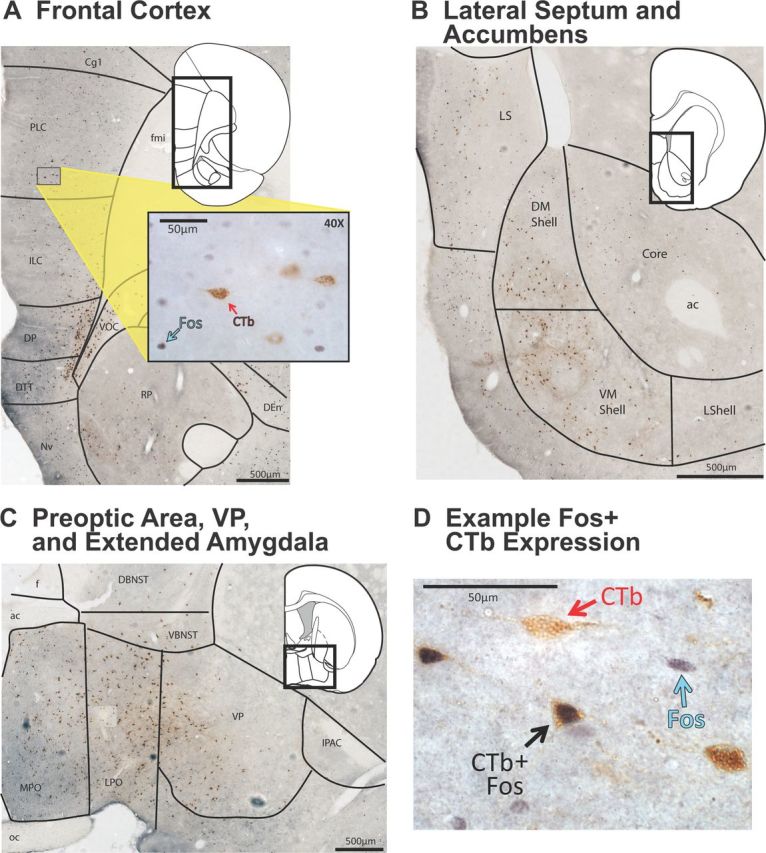
Pattern of major projections to VTA from telencephalon. Representative examples are shown of several regions in which significant numbers of VTA-projecting neurons were observed after VTA CTb injections. Background photographs were taken at 10× magnification and compiled into mosaics to show regional variations in CTb staining patterns (scale bars shown in each panel). Insets show corresponding atlas pages modified from Paxinos and Watson (2007), and higher-magnification photographs of CTb/Fos staining. A, Many CTb+ neurons were seen in ventral portions of medial prefrontal cortex. Inset shows a close up (40× magnification) of Fos+ and CTb+ neurons in ventral prelimbic cortex. B, Many CTb+ neurons were seen in medial accumbens shell and lateral septum. C, Many CTb+ neurons were seen in a band stretching from the preoptic area laterally into ventral BNST and into ventral pallidum. D, A 60× magnification photo of a Fos+ neuron (blue arrow), a CTb+ neuron (red arrow), and a CTb/Fos costained neuron (black arrow) are shown, taken from a section within ventral pallidum. Image was merged from a z-stack using ImageJ (NIH) software. ac, Anterior commissure; Core, nucleus accumbens core, DBNST, dorsal BNST, DEn, dorsal endopiriform cortex; DM Shell, dorsomedial nucleus accumbens shell; DP, dorsal peduncular cortex; DTT, dorsal tenia tecta; f, fornix; fmi, forceps minor of the corpus callosum; ILC, infralimbic cortex; LPO, lateral preoptic area; LShell, lateral nucleus accumbens shell; MPO, medial preoptic area; NvN, navicular nucleus; oc, optic chiasm; PLC, prelimbic cortex; RP, rostral pole of the nucleus accumbens; VBNST, ventral BNST; VM Shell, ventromedial nucleus accumbens shell; VOC, ventral orbitofrontal cortex.
Figure 4.

Pattern of major projections to VTA from diencephalon and mesencephalon. A, Many CTb+ neurons were seen in LHb (top; inset shows a close up at 60× magnification), and in dorsal hypothalamus (bottom). B, Many CTb+ neurons were seen in DR, tVTA, PAG, and PPT. Inset shows 20× magnification photo within tVTA. cp, cerebral peduncle; DR, dorsal raphe nucleus; f, fornix; MHb, medial habenula; PAG, periaqueductal gray; PPT, pedunculopontine nucleus; VMH, ventromedial hypothalamus; VMLH, ventromedial portion of the lateral hypothalamus. Scale bars are shown in each panel.
Afferents of rostral versus caudal VTA
Several structures showed statistically reliable differences in the intensity of projections to different regions of VTA, all with larger projections to rostral than caudal VTA (Table 1). These included dorsal (t23 = 2.7, p < 0.05) and ventral BNST (t23 = 2.5, p < 0.05), interstitial nucleus of the posterior limb of the anterior commissure (IPAC; t23 = 2.1, p < 0.05), central amygdala (CeA; t23 = 2.4, p < 0.05), and the caudo-ventral quadrant of the medial accumbens shell (ventral of the anterior commissure, and caudal of bregma+1.5 mm; t23 = 2.1, p < 0.05). Although ventral BNST and accumbens shell sites contained large numbers of neurons retrogradely labeled from VTA, dorsal BNST, IPAC, and CeA provided apparently relatively weaker projections, even to rostral VTA. Therefore, analyses of Fos-activation of projections to rostral vs caudal VTA were focused on ventral BNST and ventromedial accumbens shell.
Afferents from ventral striatopallidal and septal nuclei
Medial nucleus accumbens shell, lateral septum (LS), and ventral pallidum (VP) provide among the strongest inputs to VTA from the forebrain (Swanson and Cowan, 1979; Zahm, 1989; Heimer et al., 1991; Berendse et al., 1992; Groenewegen et al., 1993; Usuda et al., 1998; Geisler and Zahm, 2005; Table 1). Efferents from all of these structures were Fos-activated specifically in reinstatement animals (Fig. 5A).
Figure 5.

Striatopallidum and lateral septum efferents to VTA. A, VTA projecting neurons in lateral septum, medial accumbens shell, and ventral pallidum, as well as the relatively weak projection from lateral accumbens shell expressed more Fos in CS+ reinstatement animals than in any of the control groups. Reinstatement animals also displayed more Fos in the relatively weak accumbens core VTA afferent population than extinction or CS− control groups. B, Within medial accumbens shell, afferents to VTA from dorsal portions, as well as the caudal half of ventral shell, were Fos activated more in reinstatement (CS+) animals than in any control group. In contrast, rostral ventromedial shell showed no such specific Fos activation. *p < 0.05, **p < 0.01: CS+ vs all controls (Ext, CS− and Loco), significant differences from CS+ reinstatement group. +p < 0.05: CS+ vs Ext, CS− only; #p < 0.05: CS+ vs Ext, Loco only. RD, Rostral dorsomedial accumbens shell; CD, caudal dorsomedial accumbens shell; RV, rostral ventromedial accumbens shell; CV, caudal ventromedial accumbens shell. Error bars indicate SEM.
Relative to control animals, medial accumbens shell afferents to VTA were activated during reinstatement (F(3,24) = 8.8, p = 0.001). However, medial accumbens shell is a functionally and anatomically heterogeneous structure (Reynolds and Berridge, 2001, 2002, 2003; Peciña and Berridge, 2005; Thompson and Swanson, 2010; Gill and Grace, 2011; Richard and Berridge, 2011; Zahm et al., 2012), so we examined dorsal-ventral and rostral-caudal differences in Fos activation of its VTA projection neurons (Fig. 5B). CS+-specific activation of VTA afferents was observed throughout the rostrocaudal extent of dorsomedial shell (no interaction of behavioral group × rostral-caudal position: F(3,20) = 0.3, n.s.). However, only VTA projections from the caudal half of ventromedial shell (caudal of bregma + 1.5 mm) were Fos-activated in reinstatement animals (interaction of behavioral group by rostral-caudal position: F(3,20) = 7.6, p = 0.001), whereas afferents to VTA from the rostral ventromedial shell were equivalent across behavioral groups (Fig. 5B). In addition, VTA afferents in caudal ventromedial shell were activated in proportion to the degree of cocaine seeking across CS+, extinction and CS− groups (r = 0.88, p < 0.001), and even to reinstatement behavior within the CS+ reinstatement group alone; r = 0.8, p < 0.05; Table 2). Similar CS+-specific Fos activation of the ventral caudomedial shell was observed in neurons projecting both to rostral and caudal VTA (rostral VTA: F(3,12) = 8.9, p < 0.01; caudal VTA: F(3,11) = 4.0, p = 0.05), though the projection from the ventral caudomedial accumbens shell appeared to be stronger to rostral VTA than to caudal VTA (Table 1). Together, these findings point to a special role for the caudal, ventral quadrant of medial accumbens shell in providing reinstatement-related inputs to VTA. In contrast, the rostral half of ventromedial shell is unique within medial shell in that its moderate-to-strong VTA projection did not express Fos in relation to reinstatement behavior.
Neurons in lateral shell and core of nucleus accumbens that project to VTA were also specifically Fos-activated in reinstatement animals, but not in controls (lateral shell: F(3,24) = 23.0, p < 0.001; core: F(3,24) = 4.8, p = 0.01; Fig. 5A), and this Fos activation was correlated with cocaine seeking in both cases (lateral shell: r = 0.77, p < 0.001; core: r = 0.51, p < 0.05; Table 2). However, both accumbens lateral shell and core projections to VTA appeared to be relatively weak (Table 1). The similarly weakly VTA-projecting rostral pole of accumbens did not show behavior-related Fos activation of VTA projecting neurons (F(3,24) = 1.6, n.s.).
LS and VP also contained large numbers of retrogradely labeled neurons from VTA, many of which were specifically activated in reinstatement animals, but not in controls (LS: F(3,24) = 7.9, p = 0.001; VP: F(3,24) = 8.8, p = 0.001; Fig. 5A). Further, the degree of Fos activation of both LS and VP efferents labeled from VTA was also correlated with the degree of cocaine seeking across animals (LS: r = 0.57, p < 0.01; VP: r = 0.63, p < 0.01). Because anatomical and functional heterogeneity within LS has been reported (Swanson and Cowan, 1979; Risold and Swanson, 1997a,b; Luo et al., 2011; Sartor and Aston-Jones, 2012), we also examined Fos activation in VTA afferents from the rostral and caudal halves of LS (rostral or caudal of bregma + 0.75 mm), but found no significant differences in Fos activation in VTA afferents from these zones (no interaction of behavioral group × site within LS: F(3,21) = 1.2, n.s.). For medial septum (MS), although Fos activation of VTA projecting neurons was statistically equivalent between behavioral groups (F(3,20) = 1.6, n.s.), the degree of this Fos activation was significantly correlated with cocaine seeking (r = 0.55, p < 0.01).
Afferents from extended amygdala and basal amygdala
The strength of projections to VTA from amygdala and EA structures varied extensively between nuclei (Table 1). The strongest projections observed were from ventral BNST and sublenticular extended amygdala (SLEA), both of which varied in Fos activation between behavioral groups (ventral BNST: F(3,24) = 3.9, p < 0.05; SLEA: F(3,24) = 6.1, p < 0.01), as did dorsal BNST (F(3,24) = 4.3, p < 0.05; Fig. 6). In ventral and dorsal BNST, CS+ animals showed more Fos activation than any of the control groups (p values ≤0.05). Fos activation of projections from both dorsal and ventral BNST were also significantly correlated with cocaine seeking (dorsal BNST: r = 0.46, p < 0.05; ventral BNST: r = 0.74, p < 0.01). Though both dorsal and ventral BNST projected to a greater extent to rostral vs caudal VTA, we did not observe differences in behavior-related Fos activation of projections to these VTA subregions. In afferents from SLEA, Fos was also greater in CS+ animals than any control (p values <0.05; Fig. 6), but this activation was not significantly correlated with cocaine-seeking behavior.
Figure 6.

Extended amygdala and basal amygdala afferents to VTA. VTA-projecting neurons in dorsal and ventral BNST, SLEA, and AA expressed Fos in relation to behavior. BNST and SLEA projections expressed the most Fos in reinstatement animals, whereas AA efferents were activated in both reinstatement and locomotor control groups. No differences between behavioral groups were seen in IPAC, MeA (medial amygdala), CeA, or BLA. *p < 0.05, **p < 0.01: CS+ vs all controls (Ext, CS−, Loco); +p < 0.05, CS+ vs Ext, CS− only. Error bars indicate SEM.
For other EA structures with apparently weaker projections to VTA, only the anterior amygdaloid area (AA) showed variation in Fos activation of VTA projections related to behavior (F(3,23) = 8.0, p = 0.001), though CS+ animals only differed significantly from CS− (p = 0.002) and extinction (p = 0.005), not locomotor (p = 0.09) animals (Fig. 6). However, Fos activation in inputs from AA was correlated with cocaine seeking (r = 0.63, p < 0.01). In contrast, no difference in Fos activation was found in the relatively weak VTA projections from IPAC, CeA, medial amygdala, or the intra-amygdaloid stria terminalis (F values <2.3, n.s.; Fig. 6). Similarly, we observed only very infrequent CTb+ neurons in either basolateral (BLA) or basomedial amygdala, and Fos activation of these efferents did not differ between behavioral groups (Fig. 6; F values <1.5, n.s.; though intriguingly, Fos in the few BLA afferents to VTA was highly negatively correlated with cocaine seeking in the reinstatement group alone; r = −0.95, p < 0.01).
Afferents from frontal cortex
Frontal cortical structures varied in terms of the strength of their projections to VTA (Table 1), but Fos expression in these afferents was never related to cocaine seeking in particular (Fig. 7). In medial prefrontal cortex, the strongest VTA projections were seen in ventral areas including prelimbic cortex (PLC), infralimbic cortex (ILC), dorsal peduncular cortex (DP), dorsal tenia tecta (DTT), and to a lesser extent, navicular nucleus (NvN; Table 1, Figs. 3, 4). Fos expression in afferents from PLC, ILC, DP, and NvN was unrelated to behavioral group (F values <2.7, n.s.). In DTT, Fos expression was different among groups (F(3,24) = 5.4, p < 0.01), in that Fos activation of VTA projecting neurons was lowest in the CS− group, and this group was significantly different than the CS+ group [(p < 0.01), CS− vs other behavioral groups: p values >0.08]. Cingulate cortex (CG1 and 2) projections to VTA were sparse, and Fos expression in these neurons was equivalent between behavioral groups (CG1: F(3,24) = 1.6, n.s.; CG2: F(3,24) = 1.1, n.s.). Similarly, orbitofrontal projections to VTA did not show Fos activation in relation to behavior, including medial, dorsolateral, lateral, or ventral subregions (F values <0.9, n.s.). In the moderate projections to VTA from dorsal endopiriform nucleus (DEn) and claustrum (Claust), Fos expression was also unrelated to behavioral group (DEn: F(3,23) = 2.3, n.s.; Claust: F(3,23) = 0.5, n.s.). The degree of Fos expression in both CG1 and Claust was negatively correlated with cocaine-seeking behavior within the reinstatement group alone (CG1: r = −0.71, p < 0.05; Claust: r = −0.78, p < 0.05), though this finding must be interpreted with caution given the lack of differences between behavioral groups overall.
Figure 7.

Frontal cortical efferents to VTA. No frontal cortical area showed behavior-specific Fos expression in VTA projecting neurons, including cingulate cortex (Cg. Ctx.; average of areas 1 and 2), PLC, ILC, DEn, or claustrum. Error bars indicate SEM.
Afferents from hypothalamus
The lateral hypothalamus (LH) stood out as showing clear Fos activation in relation to cue-triggered cocaine seeking. LH (dorsal and lateral to the fornix), and the medially adjacent perifornical area (PFA, dorsal to the fornix) and dorsomedial hypothalamus (DMH, dorsal to the fornix), contained strong projections to VTA, as previously reported (Fadel and Deutch, 2002; Geisler and Zahm, 2005) (Table 1; Fig. 4A). In LH efferents, more Fos was observed in the CS+ group than in controls (F(3,24) = 19.9, p < 0.001, post hoc p values <0.001; Fig. 8A). This was not the case in DMH or PFA (F values <0.3, n.s.; Fig. 8A).
Figure 8.

Hypothalamic and lateral habenula afferents to VTA. Hypothalamus and lateral habenula showed behavior-related Fos activation of VTA projecting neurons. A, In LH, afferents to VTA expressed the most Fos in CS+ reinstatement animals. No significant differences between behavioral groups were seen in DMH or the PFA. B, In LHb, VTA afferents expressed more Fos in extinction control animals than CS+ reinstatement, or locomotor control animals (but not than CS− controls). No significant differences between behavioral groups were seen in medial (MPO) or lateral preoptic areas (LPO). **p < 0.01: CS+ vs all controls (Ext, CS−, Loco); @@p < 0.01, Ext vs CS+, Loco. Error bars indicate SEM.
The DMH, PFA, and LH contain neurons that produce orexin neuropeptides (de Lecea et al., 1998; Sakurai et al., 1998; Harris et al., 2005). Fos activation of orexin neurons is related to conditioned reward preference and seeking, and orexin is necessary for discrete and contextual cue-induced reinstatement of cocaine seeking, including orexin in VTA (Boutrel et al., 2005; Harris et al., 2005; Smith et al., 2009; Wang et al., 2009; Smith et al., 2010; Mahler et al., 2012a,b; Smith and Aston-Jones, 2012). Therefore, we sought to examine whether Fos activation of VTA projections from LH was in orexin neurons.
First, we examined Fos expression in the portion of LH where orexin neurons are prevalent (dorsal to and lateral to the fornix, from ∼2.5 to 3.5 mm caudal of bregma; de Lecea et al., 1998; Sakurai et al., 1998; Harris et al., 2005). We found that this orexin-containing region contained more numerous Fos+ neurons in reinstatement animals than more rostral or caudal aspects of LH (interaction of behavioral group and region of LH: F(6,42) = 3.2, p = 0.01; main effect of group, CS+ group different from controls in orexin field and rostral LH: p values <0.01; Fig. 9A).
Figure 9.
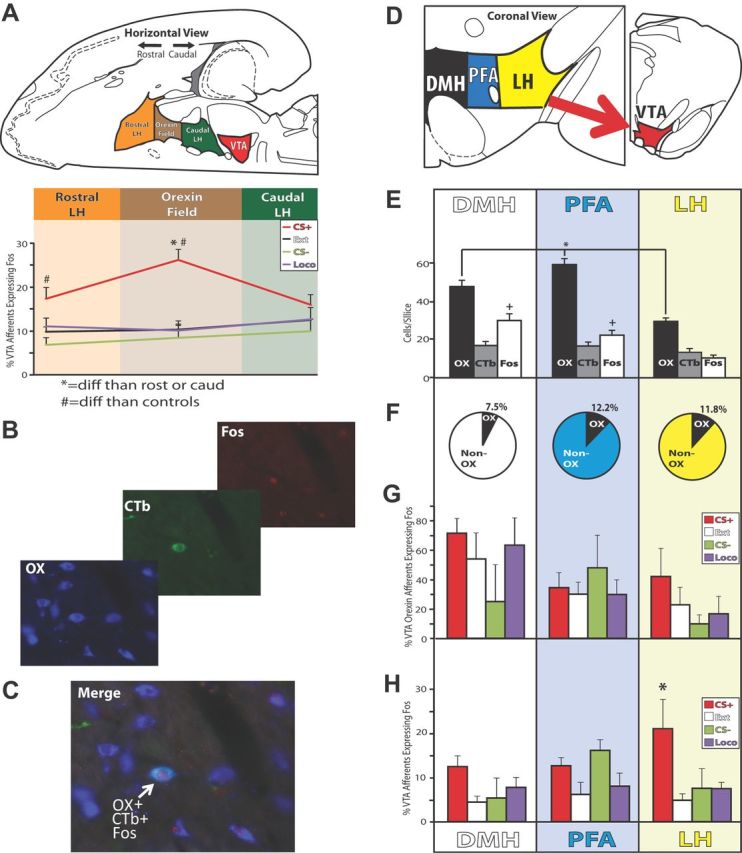
Non-orexin afferents to VTA from lateral hypothalamus activated during reinstatement. A, VTA projecting neurons in the orexin field of the LH (∼2.5–3.5 mm caudal of bregma) expressed more Fos in CS+ reinstatement animals than controls, and also more than efferents from more rostral or caudal portions of LH. *p < 0.05, CS+ reinstatement animals had a higher percentage of Fos+, VTA-projecting neurons in the orexin field compared with rostral or caudal portions of LH; #p < 0.05, CS+ reinstatement animals had a greater percentage of Fos+ VTA-projecting neurons than control groups. B, A representative example of triple immunohistochemistry from PFA is shown, with CTb in green, Fos in red, and orexin in blue. Contrast has been adjusted here for display purposes. C, A merged composite image of CTb, Fos and orexin staining from B is shown. The white arrow marks a triple-stained cell. D, Schematics of the location of DMH, PFA, and LH are shown within the hypothalamus, modified from Paxinos and Watson (2007). E, Average orexin (OX), CTb, and Fos cells/sampling area within DMH, PFA, and LH are shown. *p < 0.05, difference from PFA in the number of orexin cells observed; +p < 0.05, difference from LH in number of Fos cells observed (across behavioral groups). F, Percentage of CTb+ neurons within DHM, PFA, and LH that also stained for orexin. G, Percentage of VTA-projecting orexin neurons that were also Fos+ in CS+ reinstatement or control groups (F values <1.2, n.s.). H, Percentage of non-orexin VTA-projecting neurons that were also Fos+ in CS+ reinstatement or control groups. *p < 0.05: CS+ group vs control groups. Error bars indicate SEM.
Next, we triple stained for Fos, orexin, and CTb in tissue sections from the same animals with fluorescent immunohistochemistry, focusing on the center of the rostral-caudal extent of the hypothalamic orexin field (∼2.8 and 3.2 mm caudal of bregma; Fig. 8B,C). First, we individually quantified the average number of orexin-containing, CTb-containing, and Fos-containing cells for each animal (regardless of behavioral group) in each 0.325 mm2 field examined (20× magnification; Fig. 9E). There were more orexin+ cells in PFA than either DMH (p < 0.05) or LH (p < 0.001), and more orexin+ cells in DMH than LH (p < 0.001; overall ANOVA: F(2,66) = 27.7, p < 0.001). There were also more Fos+ cells (regardless of behavioral condition) in DMH or PFA than in LH (F(2,66) = 13.6, p < 0.001; DMH > LH: p < 0.001, PFA > LH: p < 0.01). No differences in the number of CTb+ cells in DMH, PFA, or LH were observed (F(2,66) = 0.9, n.s.).
Examination of the number of CTb+ cells that also expressed orexin revealed that between 7.5% and 12.2% of VTA-projecting neurons were orexinergic, depending upon the hypothalamic subregion (Fig. 9F; slightly lower than the 20% previously reported; Fadel and Deutch, 2002). In addition, we found no evidence of differential Fos activation in VTA-projecting orexin neurons during reinstatement or other behaviors (no effect of behavioral group on percentage of VTA-projecting orexin neurons that are Fos+: F values <1.2, n.s.; Fig. 9G). However, the total number of VTA-projecting orexin cells/sample/subregion was relatively low (DMH m ± SEM = 1.2 ± 0.2; PFA m = 1.8 ± 0.3; LH m = 1.5 ± 0.3), which makes it difficult to confidently analyze percentages of Fos+ cells within these populations. Therefore, we also examined effects of behavioral group on the absolute number of Fos+ VTA-projecting orexin cells/animal, and again found no significant effects (F values <2.5, n.s.). These findings indicate that VTA-projecting orexin cells were not Fos-activated during reinstatement or other behaviors in either lateral or medial orexin fields, unlike during expression of morphine conditioned place preference (Richardson and Aston-Jones, 2012).
In contrast, Fos activation was elevated in non-orexinergic VTA-projecting neurons in these same tissue sections (CTb+ cells that did not coexpress orexinA) in CS+ animals over control levels (F(3,22) = 3.3, p < 0.05; Fig. 9H). This result was similar to that for sections from the same brains stained only for CTb and Fos with a nonfluorescent DAB procedure (Fig. 8A). This indicates that reinstatement-related Fos activation of LH afferents to VTA is carried predominantly by non-orexin neurons. Although we did not characterize the phenotypes of these Fos-activated populations, potential candidates include melanocortin concentrating hormone- or glutamate-expressing neurons, both of which are involved in reward seeking and are present in this region of hypothalamus (Geisler et al., 2007; Chung et al., 2009; Nair et al., 2009; Stanley et al., 2011).
No behavior-related Fos activation was observed in most other hypothalamic regions that project moderately or strongly to VTA. This was true in the anterior or posterior hypothalamic nuclei, lateral preoptic area (LPO; Fig. 8B), paraventricular hypothalamic nucleus, and premammilary nucleus (F values <2.8, n.s.). The medial preoptic area, which projects strongly to VTA, did show Fos activation of efferents to VTA in relation to behavior (F(3,20) = 3.3, p < 0.05; Fig. 8B), though post hoc tests failed to show significant differences between individual behavior groups (p values >0.06). In ventromedial hypothalamus and the subfornical ventromedial portion of the lateral hypothalamus, which project weakly to VTA, Fos activation of VTA efferents was unrelated to behavioral group (F values <2.0, n.s.).
Afferents from the epithalamus
As previously reported, lateral (LHb), but not medial habenula, projected moderately to strongly to VTA (Herkenham and Nauta, 1979) (Table 1). We observed that LHb afferents to VTA were Fos activated in relation to behavioral group (F(3,24) = 5.7, p < 0.01), with extinction animals showing more Fos activation than CS+ or locomotor activity animals (p values <0.01), but equivalent Fos activation to CS− animals (Fig. 8B). In the few CTb+ neurons observed in medial habenula, Fos expression was unrelated to behavioral group (F(3,24) = 0.6, n.s.).
Afferents from midbrain
Several structures within the midbrain projected moderately to strongly to VTA, as previously reported (Conrad et al., 1974; Sugimoto and Hattori, 1984; Vertes, 1991; Cameron et al., 1995; Oakman et al., 1995; Charara et al., 1996; Gervais and Rouillard, 2000; Jhou et al., 2009a,b; Kaufling et al., 2010; Fig. 4B; Table 1). These included the dorsal raphe nucleus, the rostromedial tegmental nucleus/tail of the VTA (tVTA), and the caudal portion of the pedunculopontine tegmentum (PPT; caudal of bregma −7.5 mm). Of these, only the tVTA showed significant variation in Fos activation of VTA afferents with behavior (F(3,23) = 8.8, p = 0.001; Fig. 10), in that extinction animals showed greater Fos activation than CS+ or locomotor control animals (p values <0.01), but equivalent activation to CS− animals. The relatively weak projection to VTA from the median raphe nucleus to VTA was also Fos activated in relation to behavior, in that CS− animals showed greater Fos activation than locomotor animals (F(3,23) = 4.5, p = 0.01, CS− vs ext, p < 0.05; Fig. 10). No other midbrain structure examined [periaqueductal gray, rostral PPT (Fig. 10), paramedian raphe, or superior colliculus] showed behavior-related Fos activation in efferents to VTA (F values <2.5, n.s.).
Figure 10.

Midbrain afferents to VTA. Median raphe nucleus (MR) and tVTA showed behavior-related Fos activation in VTA-projecting neurons. In MR afferents of VTA, Fos was greater in CS− than locomotor control animals. In tVTA afferents of VTA, Fos was greater in extinction animals than in CS+ reinstatement animals, or locomotor controls. No behavior-related differences were seen for dorsal raphe (DR), periaqueductal gray (PAG), or pedunculopontine tegmentum (PPT). *p < 0.05: CS− vs Loco; @@p < 0.01, Ext vs indicated groups. Error bars indicate SEM.
Discussion
Here we identified VTA afferents from several structures that are Fos activated in relation to cue-induced reinstatement of cocaine seeking, and/or several other control behaviors. First, we characterized projections to rostral and caudal VTA from 56 nuclei and subnuclei throughout the forebrain and midbrain. Next, we examined Fos in these projections during cued reinstatement and other behaviors. Employing a conditioned reinforcement-based reinstatement procedure, we found numerous VTA afferents that were Fos activated during cued cocaine seeking within EA and striatopallidum (including a novel, functionally defined subregion of caudal ventromedial accumbens shell that showed particularly strong association with reinstatement behavior), LS, and non-orexin neurons in LH. Frontal cortical and other hypothalamic and tegmental afferents to VTA were not differentially activated. In contrast, LHb and tVTA VTA afferents expressed the most Fos when cocaine non-availability was signaled. These findings show that VTA afferents can be functionally dissociated by Fos expression during conditioned drug seeking, and identify several novel subcortical circuits underlying motivational effects of drug cues.
A major theme of this report is that projections to VTA can be defined not simply in terms of anatomical projection patterns, but also functionally in terms of their activation in a task known to involve VTA: cue-triggered reinstatement of cocaine seeking. While we replicated prior reports of VTA afferent regions (Phillipson, 1979; Geisler and Zahm, 2005), and extended these findings by examining projections to rostral vs caudal VTA, we noted that cocaine seeking-related Fos was apparent only in a subset of these nuclei (Fig. 11). In this manner, we identified a functional subcortical network of VTA inputs from within larger, anatomically defined macrosystems which likely drives VTA firing in response to cues, eliciting cocaine-seeking behavior.
Figure 11.

Summary of behavior-related Fos activation of VTA afferents. A summary of the VTA inputs that were Fos activated during cue-induced reinstatement and other behaviors are diagrammed in the horizontal plane (modified from Paxinos and Watson, 2007), with afferents lying ventrally in the brain shown at left (plane shown ∼7.8 mm ventral of bregma), and dorsal structures shown at right (plane shown ∼4.6 mm ventral of bregma). Structures labeled in red provided relatively dense inputs to VTA that expressed more Fos in cue-induced reinstatement animals than any of the control groups. Pink structures provided relatively sparse afferents that were activated most in reinstatement animals. Dark blue structures provided relatively dense VTA afferents, and that expressed more Fos in animals in which cocaine was not expected (extinction and CS− groups) than in other groups. AA (light yellow) provided a relatively sparse input to VTA that was Fos-activated in reinstatement and locomotor control animals, indicating possible involvement in behaviorally activating situations, but not cocaine-seeking in particular. Gray structures provided inputs to VTA (dark gray, relatively dense inputs; light gray, relatively sparse inputs) that did not express Fos preferentially in any behavioral condition. VTA is colored in purple. AH, Anterior hypothalamus; Caudal LH, LH caudal of bregma −3.5 mm; Caudal VM Shell, ventromedial nucleus accumbens shell caudal of bregma +1.5 mm; Core, nucleus accumbens core; CPu, caudate–putamen; DEn, dorsal endopiriform nucleus; DM Shell, dorsomedial accumbens shell; Lat Shell, lateral nucleus accumbens shell; LPO, lateral preoptic area; MeA, medial amygdala; MS, medial septum; MPO, medial preoptic area; MR, medial raphe nucleus; OFC, orbitofrontal cortex; PAG/DR, periaqueductal gray/dorsal raphe nucleus; PH, posterior hypothalamus; PLC, prelimbic cortex; PPT, pedunculopontine nucleus; Rostral LH, LH rostral of bregma −2.5 mm; Rostral VM Shell, ventromedial nucleus accumbens shell rostral of bregma +1.5 mm; SN, substantia nigra; Stia, intra-amygdaloid stria terminalis. White matter tracts are labeled in italics: opt, optic tract; ac, anterior commissure; f, fornix; ic, internal capsule; ec, external capsule; st, stria terminalis.
Within the ventral striatopallidal system, medial accumbens shell and ventral pallidum stood out as providing strong projections to VTA that expressed the most Fos during cue-induced reinstatement. Medial accumbens shell is probably best known for its reward-related role as a target of VTA dopamine, but also sends a major GABAergic, opioid-containing projection back to VTA GABA neurons (Nauta et al., 1978; Heimer et al., 1991; Kalivas et al., 1993; Xia et al., 2011). We found that VTA afferents from dorsomedial shell and the caudal half of ventromedial shell likely modulate VTA's role in conditioned cocaine seeking. VTA afferents from caudal ventromedial shell were not only activated most in reinstatement animals, but this activation was correlated with cocaine-seeking behavior across groups, as well as within the cued reinstatement group. In contrast, the rostral ventromedial quadrant is the only part of accumbens shell where VTA projections were not activated during reinstatement. Rostral-caudal and dorsal-ventral functional gradients have been reported within medial shell (Reynolds and Berridge, 2001, 2002, 2003; Peciña and Berridge, 2005; Britt and McGehee, 2008; Thompson and Swanson, 2010; Zahm et al., 2012), but to our knowledge, this is the first report of a functional dissociation between rostral vs caudal portions of the ventral half of the medial shell in reward-seeking.
We also found that VP projections to VTA expressed more Fos during cue-induced cocaine seeking than in any control. VP is necessary for stress and cocaine-primed reinstatement, and is activated by reward cues in rats and humans (McFarland et al., 2004; Tang et al., 2005; Childress et al., 2008; Tindell et al., 2009; Kühn and Gallinat, 2011; Smith et al., 2011). VP projections to VTA are GABAergic and glutamatergic (Kalivas et al., 1993; Geisler et al., 2007), and are Fos activated by psychostimulants (Colussi-Mas et al., 2007; Geisler et al., 2008). Here, we show that VP projections to VTA are also recruited during cue-induced reinstatement, in the absence of cocaine itself.
LS also projects strongly to VTA, and showed cocaine seeking-related Fos expression. LS has received a resurgence of interest for its role in reward, long after early reports that it is a key node for electrical brain stimulation reward in rats and humans (Olds and Milner, 1954; Heath, 1996). LS also serves as a critical relay between hippocampus and VTA for context-driven cocaine seeking, and sends a GABAergic input to VTA that disinhibits dopamine neurons (Luo et al., 2011). However, it is not clear whether this particular hippocampal-septal-VTA pathway was recruited during discrete cue-induced cocaine seeking here.
The EA refers to a collection of basal forebrain nuclei with substantial homology in histological features and connectivity patterns (de Olmos, 1969, 1972; Alheid and Heimer, 1988). Two EA structures stood out as being particularly likely to modulate cue-related VTA activity: BNST and the SLEA. Efferents from both structures were relatively strong, and they expressed Fos most often during cued cocaine seeking. BNST is necessary for cue- and stress-induced reinstatement of drug seeking, and provides reward-related GABAergic and glutamatergic inputs to VTA (Sun and Cassell, 1993; Erb and Stewart, 1999; Georges and Aston-Jones, 2001, 2002; McFarland et al., 2004; Briand et al., 2010; Buffalari and See, 2011). Little was previously known about the functions of SLEA, except that it receives a projection from accumbens shell, is necessary for cocaine-self-administration, and appears to be a transition zone between central amygdala and BNST (Robledo and Koob, 1993; Shammah-Lagnado et al., 1999; Alheid, 2003).
Other EA structures sent relatively weak projections to VTA, and the anterior AA was the only of these where VTA projections were Fos activated both in reinstatement and in locomotor control animals. This pattern could indicate a role for AA efferents in arousal processes. AA contains GABA and preproenkephalin neurons, and is unique among EA structures in having acetylcholine neurons (Gastard et al., 2002; Loopuijt and Zahm, 2006; Poulin et al., 2008; Schmitt et al., 2012). To our knowledge, this is the first report of a behavioral function associated with this structure.
The dorsal hypothalamus has long been known to be involved in reward seeking (Olds, 1958; Coons et al., 1965), and contains a large orexin projection to VTA that is necessary for cue-induced reinstatement of cocaine seeking (Fadel and Deutch, 2002; James et al., 2011; Mahler et al., 2012b). Although VTA afferents from LH (especially in the region populated by orexin neurons) were recruited during reinstatement, these neurons were largely not orexinergic. In contrast, LH orexin projections to VTA are Fos activated during conditioned place preference (CPP) for morphine (Richardson and Aston-Jones, 2012), and LH orexin neurons in general are Fos activated during expression of morphine, cocaine or food CPP (Harris et al., 2005; Sartor and Aston-Jones, 2012). Moreover, orexin-1 receptors in VTA are required for cue-induced reinstatement of cocaine seeking in both conditioned reinforcer and discriminative stimulus-induced reinstatement procedures (James et al., 2011; Mahler et al., 2012b). It is therefore possible that either VTA-projecting orexin neurons were not sufficiently activated by transient, discrete cues to increase Fos over control levels, or that the orexin activity present in all groups was permissive of reinstatement, given coincident activity of other cue-related VTA inputs such as glutamate (Mahler et al., 2012a). In either case, a clear difference in recruitment of VTA orexin inputs during discrete cue-induced reinstatement and CPP tasks is apparent, and requires future study.
Intriguingly, we found that VTA afferents from both LHb and tVTA expressed Fos most during behavioral conditions in which the unavailability of cocaine was signaled. LHb projections to the ventral midbrain are primarily glutamatergic (Omelchenko et al., 2009; Brinschwitz et al., 2010), inhibit VTA dopamine neurons via GABA neuronal relays in tVTA and VTA, and are associated with aversive events (Christoph et al., 1986; Matsumoto and Hikosaka, 2007; Balcita-Pedicino et al., 2011; Hong et al., 2011). Here, LHb and tVTA projections to VTA were recruited when cocaine was not expected (though this situation is not necessarily aversive), indicating a potential role for LHb and tVTA inputs to VTA in suppressing cocaine seeking.
Medial prefrontal cortical (PFC) projections to VTA can modulate reward-seeking behavior via top-down control of dopamine neuron firing (Overton et al., 1996; Tong et al., 1996; Phillips et al., 2008; Moorman and Aston-Jones, 2010), and provide ∼30% of the total glutamate inputs to VTA (Geisler et al., 2007). Here, we found no evidence for reinstatement-related Fos in VTA afferents from any cortical area examined. As dorsomedial PFC neurons are activated during, and are necessary for cue-induced reinstatement behavior (Kalivas and McFarland, 2003; Zavala et al., 2008; Kufahl et al., 2009), presumably PFC projections to other structures (e.g., accumbens) instead mediate cue-triggered cocaine seeking.
These findings describe a specific set of inputs to VTA that are recruited during cue-triggered reinstatement of cocaine seeking, likely helping control cue-associated VTA dopamine neuron firing thought to promote reward seeking. These results point to VTA as a node of convergence for motivationally relevant information from striatopallidum, EA, LS, LH, LHb, and tVTA. Understanding the functional roles of these VTA afferents will likely be important for dissecting the brain systems underlying the ability of drug cues to promote relapse in human addiction.
Footnotes
These studies were funded by NIDA Grants P50 DA015369, R37 DA 006214, and F32 DA026692. We thank Phong Do for assistance with behavioral testing, and Hampton Andrews for assistance with immunohistochemistry.
The authors declare no competing financial interests.
References
- Alheid GF. Extended amygdala and basal forebrain. Ann N Y Acad Sci. 2003;985:185–205. doi: 10.1111/j.1749-6632.2003.tb07082.x. CrossRef Medline. [DOI] [PubMed] [Google Scholar]
- Alheid GF, Heimer L. New perspectives in basal forebrain organization of special relevance for neuropsychiatric disorders: the striatopallidal, amygdaloid, and corticopetal components of substantia innominata. Neuroscience. 1988;27:1–39. doi: 10.1016/0306-4522(88)90217-5. CrossRef Medline. [DOI] [PubMed] [Google Scholar]
- Balcita-Pedicino JJ, Omelchenko N, Bell R, Sesack SR. The inhibitory influence of the lateral habenula on midbrain dopamine cells: ultrastructural evidence for indirect mediation via the rostromedial mesopontine tegmental nucleus. J Comp Neurol. 2011;519:1143–1164. doi: 10.1002/cne.22561. CrossRef Medline. [DOI] [PMC free article] [PubMed] [Google Scholar]
- Bechtholt AJ, Cunningham CL. Ethanol-induced conditioned place preference is expressed through a ventral tegmental area dependent mechanism. Behav Neurosci. 2005;119:213–223. doi: 10.1037/0735-7044.119.1.213. CrossRef Medline. [DOI] [PubMed] [Google Scholar]
- Berendse HW, Groenewegen HJ, Lohman AH. Compartmental distribution of ventral striatal neurons projecting to the mesencephalon in the rat. J Neurosci. 1992;12:2079–2103. doi: 10.1523/JNEUROSCI.12-06-02079.1992. Medline. [DOI] [PMC free article] [PubMed] [Google Scholar]
- Berridge KC. The debate over dopamine's role in reward: the case for incentive salience. Psychopharmacology. 2007;191:391–431. doi: 10.1007/s00213-006-0578-x. CrossRef Medline. [DOI] [PubMed] [Google Scholar]
- Boutrel B, Kenny PJ, Specio SE, Martin-Fardon R, Markou A, Koob GF, de Lecea L. Role for hypocretin in mediating stress-induced reinstatement of cocaine-seeking behavior. Proc Natl Acad Sci U S A. 2005;102:19168–19173. doi: 10.1073/pnas.0507480102. CrossRef Medline. [DOI] [PMC free article] [PubMed] [Google Scholar]
- Briand LA, Vassoler FM, Pierce RC, Valentino RJ, Blendy JA. Ventral tegmental afferents in stress-induced reinstatement: the role of cAMP response element-binding protein. J Neurosci. 2010;30:16149–16159. doi: 10.1523/JNEUROSCI.2827-10.2010. CrossRef Medline. [DOI] [PMC free article] [PubMed] [Google Scholar]
- Brinschwitz K, Dittgen A, Madai VI, Lommel R, Geisler S, Veh RW. Glutamatergic axons from the lateral habenula mainly terminate on GABAergic neurons of the ventral midbrain. Neuroscience. 2010;168:463–476. doi: 10.1016/j.neuroscience.2010.03.050. CrossRef Medline. [DOI] [PubMed] [Google Scholar]
- Britt JP, McGehee DS. Presynaptic opioid and nicotinic receptor modulation of dopamine overflow in the nucleus accumbens. J Neurosci. 2008;28:1672–1681. doi: 10.1523/JNEUROSCI.4275-07.2008. CrossRef Medline. [DOI] [PMC free article] [PubMed] [Google Scholar]
- Buffalari DM, See RE. Inactivation of the bed nucleus of the stria terminalis in an animal model of relapse: effects on conditioned cue-induced reinstatement and its enhancement by yohimbine. Psychopharmacology (Berl) 2011;213:19–27. doi: 10.1007/s00213-010-2008-3. CrossRef Medline. [DOI] [PMC free article] [PubMed] [Google Scholar]
- Cameron AA, Khan IA, Westlund KN, Cliffer KD, Willis WD. The efferent projections of the periaqueductal gray in the rat: a Phaseolus vulgaris-leucoagglutinin study. I. Ascending projections. J Comp Neurol. 1995;351:568–584. doi: 10.1002/cne.903510407. CrossRef Medline. [DOI] [PubMed] [Google Scholar]
- Carlezon WA, Jr, Haile CN, Coppersmith R, Hayashi Y, Malinow R, Neve RL, Nestler EJ. Distinct sites of opiate reward and aversion within the midbrain identified using a herpes simplex virus vector expressing GluR1. J Neurosci. 2000;20:RC62. doi: 10.1523/JNEUROSCI.20-05-j0002.2000. (1–5) Medline. [DOI] [PMC free article] [PubMed] [Google Scholar]
- Carr DB, Sesack SR. Projections from the rat prefrontal cortex to the ventral tegmental area: target specificity in the synaptic associations with mesoaccumbens and mesocortical neurons. J Neurosci. 2000;20:3864–3873. doi: 10.1523/JNEUROSCI.20-10-03864.2000. Medline. [DOI] [PMC free article] [PubMed] [Google Scholar]
- Charara A, Smith Y, Parent A. Glutamatergic inputs from the pedunculopontine nucleus to midbrain dopaminergic neurons in primates: Phaseolus vulgaris-leucoagglutinin anterograde labeling combined with postembedding glutamate and GABA immunohistochemistry. J Comp Neurol. 1996;364:254–266. doi: 10.1002/(SICI)1096-9861(19960108)364:2<254::AID-CNE5>3.0.CO;2-4. Medline. [DOI] [PubMed] [Google Scholar]
- Childress AR, Ehrman RN, Wang Z, Li Y, Sciortino N, Hakun J, Jens W, Suh J, Listerud J, Marquez K, Franklin T, Langleben D, Detre J, O'Brien CP. Prelude to passion: limbic activation by “unseen” drug and sexual cues. PLoS One. 2008;3:e1506. doi: 10.1371/journal.pone.0001506. CrossRef Medline. [DOI] [PMC free article] [PubMed] [Google Scholar]
- Christoph GR, Leonzio RJ, Wilcox KS. Stimulation of the lateral habenula inhibits dopamine-containing neurons in the substantia nigra and ventral tegmental area of the rat. J Neurosci. 1986;6:613–619. doi: 10.1523/JNEUROSCI.06-03-00613.1986. Medline. [DOI] [PMC free article] [PubMed] [Google Scholar]
- Chung S, Hopf FW, Nagasaki H, Li CY, Belluzzi JD, Bonci A, Civelli O. The melanin-concentrating hormone system modulates cocaine reward. Proc Natl Acad Sci U S A. 2009;106:6772–6777. doi: 10.1073/pnas.0811331106. CrossRef Medline. [DOI] [PMC free article] [PubMed] [Google Scholar]
- Colussi-Mas J, Geisler S, Zimmer L, Zahm DS, Bérod A. Activation of afferents to the ventral tegmental area in response to acute amphetamine: a double-labelling study. Eur J Neurosci. 2007;26:1011–1025. doi: 10.1111/j.1460-9568.2007.05738.x. CrossRef Medline. [DOI] [PMC free article] [PubMed] [Google Scholar]
- Conrad LC, Pfaff DW. Efferents from medial basal forebrain and hypothalamus in the rat. I. An autoradiographic study of the medial preoptic area. J Comp Neurol. 1976;169:185–219. doi: 10.1002/cne.901690205. Medline. [DOI] [PubMed] [Google Scholar]
- Conrad LC, Leonard CM, Pfaff DW. Connections of the median and dorsal raphe nuclei in the rat: an autoradiographic and degeneration study. J Comp Neurol. 1974;156:179–205. doi: 10.1002/cne.901560205. CrossRef Medline. [DOI] [PubMed] [Google Scholar]
- Coons EE, Levak M, Miller NE. Lateral hypothalamus: learning of food-seeking response motivated by electrical stimulation. Science. 1965;150:1320–1321. doi: 10.1126/science.150.3701.1320. CrossRef Medline. [DOI] [PubMed] [Google Scholar]
- Corbit LH, Janak PH, Balleine BW. General and outcome-specific forms of Pavlovian-instrumental transfer: the effect of shifts in motivational state and inactivation of the ventral tegmental area. Eur J Neurosci. 2007;26:3141–3149. doi: 10.1111/j.1460-9568.2007.05934.x. CrossRef Medline. [DOI] [PubMed] [Google Scholar]
- de Olmos JS. A cupric-silver method for impregnation of terminal axon degeneration and its further use in staining granular argyrophilic neurons. Brain Behav Evol. 1969;2:213–237. doi: 10.1159/000125825. [DOI] [Google Scholar]
- de Olmos JS. The amygdaloid projection field in the rat as studied with the cupric silver method. In: Eleftheriou BE, editor. The neurobiology of the amygdala. New York: Plenum; 1972. pp. 145–204. [Google Scholar]
- de Lecea L, Kilduff TS, Peyron C, Gao X, Foye PE, Danielson PE, Fukuhara C, Battenberg EL, Gautvik VT, Bartlett FS, 2nd, Frankel WN, van den Pol AN, Bloom FE, Gautvik KM, Sutcliffe JG. The hypocretins: hypothalamus-specific peptides with neuroexcitatory activity. Proc Natl Acad Sci U S A. 1998;95:322–327. doi: 10.1073/pnas.95.1.322. CrossRef Medline. [DOI] [PMC free article] [PubMed] [Google Scholar]
- Erb S, Stewart J. A role for the bed nucleus of the stria terminalis, but not the amygdala, in the effects of corticotropin-releasing factor on stress-induced reinstatement of cocaine seeking. J Neurosci. 1999;19:RC35. doi: 10.1523/JNEUROSCI.19-20-j0006.1999. Medline. [DOI] [PMC free article] [PubMed] [Google Scholar]
- Fadel J, Deutch AY. Anatomical substrates of orexin-dopamine interactions: lateral hypothalamic projections to the ventral tegmental area. Neuroscience. 2002;111:379–387. doi: 10.1016/s0306-4522(02)00017-9. CrossRef Medline. [DOI] [PubMed] [Google Scholar]
- Fanous S, Lacagnina MJ, Nikulina EM, Hammer RP., Jr Sensitized activation of Fos and brain-derived neurotrophic factor in the medial prefrontal cortex and ventral tegmental area accompanies behavioral sensitization to amphetamine. Neuropharmacology. 2011;61:558–564. doi: 10.1016/j.neuropharm.2011.04.026. CrossRef Medline. [DOI] [PMC free article] [PubMed] [Google Scholar]
- Gastard M, Jensen SL, Martin JR, 3rd, Williams EA, Zahm DS. The caudal sublenticular region/anterior amygdaloid area is the only part of the rat forebrain and mesopontine tegmentum occupied by magnocellular cholinergic neurons that receives outputs from the central division of extended amygdala. Brain Res. 2002;957:207–222. doi: 10.1016/s0006-8993(02)03513-8. CrossRef Medline. [DOI] [PubMed] [Google Scholar]
- Geisler S, Zahm DS. Afferents of the ventral tegmental area in the rat-anatomical substratum for integrative functions. J Comp Neurol. 2005;490:270–294. doi: 10.1002/cne.20668. CrossRef Medline. [DOI] [PubMed] [Google Scholar]
- Geisler S, Derst C, Veh RW, Zahm DS. Glutamatergic afferents of the ventral tegmental area in the rat. J Neurosci. 2007;27:5730–5743. doi: 10.1523/JNEUROSCI.0012-07.2007. CrossRef Medline. [DOI] [PMC free article] [PubMed] [Google Scholar]
- Geisler S, Marinelli M, Degarmo B, Becker ML, Freiman AJ, Beales M, Meredith GE, Zahm DS. Prominent activation of brainstem and pallidal afferents of the ventral tegmental area by cocaine. Neuropsychopharmacology. 2008;33:2688–2700. doi: 10.1038/sj.npp.1301650. CrossRef Medline. [DOI] [PMC free article] [PubMed] [Google Scholar]
- Georges F, Aston-Jones G. Potent regulation of midbrain dopamine neurons by the bed nucleus of the stria terminalis. J Neurosci. 2001;21:RC160. doi: 10.1523/JNEUROSCI.21-16-j0003.2001. Medline. [DOI] [PMC free article] [PubMed] [Google Scholar]
- Georges F, Aston-Jones G. Activation of ventral tegmental area cells by the bed nucleus of the stria terminalis: a novel excitatory amino acid input to midbrain dopamine neurons. J Neurosci. 2002;22:5173–5187. doi: 10.1523/JNEUROSCI.22-12-05173.2002. Medline. [DOI] [PMC free article] [PubMed] [Google Scholar]
- Gervais J, Rouillard C. Dorsal raphe stimulation differentially modulates dopaminergic neurons in the ventral tegmental area and substantia nigra. Synapse. 2000;35:281–291. doi: 10.1002/(SICI)1098-2396(20000315)35:4<281::AID-SYN6>3.0.CO;2-A. Medline. [DOI] [PubMed] [Google Scholar]
- Gill KM, Grace AA. Heterogeneous processing of amygdala and hippocampal inputs in the rostral and caudal subregions of the nucleus accumbens. Int J Neuropsychopharmacol. 2011;14:1301–1314. doi: 10.1017/S1461145710001586. CrossRef Medline. [DOI] [PMC free article] [PubMed] [Google Scholar]
- Gonçalves L, Sego C, Metzger M. Differential projections from the lateral habenula to the rostromedial tegmental nucleus and ventral tegmental area in the rat. J Comp Neurol. 2012;520:1278–1300. doi: 10.1002/cne.22787. CrossRef Medline. [DOI] [PubMed] [Google Scholar]
- Groenewegen HJ, Berendse HW, Haber SN. Organization of the output of the ventral striatopallidal system in the rat: ventral pallidal efferents. Neuroscience. 1993;57:113–142. doi: 10.1016/0306-4522(93)90115-v. CrossRef Medline. [DOI] [PubMed] [Google Scholar]
- Harris GC, Wimmer M, Aston-Jones G. A role for lateral hypothalamic orexin neurons in reward seeking. Nature. 2005;437:556–559. doi: 10.1038/nature04071. CrossRef Medline. [DOI] [PubMed] [Google Scholar]
- Heath RG. Exploring the mind-brain relationship. Baton Rouge, LA: Moran Printing, Inc; 1996. [Google Scholar]
- Heimer L, Zahm DS, Churchill L, Kalivas PW, Wohltmann C. Specificity in the projection patterns of accumbal core and shell in the rat. Neuroscience. 1991;41:89–125. doi: 10.1016/0306-4522(91)90202-y. CrossRef Medline. [DOI] [PubMed] [Google Scholar]
- Herkenham M, Nauta WJ. Efferent connections of the habenular nuclei in the rat. J Comp Neurol. 1979;187:19–47. doi: 10.1002/cne.901870103. CrossRef Medline. [DOI] [PubMed] [Google Scholar]
- Hong S, Jhou TC, Smith M, Saleem KS, Hikosaka O. Negative reward signals from the lateral habenula to dopamine neurons are mediated by rostromedial tegmental nucleus in primates. J Neurosci. 2011;31:11457–11471. doi: 10.1523/JNEUROSCI.1384-11.2011. CrossRef Medline. [DOI] [PMC free article] [PubMed] [Google Scholar]
- Ikemoto S. Dopamine reward circuitry: two projection systems from the ventral midbrain to the nucleus accumbens-olfactory tubercle complex. Brain Res Rev. 2007;56:27–78. doi: 10.1016/j.brainresrev.2007.05.004. CrossRef Medline. [DOI] [PMC free article] [PubMed] [Google Scholar]
- Ikemoto S, Panksepp J. The role of nucleus accumbens dopamine in motivated behavior: a unifying interpretation with special reference to reward-seeking. Brain Res Brain Res Rev. 1999;31:6–41. doi: 10.1016/s0165-0173(99)00023-5. Medline. [DOI] [PubMed] [Google Scholar]
- Ikemoto S, Murphy JM, McBride WJ. Self-infusion of GABA(A) antagonists directly into the ventral tegmental area and adjacent regions. Behav Neurosci. 1997;111:369–380. doi: 10.1037//0735-7044.111.2.369. CrossRef Medline. [DOI] [PubMed] [Google Scholar]
- Ito R, Dalley JW, Howes SR, Robbins TW, Everitt BJ. Dissociation in conditioned dopamine release in the nucleus accumbens core and shell in response to cocaine cues and during cocaine-seeking behavior in rats. J Neurosci. 2000;20:7489–7495. doi: 10.1523/JNEUROSCI.20-19-07489.2000. Medline. [DOI] [PMC free article] [PubMed] [Google Scholar]
- James MH, Charnley JL, Levi EM, Jones E, Yeoh JW, Smith DW, Dayas CV. Orexin-1 receptor signalling within the ventral tegmental area, but not the paraventricular thalamus, is critical to regulating cue-induced reinstatement of cocaine-seeking. Int J Neuropsychopharmacol. 2011;14:684–690. doi: 10.1017/S1461145711000423. CrossRef Medline. [DOI] [PubMed] [Google Scholar]
- Jhou TC, Geisler S, Marinelli M, Degarmo BA, Zahm DS. The mesopontine rostromedial tegmental nucleus: A structure targeted by the lateral habenula that projects to the ventral tegmental area of Tsai and substantia nigra compacta. J Comp Neurol. 2009a;513:566–596. doi: 10.1002/cne.21891. CrossRef Medline. [DOI] [PMC free article] [PubMed] [Google Scholar]
- Jhou TC, Fields HL, Baxter MG, Saper CB, Holland PC. The rostromedial tegmental nucleus (RMTg), a GABAergic afferent to midbrain dopamine neurons, encodes aversive stimuli and inhibits motor responses. Neuron. 2009b;61:786–800. doi: 10.1016/j.neuron.2009.02.001. CrossRef Medline. [DOI] [PMC free article] [PubMed] [Google Scholar]
- Johnson K, Churchill L, Klitenick MA, Hooks MS, Kalivas PW. Involvement of the ventral tegmental area in locomotion elicited from the nucleus accumbens or ventral pallidum. J Pharmacol Exp Ther. 1996;277:1122–1131. Medline. [PubMed] [Google Scholar]
- Johnson SW, North RA. Two types of neurone in the rat ventral tegmental area and their synaptic inputs. J Physiol. 1992;450:455–468. doi: 10.1113/jphysiol.1992.sp019136. Medline. [DOI] [PMC free article] [PubMed] [Google Scholar]
- Kalivas PW, McFarland K. Brain circuitry and the reinstatement of cocaine-seeking behavior. Psychopharmacology (Berl) 2003;168:44–56. doi: 10.1007/s00213-003-1393-2. CrossRef Medline. [DOI] [PubMed] [Google Scholar]
- Kalivas PW, Churchill L, Klitenick MA. GABA and enkephalin projection from the nucleus accumbens and ventral pallidum to the ventral tegmental area. Neuroscience. 1993;57:1047–1060. doi: 10.1016/0306-4522(93)90048-k. CrossRef Medline. [DOI] [PubMed] [Google Scholar]
- Kaufling J, Veinante P, Pawlowski SA, Freund-Mercier MJ, Barrot M. gamma-Aminobutyric acid cells with cocaine-induced DeltaFosB in the ventral tegmental area innervate mesolimbic neurons. Biol Psychiatry. 2010;67:88–92. doi: 10.1016/j.biopsych.2009.08.001. CrossRef Medline. [DOI] [PubMed] [Google Scholar]
- Kufahl PR, Zavala AR, Singh A, Thiel KJ, Dickey ED, Joyce JN, Neisewander JL. c-Fos expression associated with reinstatement of cocaine-seeking behavior by response-contingent conditioned cues. Synapse. 2009;63:823–835. doi: 10.1002/syn.20666. CrossRef Medline. [DOI] [PMC free article] [PubMed] [Google Scholar]
- Kühn S, Gallinat J. Common biology of craving across legal and illegal drugs—a quantitative meta-analysis of cue-reactivity brain response. Eur J Neurosci. 2011;33:1318–1326. doi: 10.1111/j.1460-9568.2010.07590.x. CrossRef Medline. [DOI] [PubMed] [Google Scholar]
- Li W, Gao YH, Chang M, Peng YL, Yao J, Han RW, Wang R. Neuropeptide S inhibits the acquisition and the expression of conditioned place preference to morphine in mice. Peptides. 2009;30:234–240. doi: 10.1016/j.peptides.2008.10.004. CrossRef Medline. [DOI] [PubMed] [Google Scholar]
- Loopuijt LD, Zahm DS. Synaptologic and fine structural features distinguishing a subset of basal forebrain cholinergic neurons embedded in the dense intrinsic fiber network of the caudal extended amygdala. J Comp Neurol. 2006;498:93–111. doi: 10.1002/cne.21044. CrossRef Medline. [DOI] [PubMed] [Google Scholar]
- Luo AH, Tahsili-Fahadan P, Wise RA, Lupica CR, Aston-Jones G. Linking context with reward: a functional circuit from hippocampal CA3 to ventral tegmental area. Science. 2011;333:353–357. doi: 10.1126/science.1204622. CrossRef Medline. [DOI] [PMC free article] [PubMed] [Google Scholar]
- Mahler SV, Smith RJ, Moorman DE, Sartor GC, Aston-Jones G. Multiple roles for orexin/hypocretin in addiction. Prog Brain Res. 2012a;198:79–121. doi: 10.1016/B978-0-444-59489-1.00007-0. CrossRef Medline. [DOI] [PMC free article] [PubMed] [Google Scholar]
- Mahler SV, Smith RJ, Aston-Jones G. Interactions between VTA orexin and glutamate in cue-induced reinstatement of cocaine seeking in rats. Psychopharmacology (Berl) 2012b doi: 10.1007/s00213-012-2681-5. CrossRef Medline. [DOI] [PMC free article] [PubMed] [Google Scholar]
- Matsumoto M, Hikosaka O. Lateral habenula as a source of negative reward signals in dopamine neurons. Nature. 2007;447:1111–1115. doi: 10.1038/nature05860. CrossRef Medline. [DOI] [PubMed] [Google Scholar]
- McFarland K, Davidge SB, Lapish CC, Kalivas PW. Limbic and motor circuitry underlying footshock-induced reinstatement of cocaine-seeking behavior. J Neurosci. 2004;24:1551–1560. doi: 10.1523/JNEUROSCI.4177-03.2004. CrossRef Medline. [DOI] [PMC free article] [PubMed] [Google Scholar]
- Mejías-Aponte CA, Drouin C, Aston-Jones G. Adrenergic and noradrenergic innervation of the midbrain ventral tegmental area and retrorubral field: prominent inputs from medullary homeostatic centers. J Neurosci. 2009;29:3613–3626. doi: 10.1523/JNEUROSCI.4632-08.2009. CrossRef Medline. [DOI] [PMC free article] [PubMed] [Google Scholar]
- Moorman DE, Aston-Jones G. Orexin/hypocretin modulates response of ventral tegmental dopamine neurons to prefrontal activation: diurnal influences. J Neurosci. 2010;30:15585–15599. doi: 10.1523/JNEUROSCI.2871-10.2010. CrossRef Medline. [DOI] [PMC free article] [PubMed] [Google Scholar]
- Nair SG, Adams-Deutsch T, Pickens CL, Smith DG, Shaham Y. Effects of the MCH1 receptor antagonist SNAP 94847 on high-fat food-reinforced operant responding and reinstatement of food seeking in rats. Psychopharmacology (Berl) 2009;205:129–140. doi: 10.1007/s00213-009-1523-6. CrossRef Medline. [DOI] [PMC free article] [PubMed] [Google Scholar]
- Nauta WJ, Smith GP, Faull RL, Domesick VB. Efferent connections and nigral afferents of the nucleus accumbens septi in the rat. Neuroscience. 1978;3:385–401. doi: 10.1016/0306-4522(78)90041-6. CrossRef Medline. [DOI] [PubMed] [Google Scholar]
- Oakman SA, Faris PL, Kerr PE, Cozzari C, Hartman BK. Distribution of pontomesencephalic cholinergic neurons projecting to substantia nigra differs significantly from those projecting to ventral tegmental area. J Neurosci. 1995;15:5859–5869. doi: 10.1523/JNEUROSCI.15-09-05859.1995. Medline. [DOI] [PMC free article] [PubMed] [Google Scholar]
- Olds J. Self-stimulation of the brain; its use to study local effects of hunger, sex, and drugs. Science. 1958;127:315–324. doi: 10.1126/science.127.3294.315. CrossRef Medline. [DOI] [PubMed] [Google Scholar]
- Olds J, Milner P. Positive reinforcement produced by electrical stimulation of septal area and other regions of rat brain. J Comp Physiol Psychol. 1954;47:419–427. doi: 10.1037/h0058775. CrossRef Medline. [DOI] [PubMed] [Google Scholar]
- Omelchenko N, Bell R, Sesack SR. Lateral habenula projections to dopamine and GABA neurons in the rat ventral tegmental area. Eur J Neurosci. 2009;30:1239–1250. doi: 10.1111/j.1460-9568.2009.06924.x. CrossRef Medline. [DOI] [PMC free article] [PubMed] [Google Scholar]
- Overton PG, Tong ZY, Clark D. A pharmacological analysis of the burst events induced in midbrain dopaminergic neurons by electrical stimulation of the prefrontal cortex in the rat. J Neural Transm. 1996;103:523–540. doi: 10.1007/BF01273151. CrossRef Medline. [DOI] [PubMed] [Google Scholar]
- Paxinos G, Watson C. The rat brain in stereotaxic coordinates. Ed 6. Amsterdam: Academic/Elsevier; 2007. [Google Scholar]
- Peciña S, Berridge KC. Hedonic hot spot in nucleus accumbens shell: where do mu-opioids cause increased hedonic impact of sweetness? J Neurosci. 2005;25:11777–11786. doi: 10.1523/JNEUROSCI.2329-05.2005. CrossRef Medline. [DOI] [PMC free article] [PubMed] [Google Scholar]
- Phillips AG, Vacca G, Ahn S. A top-down perspective on dopamine, motivation and memory. Pharmacol Biochem Behav. 2008;90:236–249. doi: 10.1016/j.pbb.2007.10.014. CrossRef Medline. [DOI] [PubMed] [Google Scholar]
- Phillipson OT. Afferent projections to the ventral tegmental area of Tsai and interfascicular nucleus: a horseradish peroxidase study in the rat. J Comp Neurol. 1979;187:117–143. doi: 10.1002/cne.901870108. CrossRef Medline. [DOI] [PubMed] [Google Scholar]
- Poulin JF, Castonguay-Lebel Z, Laforest S, Drolet G. Enkephalin coexpression with classic neurotransmitters in the amygdaloid complex of the rat. J Comp Neurol. 2008;506:943–959. doi: 10.1002/cne.21587. CrossRef Medline. [DOI] [PubMed] [Google Scholar]
- Reynolds SM, Berridge KC. Fear and feeding in the nucleus accumbens shell: rostrocaudal segregation of GABA-elicited defensive behavior versus eating behavior. J Neurosci. 2001;21:3261–3270. doi: 10.1523/JNEUROSCI.21-09-03261.2001. Medline. [DOI] [PMC free article] [PubMed] [Google Scholar]
- Reynolds SM, Berridge KC. Positive and negative motivation in nucleus accumbens shell: bivalent rostrocaudal gradients for GABA-elicited eating, taste “liking”/“disliking” reactions, place preference/avoidance, and fear. J Neurosci. 2002;22:7308–7320. doi: 10.1523/JNEUROSCI.22-16-07308.2002. Medline. [DOI] [PMC free article] [PubMed] [Google Scholar]
- Reynolds SM, Berridge KC. Glutamate motivational ensembles in nucleus accumbens: rostrocaudal shell gradients of fear and feeding. Eur J Neurosci. 2003;17:2187–2200. doi: 10.1046/j.1460-9568.2003.02642.x. CrossRef Medline. [DOI] [PubMed] [Google Scholar]
- Richard JM, Berridge KC. Nucleus accumbens dopamine/glutamate interaction switches modes to generate desire versus dread: D(1) alone for appetitive eating but D(1) and D(2) together for fear. J Neurosci. 2011;31:12866–12879. doi: 10.1523/JNEUROSCI.1339-11.2011. CrossRef Medline. [DOI] [PMC free article] [PubMed] [Google Scholar]
- Richardson KA, Aston-Jones G. Lateral hypothalamic orexin/hypocretin neurons that project to VTA are differentially activated with morphine preference. J Neurosci. 2012;32:3809–3817. doi: 10.1523/JNEUROSCI.3917-11.2012. CrossRef Medline. [DOI] [PMC free article] [PubMed] [Google Scholar]
- Risold PY, Swanson LW. Chemoarchitecture of the rat lateral septal nucleus. Brain Res Brain Res Rev. 1997a;24:91–113. doi: 10.1016/s0165-0173(97)00008-8. Medline. [DOI] [PubMed] [Google Scholar]
- Risold PY, Swanson LW. Connections of the rat lateral septal complex. Brain Res Brain Res Rev. 1997b;24:115–195. doi: 10.1016/s0165-0173(97)00009-x. Medline. [DOI] [PubMed] [Google Scholar]
- Robbins TW, Everitt BJ. Limbic-striatal memory systems and drug addiction. Neurobiol Learn Mem. 2002;78:625–636. doi: 10.1006/nlme.2002.4103. CrossRef Medline. [DOI] [PubMed] [Google Scholar]
- Robbins TW, Ersche KD, Everitt BJ. Drug addiction and the memory systems of the brain. Ann N Y Acad Sci. 2008;1141:1–21. doi: 10.1196/annals.1441.020. CrossRef Medline. [DOI] [PubMed] [Google Scholar]
- Robledo P, Koob GF. Two discrete nucleus accumbens projection areas differentially mediate cocaine self-administration in the rat. Behav Brain Res. 1993;55:159–166. doi: 10.1016/0166-4328(93)90112-4. CrossRef Medline. [DOI] [PubMed] [Google Scholar]
- Roitman MF, Stuber GD, Phillips PE, Wightman RM, Carelli RM. Dopamine operates as a subsecond modulator of food seeking. J Neurosci. 2004;24:1265–1271. doi: 10.1523/JNEUROSCI.3823-03.2004. CrossRef Medline. [DOI] [PMC free article] [PubMed] [Google Scholar]
- Sahraei H, Amiri YA, Haeri-Rohani A, Sepehri H, Salimi SH, Pourmotabbed A, Ghoshooni H, Zahirodin A, Zardooz H. Different effects of GABAergic receptors located in the ventral tegmental area on the expression of morphine-induced conditioned place preference in rat. Eur J Pharmacol. 2005;524:95–101. doi: 10.1016/j.ejphar.2005.09.012. CrossRef Medline. [DOI] [PubMed] [Google Scholar]
- Sakurai T, Amemiya A, Ishii M, Matsuzaki I, Chemelli RM, Tanaka H, Williams SC, Richardson JA, Kozlowski GP, Wilson S, Arch JR, Buckingham RE, Haynes AC, Carr SA, Annan RS, McNulty DE, Liu WS, Terrett JA, Elshourbagy NA, Bergsma DJ, Yanagisawa M. Orexins and orexin receptors: a family of hypothalamic neuropeptides and G protein-coupled receptors that regulate feeding behavior. Cell. 1998;92:573–585. doi: 10.1016/s0092-8674(00)80949-6. CrossRef Medline. [DOI] [PubMed] [Google Scholar]
- Salamone JD, Correa M, Farrar A, Mingote SM. Effort-related functions of nucleus accumbens dopamine and associated forebrain circuits. Psychopharmacology (Berl) 2007;191:461–482. doi: 10.1007/s00213-006-0668-9. CrossRef Medline. [DOI] [PubMed] [Google Scholar]
- Sartor GC, Aston-Jones GS. A septal-hypothalamic pathway drives orexin neurons which is necessary for conditioned cocaine preference. J Neurosci. 2012;32:4623–4631. doi: 10.1523/JNEUROSCI.4561-11.2012. CrossRef Medline. [DOI] [PMC free article] [PubMed] [Google Scholar]
- Schmitt O, Usunoff KG, Lazarov NE, Itzev DE, Eipert P, Rolfs A, Wree A. Orexinergic innervation of the extended amygdala and basal ganglia in the rat. Brain Struct Funct. 2012;217:233–256. doi: 10.1007/s00429-011-0343-8. CrossRef Medline. [DOI] [PubMed] [Google Scholar]
- Schultz W. Behavioral dopamine signals. Trends Neurosci. 2007;30:203–210. doi: 10.1016/j.tins.2007.03.007. CrossRef Medline. [DOI] [PubMed] [Google Scholar]
- Schultz W. Dopamine signals for reward value and risk: basic and recent data. Behav Brain Funct. 2010;6:24. doi: 10.1186/1744-9081-6-24. CrossRef Medline. [DOI] [PMC free article] [PubMed] [Google Scholar]
- Sesack SR, Grace AA. CortiBasal Ganglia reward network: microcircuitry. Neuropsychopharmacology. 2010;35:27–47. doi: 10.1038/npp.2009.93. CrossRef Medline. [DOI] [PMC free article] [PubMed] [Google Scholar]
- Shammah-Lagnado SJ, Alheid GF, Heimer L. Afferent connections of the interstitial nucleus of the posterior limb of the anterior commissure and adjacent amygdalostriatal transition area in the rat. Neuroscience. 1999;94:1097–1123. doi: 10.1016/s0306-4522(99)90280-4. CrossRef Medline. [DOI] [PubMed] [Google Scholar]
- Smith KS, Berridge KC, Aldridge JW. Disentangling pleasure from incentive salience and learning signals in brain reward circuitry. Proc Natl Acad Sci U S A. 2011;108:E255–264. doi: 10.1073/pnas.1101920108. CrossRef Medline. [DOI] [PMC free article] [PubMed] [Google Scholar]
- Smith RJ, Aston-Jones G. Orexin/hypocretin 1 receptor antagonist reduces heroin self-administration and cue-induced heroin seeking. Eur J Neurosci. 2012;35:798–804. doi: 10.1111/j.1460-9568.2012.08013.x. CrossRef Medline. [DOI] [PMC free article] [PubMed] [Google Scholar]
- Smith RJ, See RE, Aston-Jones G. Orexin/hypocretin signaling at the orexin 1 receptor regulates cue-elicited cocaine-seeking. Eur J Neurosci. 2009;30:493–503. doi: 10.1111/j.1460-9568.2009.06844.x. CrossRef Medline. [DOI] [PMC free article] [PubMed] [Google Scholar]
- Smith RJ, Tahsili-Fahadan P, Aston-Jones G. Orexin/hypocretin is necessary for context-driven cocaine-seeking. Neuropharmacology. 2010;58:179–184. doi: 10.1016/j.neuropharm.2009.06.042. CrossRef Medline. [DOI] [PMC free article] [PubMed] [Google Scholar]
- Soderman AR, Unterwald EM. Cocaine reward and hyperactivity in the rat: sites of mu opioid receptor modulation. Neuroscience. 2008;154:1506–1516. doi: 10.1016/j.neuroscience.2008.04.063. CrossRef Medline. [DOI] [PMC free article] [PubMed] [Google Scholar]
- Stanley BG, Urstadt KR, Charles JR, Kee T. Glutamate and GABA in lateral hypothalamic mechanisms controlling food intake. Physiol Behav. 2011;104:40–46. doi: 10.1016/j.physbeh.2011.04.046. CrossRef Medline. [DOI] [PubMed] [Google Scholar]
- Sugimoto T, Hattori T. Organization and efferent projections of nucleus tegmenti pedunculopontinus pars compacta with special reference to its cholinergic aspects. Neuroscience. 1984;11:931–946. doi: 10.1016/0306-4522(84)90204-5. CrossRef Medline. [DOI] [PubMed] [Google Scholar]
- Sun N, Cassell MD. Intrinsic GABAergic neurons in the rat central extended amygdala. J Comp Neurol. 1993;330:381–404. doi: 10.1002/cne.903300308. CrossRef Medline. [DOI] [PubMed] [Google Scholar]
- Swanson LW. Brain maps: structure of the rat brain. New York: Elsevier; 1992. [Google Scholar]
- Swanson LW, Cowan WM. The connections of the septal region in the rat. J Comp Neurol. 1979;186:621–655. doi: 10.1002/cne.901860408. CrossRef Medline. [DOI] [PubMed] [Google Scholar]
- Tang XC, McFarland K, Cagle S, Kalivas PW. Cocaine-induced reinstatement requires endogenous stimulation of mu-opioid receptors in the ventral pallidum. J Neurosci. 2005;25:4512–4520. doi: 10.1523/JNEUROSCI.0685-05.2005. CrossRef Medline. [DOI] [PMC free article] [PubMed] [Google Scholar]
- Thompson RH, Swanson LW. Hypothesis-driven structural connectivity analysis supports network over hierarchical model of brain architecture. Proc Natl Acad Sci U S A. 2010;107:15235–15239. doi: 10.1073/pnas.1009112107. CrossRef Medline. [DOI] [PMC free article] [PubMed] [Google Scholar]
- Tindell AJ, Smith KS, Berridge KC, Aldridge JW. Dynamic computation of incentive salience: “wanting” what was never “liked”. J Neurosci. 2009;29:12220–12228. doi: 10.1523/JNEUROSCI.2499-09.2009. CrossRef Medline. [DOI] [PMC free article] [PubMed] [Google Scholar]
- Tong ZY, Overton PG, Clark D. Stimulation of the prefrontal cortex in the rat induces patterns of activity in midbrain dopaminergic neurons which resemble natural burst events. Synapse. 1996;22:195–208. doi: 10.1002/(SICI)1098-2396(199603)22:3<195::AID-SYN1>3.0.CO;2-7. Medline. [DOI] [PubMed] [Google Scholar]
- Usuda I, Tanaka K, Chiba T. Efferent projections of the nucleus accumbens in the rat with special reference to subdivision of the nucleus: biotinylated dextran amine study. Brain Res. 1998;797:73–93. doi: 10.1016/s0006-8993(98)00359-x. CrossRef Medline. [DOI] [PubMed] [Google Scholar]
- Vertes RP. A PHA-L analysis of ascending projections of the dorsal raphe nucleus in the rat. J Comp Neurol. 1991;313:643–668. doi: 10.1002/cne.903130409. CrossRef Medline. [DOI] [PubMed] [Google Scholar]
- Wanat MJ, Willuhn I, Clark JJ, Phillips PE. Phasic dopamine release in appetitive behaviors and drug addiction. Curr Drug Abuse Rev. 2009;2:195–213. doi: 10.2174/1874473710902020195. Medline. [DOI] [PMC free article] [PubMed] [Google Scholar]
- Wang B, You ZB, Wise RA. Reinstatement of cocaine seeking by hypocretin (orexin) in the ventral tegmental area: independence from the local corticotropin-releasing factor network. Biol Psychiatry. 2009;65:857–862. doi: 10.1016/j.biopsych.2009.01.018. CrossRef Medline. [DOI] [PMC free article] [PubMed] [Google Scholar]
- Wise RA, Bozarth MA. Brain substrates for reinforcement and drug self-administration. Prog Neuropsychopharmacol. 1981;5:467–474. doi: 10.1016/0364-7722(81)90028-x. CrossRef Medline. [DOI] [PubMed] [Google Scholar]
- Wise RA, Morales M. A ventral tegmental CRF-glutamate-dopamine interaction in addiction. Brain Res. 2010;1314:38–43. doi: 10.1016/j.brainres.2009.09.101. CrossRef Medline. [DOI] [PMC free article] [PubMed] [Google Scholar]
- Xia Y, Driscoll JR, Wilbrecht L, Margolis EB, Fields HL, Hjelmstad GO. Nucleus accumbens medium spiny neurons target non-dopaminergic neurons in the ventral tegmental area. J Neurosci. 2011;31:7811–7816. doi: 10.1523/JNEUROSCI.1504-11.2011. CrossRef Medline. [DOI] [PMC free article] [PubMed] [Google Scholar]
- You ZB, Wang B, Zitzman D, Azari S, Wise RA. A role for conditioned ventral tegmental glutamate release in cocaine seeking. J Neurosci. 2007;27:10546–10555. doi: 10.1523/JNEUROSCI.2967-07.2007. CrossRef Medline. [DOI] [PMC free article] [PubMed] [Google Scholar]
- Yun IA, Wakabayashi KT, Fields HL, Nicola SM. The ventral tegmental area is required for the behavioral and nucleus accumbens neuronal firing responses to incentive cues. J Neurosci. 2004;24:2923–2933. doi: 10.1523/JNEUROSCI.5282-03.2004. CrossRef Medline. [DOI] [PMC free article] [PubMed] [Google Scholar]
- Zahm DS. The ventral striatopallidal parts of the basal ganglia in the rat—II. Compartmentation of ventral pallidal efferents. Neuroscience. 1989;30:33–50. doi: 10.1016/0306-4522(89)90351-5. CrossRef Medline. [DOI] [PubMed] [Google Scholar]
- Zahm DS, Heimer L. Specificity in the efferent projections of the nucleus accumbens in the rat: comparison of the rostral pole projection patterns with those of the core and shell. J Comp Neurol. 1993;327:220–232. doi: 10.1002/cne.903270205. CrossRef Medline. [DOI] [PubMed] [Google Scholar]
- Zahm DS, Parsley KP, Schwartz ZM, Cheng AY. On lateral septum-like characteristics of outputs from the accumbal hedonic “hotspot” of Peciña and Berridge with commentary on the transitional nature of basal forebrain “boundaries.”. J Comp Neurol. 2012 doi: 10.1002/cne.23157. CrossRef Medline. [DOI] [PMC free article] [PubMed] [Google Scholar]
- Zavala AR, Osredkar T, Joyce JN, Neisewander JL. Upregulation of Arc mRNA expression in the prefrontal cortex following cue-induced reinstatement of extinguished cocaine-seeking behavior. Synapse. 2008;62:421–431. doi: 10.1002/syn.20502. CrossRef Medline. [DOI] [PMC free article] [PubMed] [Google Scholar]
- Zhang Y, Landthaler M, Schlussman SD, Yuferov V, Ho A, Tuschl T, Kreek MJ. Mu opioid receptor knockdown in the substantia nigra/ventral tegmental area by synthetic small interfering RNA blocks the rewarding and locomotor effects of heroin. Neuroscience. 2009;158:474–483. doi: 10.1016/j.neuroscience.2008.09.039. CrossRef Medline. [DOI] [PMC free article] [PubMed] [Google Scholar]
- Zijlstra F, Veltman DJ, Booij J, van den Brink W, Franken IH. Neurobiological substrates of cue-elicited craving and anhedonia in recently abstinent opioid-dependent males. Drug Alcohol Depend. 2009;99:183–192. doi: 10.1016/j.drugalcdep.2008.07.012. CrossRef Medline. [DOI] [PubMed] [Google Scholar]