This study demonstrates the feasibility of using ferumoxytol-enhanced MR angiography in imaging hemodialysis arteriovenous fistulas, with consistently superior image quality, compared with time-of-flight MR angiography.
Abstract
Purpose:
To determine the feasibility of using ferumoxytol-enhanced magnetic resonance (MR) angiography to depict the vasculature of hemodialysis fistulas and improve image quality compared with nonenhanced time-of-flight (TOF) MR angiography.
Materials and Methods:
The study was institutional review board approved and was in compliance with HIPAA regulations. All participants provided written informed consent. TOF and first-pass ferumoxytol-enhanced MR angiography were performed in 10 patients with upper extremity autogenous fistulas. Ferumoxytol was administered as a bolus solution containing 430 μmol of elemental iron. A qualitative comparison was performed on maximum intensity projection images. Lumen depiction was evaluated by using a five-point scale. The uniformity of intraluminal signal intensity was measured as the ratio between the mean signal intensity of the entirety of the imaged fistula and its standard deviation. The contrast-to-noise ratio (CNR) between intraluminal signal and adjacent tissue was evaluated as a function of image acquisition time. Lumen depiction scores, luminal signal heterogeneity, and CNR efficiency were compared between TOF and ferumoxytol-enhanced MR angiography by using a Wilcoxon-Mann-Whitney test.
Results:
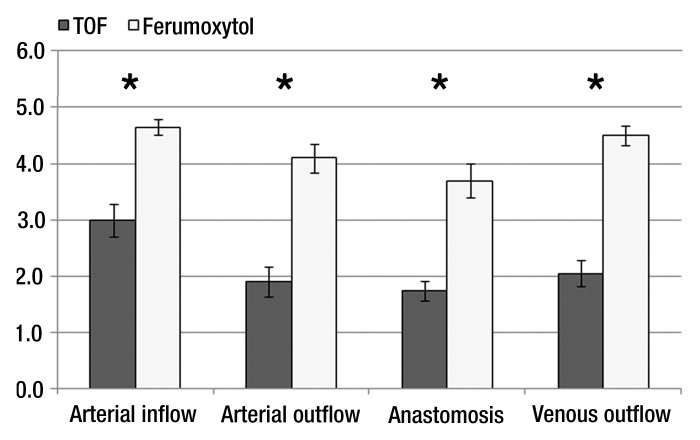
Flow artifacts were greatly reduced by the use of ferumoxytol-enhanced MR angiography. Ferumoxytol-enhanced MR angiography had significantly better performance than TOF MR angiography as measured with the following: lumen depiction scores in all segments (mean, 4.7 ± 0.1 [standard error of the mean]; vs 3.0 ± 0.3 for arterial inflow, 4.1 ± 0.3 vs 1.9 ± 0.3 for arterial outflow, 3.7 ± 0.3 vs 1.8 ± 0.2 for anastomosis, and 4.5 ± 0.2 vs 2.1 ± 0.2 for venous outflow; P < .001), intraluminal signal homogeneity (0.3 ± 0.02 vs 0.4 ± 0.06, P = .005), and CNR efficiency in the venous outflow (5.1 ± 0.6 vs 2.5 ± 0.4, P = .01).
Conclusion:
This study demonstrates the feasibility of using ferumoxytol-enhanced MR angiography in imaging hemodialysis fistulas with consistently superior image quality compared with nonenhanced TOF MR angiography.
© RSNA, 2012
Introduction
Improved methods are needed for the angiographic assessment of autogenous arteriovenous fistulas (AVFs), the preferred vascular access type for end-stage renal disease patients. AVFs are widely used but are prone to failure during maturation (1). Investigating the vascular remodeling involved in AVF maturation could provide further insight into the mechanisms of fistula failure. Magnetic resonance (MR) imaging has important advantages for noninvasive investigation of vascular remodeling because it provides three-dimensional angiographic information with anatomic landmarks, allowing easy coregistration between times. Gadolinium-based contrast material–enhanced MR angiography methods are generally contraindicated in this patient population (2), given the association between gadolinium use and nephrogenic systemic fibrosis in end-stage renal disease patients (3–5) Although gadolinium can be administered in emergent situations where the benefit outweighs the risk, particularly when dialysis can be performed immediately following gadolinium use, it is still unsuited for more routine monitoring needs. The feasibility and diagnostic value of nonenhanced time-of-flight (TOF) MR angiography has been demonstrated for AVFs (6–8). However, TOF imaging is dependent on blood flow conditions, and flow complexities in tortuous AVF geometries can result in poor image quality and inaccurate assessment of the vascular geometry.
Ultrasmall superparamagnetic iron oxide (USPIO) particles may have an application in the vascular assessment of patients with end-stage renal disease. USPIO particles appear to be well tolerated and have good safety profiles (9,10). The only USPIO particle approved in the United States by the Food and Drug Administration is ferumoxytol (Feraheme; AMAG Pharmaceuticals, Cambridge, Mass), which is approved for treating iron-deficient anemia in adults with chronic kidney disease. A high dose (510 mg of iron) can be administered rapidly (11), making ferumoxytol a good first-pass MR angiography agent.
The purpose of this study was to determine the feasibility of using ferumoxytol-enhanced MR angiography to depict the vasculature of hemodialysis fistulas and improve image quality, compared with nonenhanced TOF MR angiography.
Materials and Methods
Study Population
Patients who had an upper-extremity autogenous AVF placed by the vascular surgeons at our institution were included in the study. Exclusion criteria were as follows: routine MR imaging contraindications such as pacemakers, claustrophobia, and metal in the eyes; if the patients were in such poor health that they needed close monitoring at all times; known allergic reactions to iron; and known or suspected iron overload. None of the patients approached for this study were excluded for any of those reasons. The study was institutional review board approved (IRB no. 10-02895) and was in compliance with Health Insurance Portability and Accountability Act regulations. All participants provided written informed consent. Investigations were performed from February 2011 to November 2011.
MR Imaging
To minimize susceptibility effects, ferumoxytol was diluted in saline (1:5 dilution factor for a total of approximately 60 mL containing 360 mg of elemental iron) and administered in two steps as follows: A 2-mL volume was used for the timing bolus acquisition, and a 20-mL volume was used for first-pass MR angiographic imaging, representing a dose of 0.03 mmol/L of elemental iron per kilogram of body weight for a 70-kg patient. Contrast agent was injected intravenously through a 22-gauge intravenous catheter placed in the antecubital fossa of the contralateral arm by using a power injector (Spectris Solaris; Medrad, Indianola, Pa) at a rate of 2 mL/sec followed by a saline flush (20 mL).
All MR images were obtained with a 1.5-T MR unit (Avanto; Siemens Medical Systems, Erlangen, Germany). The patient was positioned supine in the magnet. The arm with the fistula was in the anatomic position at the patient’s side, and the patient was positioned with the untreated arm close to the side of the magnet bore so that the fistula could be as close to the magnet center as possible. A surface coil (Flex; Siemens Medical Systems, Erlangen, Germany), 170 × 360 mm, was wrapped around the patient’s arm at the level of the fistula anastomosis. Wrapping the coil around the patient’s arm resulted in much improved homogeneity of the signal across the field of view than if the coil were positioned parallel to and on one side of the arm. A two-dimensional TOF MR angiogram was used for anastomosis localization. The following high-spatial-resolution MR angiography sequences were acquired: The first sequence was a segmented centric reordered three-dimensional TOF acquisition covering a transverse slab from 4 cm above to 2 cm below the anastomosis, with acquisition parameters of repetition time msec/echo time msec, 30/7; flip angle, 25°; volume of interest, 130 × 113 × 60 mm3; number of sections, 100; acquisition matrix, 256 × 134; section oversample, 20%; phase partial Fourier, 0.75; section partial Fourier, 0.75; interpolated voxel, 0.25 × 0.25 × 0.6 mm3; bandwidth, 158 Hz/pixel; number of signals acquired, one; and acquisition time of 4 minutes 30 seconds. The second was an elliptic centric three-dimensional contrast-enhanced fast low-angle shot parasagittal acquisition, with acquisition parameters of 3.8/1.4; flip angle, 35°; volume of interest, 130 × 130 × 48 mm3; number of slabs, one; number of sections, 60; acquisition matrix, 256 × 154; phase partial Fourier, 0.75; section partial Fourier, 0.75; interpolated voxel, 0.25 × 0.25 × 0.8 mm3; bandwidth, 376 Hz/pixel; number of signals acquired, one; and acquisition time, 19 seconds. The TOF sequence was optimized during a pilot scan to obtain the best possible coverage of the fistula. Based on Ernst angle calculation, the flip angle used for the contrast-enhanced fast low-angle shot sequence offered optimal signal enhancement for the estimated ferumoxytol concentration in blood during first pass. Contrast agent bolus timing was determined on a transverse section upstream of the anastomosis and subsequently used to synchronize the start of the contrast-enhanced MR angiography acquisition to the arrival of the contrast agent bolus.
Qualitative Analysis
For each MR angiography study, maximum intensity projection (MIP) images were generated at 11° rotational increments around the longitudinal axis from the source data at the end of the MR image. When necessary, adjacent vessels were manually removed from the final MIP image. Matched TOF and ferumoxytol-enhanced MR angiography MIP images were displayed side by side, and one observer (M.S., imaging scientist with 5 years of experience) descriptively assessed fistula geometry with presence, type, and location of artifacts. Each fistula was then divided in four segments: arterial inflow, anastomosis, arterial outflow (segment downstream from the anastomosis continuing to the hand), and venous outflow. Two vascular surgeons with extensive experience in AVF placement (C.D.O., vascular surgeon with 7 years of experience, and W.G., vascular surgeon with 2 years of experience) independently assigned a score for the quality of lumen depiction for each segment by using an ordinal scale: score 1, insufficient; score 2, fair; score 3, satisfactory; score 4, good; and score 5, excellent.
Quantitative Analysis
Lumen diameters were measured on TOF and ferumoxytol-enhanced MR angiography (by M.S.) at the following locations relative to the anastomosis: proximal (arterial), +2 cm, +1 cm, (at anastomosis), 0 cm; distal (venous) +1 cm, +2 cm. Images were generated orthogonal to the lumen by using a multiplanar reformatting tool (Amira; Visage Imaging, Berlin, Germany). The localization of the anastomosis was performed by using the three-plane and MIP viewer of the image analysis program. Two orthogonal diameters were drawn on each image, and the final lumen diameter was the average of these two measurements. Analysis was performed on a personal computer.
For quantitative analysis of luminal signal enhancement, two parameters were assessed: heterogeneity of the luminal signal intensity (SI) and contrast-to-noise efficiency. To assess the heterogeneity of the luminal SI, a semiautomatic segmentation of the entire vascular anatomy was performed on each MR angiography data set. This segmentation was used as a mask to obtain the distribution of luminal SIs. Heterogeneity was then assessed as the ratio between the standard deviation and the mean of luminal SI. To assess contrast-to-noise efficiency, the ferumoxytol-enhanced MR angiography data were reformatted in the axial plane and analysis was performed at spatially matched locations. User-defined regions of interest with an average area of 59 mm2 (range, 10–304 mm2) for TOF MR angiography and average area of 57 mm2 (range, 4–344 mm2) for ferumoxytol-enhanced MR angiography (one at the anastomosis, two in the artery, and two in the vein) were contoured in the lumen in the surrounding muscle and in the background noise. The contrast-to-noise ratio (CNR) was obtained as the difference between the mean SI of the lumen and the mean SI of the surrounding muscle divided by the standard deviation of noise. All SI measurements were made by using software (ImageJ; National Institutes of Health, Bethesda, Md). CNR efficiency was then calculated as the ratio between CNR and the square root of the acquisition time for each of the MR angiography sequences.
Statistical Analysis
Data are expressed as mean ± standard error of the mean. Interobserver agreement was assessed with a κ statistics test. The qualitative scores of lumen depiction were compared between TOF and ferumoxytol-enhanced MR angiography by using a Wilcoxon signed-rank test. Agreement for lumen diameter measurements between TOF and ferumoxytol-enhanced MR angiography was evaluated by linear regression analysis and Bland-Altman plot. Luminal signal heterogeneities and CNR efficiencies were compared between the two MR angiography sequences. Normal distribution of data was not assumed; thus, a Wilcoxon signed-rank test was used for both parameters. A difference with a P value of less than .05 was considered to be significant. All statistical analyses were performed by using software (Intercooled Stata 10.0; StataCorp, College Station, Tex).
Results
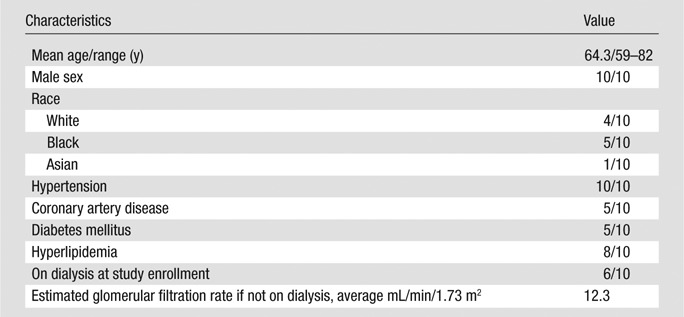
Ten upper-extremity autogenous AVFs at different stages of development were evaluated in the present study. One fistula was clinically diagnosed as failing, while the rest were functioning normally. Patient demographics are shown in Table 1. Digital subtraction angiography (DSA) images obtained within 2 months of the MR images were available for four of 10 patients. The images are presented for qualitative comparison only. None of the patients experienced adverse reactions to contrast agent administration.
Table 1.
Patient Demographic Data (n = 10)
Qualitative Analysis
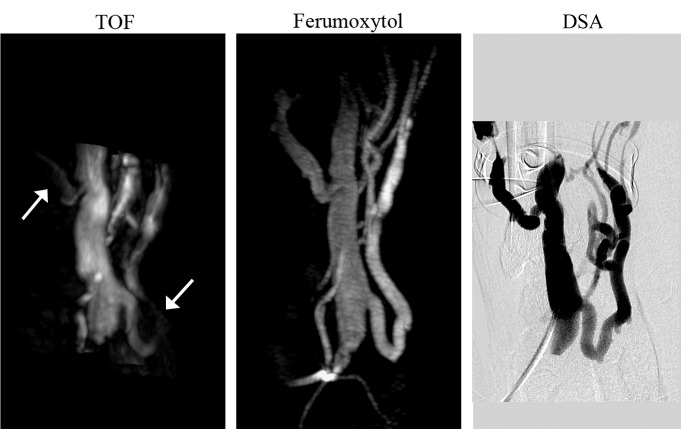
Findings from the qualitative analysis of flow artifact are summarized in Table 2. The most common flow artifact observed at TOF MR angiography was blurring of vessel borders. In comparison, borders were clearly delineated at ferumoxytol-enhanced MR angiography. Flow-related signal hypointensities were also less prevalent, though not completely eliminated, at ferumoxytol-enhanced MR angiography. The arterial inflow was generally well depicted on TOF MR angiographic images, except for saturation effects at the edge of each imaging segment of the three-dimensional volume (two cases) and signal hypointensity in a segment (3.5 cm in length) of the radiocephalic AVF distal from the anastomosis, which was, however, clearly depicted on ferumoxytol-enhanced MR angiograms with no apparent stenosis (Fig 1). These effects were not present on ferumoxytol-enhanced MR angiograms. In all cases, the arterial segment continuing to the hand, distal to the anastomosis, was depicted with ferumoxytol but was generally poorly visualized with TOF imaging because of low velocities and flow reversal.
Table 2.
Presence and Type of Flow Artifacts

Figure 1:
Whole-volume MIP images of radiocephalic wrist fistula (1 month after surgery). TOF MIP image shows low signal intensity in the arterial inflow and side branch on the venous outflow (arrows); these regions are clearly depicted on the ferumoxytol-enhanced MR angiography MIP image. Note that the TOF coverage of the vascular anatomy is only half the coverage of the ferumoxytol-enhanced MR angiogram. Absence of stenosis was confirmed by using DSA.
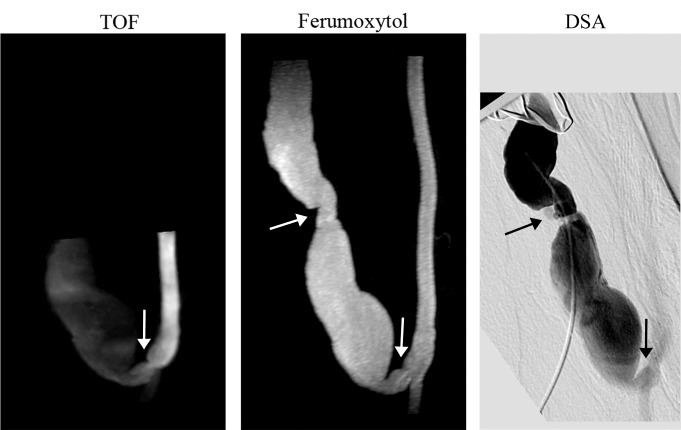
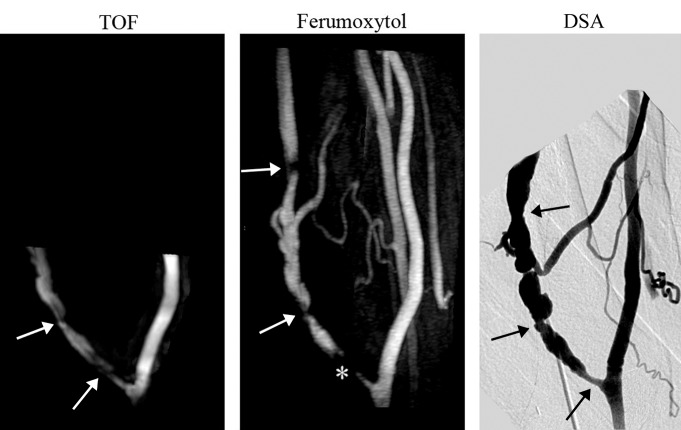
The overall enhancement of the venous outflow was lower compared with the arterial segment. In one patient who had a failing fistula at presentation (clinical assessment prior to MR imaging), the venous outflow was very poorly depicted by using TOF imaging. In this patient, the complex geometry due to pseudoaneurysm formation in the mature fistulas was more clearly delineated by using ferumoxytol-enhanced MR angiography (Fig 2). Finally, flow artifacts were noted as apparent gaps on venous segments, as well as at the anastomosis, on MIP images (Fig 3) in three patients on TOF MR angiograms and in two patients on ferumoxytol-enhanced MR angiograms.
Figure 2:
Whole-volume MIP images of failing brachiocephalic fistula (> 1 year after surgery). TOF MIP image shows stenosis at the anastomosis (arrow) and low signal intensity in the venous outflow; ferumoxytol-enhanced MR angiography MIP image shows a well-defined vascular lumen and two stenoses, one at the anastomosis and one distal in the venous limb (arrows). Note the improved volume coverage of the ferumoxytol-enhanced MR angiogram that enables detection of a stenosis missed on the TOF image.
Figure 3:
Whole-volume MIP images of mature brachiocephalic elbow fistula (8 months after surgery). TOF MIP image illustrates two stenotic regions (arrows). Ferumoxytol-enhanced MR angiography MIP image shows three stenotic regions, two distal to the anastomosis (arrows) and one proximate that appears occluded (*). Note the improved volume coverage of the ferumoxytol-enhanced MR angiography that enables detection of stenosis missed at TOF imaging. All three stenotic regions were confirmed on DSA image.
Lumen depiction scores were significantly higher for ferumoxytol-enhanced MR angiography compared with TOF-MR angiography for each of the investigated segments (P < .001) (Fig 4). There was moderate agreement found between observers (κ = 0.43, P < .001).
Figure 4:
Lumen depiction scores (mean ± standard error of the mean). Scores were significantly higher for the ferumoxytol-enhanced MR angiography (* = P < .001).
Quantitative Analysis
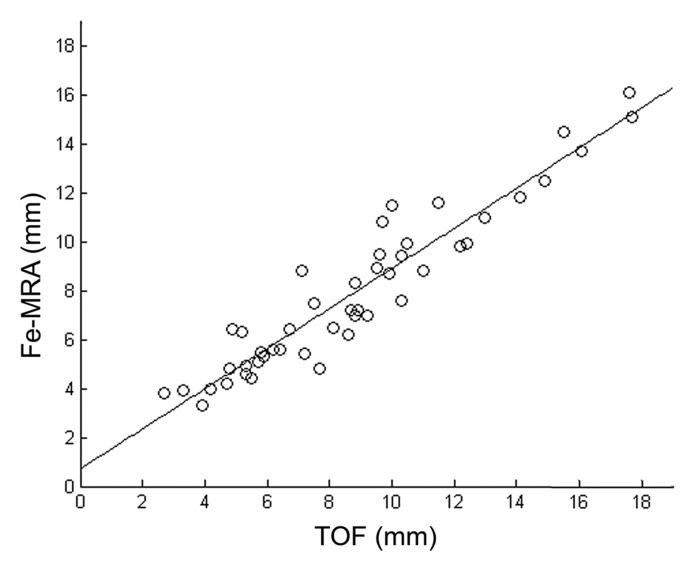
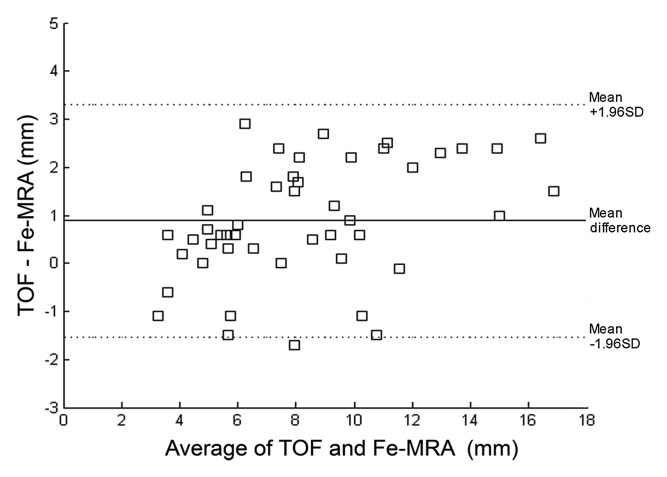
Good agreement was found for diameter values between the two methods (R2 = 0.89). The Bland-Altman plot showed diameters measured on TOF images to be slightly larger (approximately 1 mm) than diameters measured on ferumoxytol-enhanced images (Fig 5).
Figure 5a:
(a) Scatterplot and linear regression for the lumen diameters measured with TOF MR angiography and ferumoxytol-enhanced MR angiography (Fe-MRA) from all patients. Slope, intercept, and R2 values are 0.8, 0.8, and 0.89. (b) Bland-Altman plot for the relationship between TOF and ferumoxytol-enhanced MR angiography measured lumen diameters.
Figure 5b:
(a) Scatterplot and linear regression for the lumen diameters measured with TOF MR angiography and ferumoxytol-enhanced MR angiography (Fe-MRA) from all patients. Slope, intercept, and R2 values are 0.8, 0.8, and 0.89. (b) Bland-Altman plot for the relationship between TOF and ferumoxytol-enhanced MR angiography measured lumen diameters.
Venous stenoses were identified on the ferumoxytol-enhanced MR angiography MIP images in all but two patients: one stenosis in two patients and multiple stenoses in six patients. Because of more limited volume coverage, three stenoses were missed on the TOF MIP images.
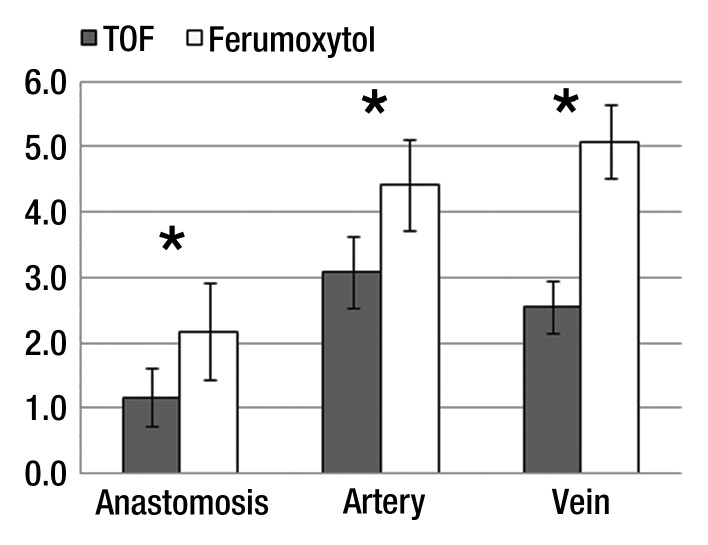
The heterogeneity of the luminal signal was significantly higher in TOF MR angiography (0.4 ±0.06) compared with ferumoxytol-enhanced MR angiography (0.3 ± 0.02) (P = .006). CNR efficiency of TOF was significantly lower than that of ferumoxytol enhancement in all three investigated regions (P < .01) (Fig 6).
Figure 6:
CNR efficiency averaged over all patients. Error bars represent the standard error of the mean (± standard error of the mean). CNR efficiency was significantly higher for all investigated segments on the ferumoxytol-enhanced images (* = P < .01).
Discussion
This study demonstrates the feasibility of ferumoxytol-enhanced MR angiography in imaging hemodialysis AVFs with consistently superior image quality compared with TOF MR angiography. Image quality in TOF MR angiography can be altered by flow artifacts that manifest as blurring of vessel borders, as well as low Sis, in various regions of the vascular geometry. Ferumoxytol improves image quality as demonstrated here by higher lumen depiction scores and by a more homogeneous luminal signal enhancement.
Flow artifacts were greatly reduced on ferumoxytol-enhanced MR angiography. Direct assessment of flow artifacts by a qualitative analysis demonstrated notably better depiction of all vessels for ferumoxytol-enhanced MR angiography. Furthermore, the luminal signal enhancement obtained at ferumoxytol-enhanced MR angiography was substantially more homogeneous than that at TOF MR angiography, an indirect reflection of its greater insensitivity to flow artifacts. CNR efficiency was markedly higher in the venous segment, suggesting that ferumoxytol-enhanced MR angiography has advantages for the visualization of regions with low blood flow velocities.
Nevertheless, ferumoxytol-enhanced MR angiography was not completely immune to flow artifacts. In two cases of venous stenoses, one identified by using DSA, signal gaps were noted on the ferumoxytol-enhanced MIP image. Flow artifacts on contrast-enhanced MR angiography resulting from a combination of very narrow vessels and high velocity have previously been noted (12). These artifacts are probably due to the absence of flow compensation gradients. A benefit of using ferumoxytol is that it is a blood pool agent and thus enables imaging with longer scan times and higher spatial resolution during the equilibrium phase. However, this was not explored in this initial study, which was rather aimed at assessing feasibility of using the agent in a setting with a short scan time to avoid venous contamination. For future studies, sequences will be investigated that are better adapted for use in the equilibrium phase and that might reduce signal loss artifacts.
Although ferumoxytol was recently approved for use in chronic kidney disease patients up to a dose of 510 mg (13,14), the administered dose for first-pass MR angiography needs careful consideration. Its high r2 relaxivity (83 mmol/sec at 0.47 T) compared with gadolinium-based agents (gadopentetate dimeglumine: 4 mmol/sec at 0.47 T), leads to a strong T2* effect that counters T1 enhancement, an effect that is highly dose dependent. When comparing dilution factors between gadopentetate dimeglumine and ferumoxytol, Li and collaborators (15) found that diluting ferumoxytol between four- to eightfold more than gadolinium results in the highest achievable signal-to-noise ratio, albeit smaller than the highest achievable with gadolinium, and minimizes susceptibility effects. In this study, only a small dose of ferumoxytol was administered, representing 23.5% of the total recommended dose for anemia treatment. A fivefold dilution was performed (ie, from 537.2 μmol/mL to 107.4 μmol/mL of elemental iron) and the injected volume was 20 mL (comprising 4 mL of ferumoxytol and 16 mL of saline), regardless of bodyweight. A similar dose was used by Li and collaborators for first-pass imaging. Based on phantom experiments, those authors recommended an eightfold dilution of ferumoxytol (67.1 μmol/mL) and an injected volume of 30–40 mL (15).
One advantage of ferumoxytol-enhanced MR angiography compared with TOF MR angiography is the reduction in acquisition time (19 seconds vs 4 minutes). Despite the shorter acquisition time, CNR efficiency was higher in all three regions of the vascular anatomy. Another advantage of ferumoxytol-enhanced MR angiography is better coverage of the vasculature, which enabled detection of distal venous stenoses that were otherwise undetected by using TOF MR angiography.
In addition to the conventional TOF MR angiography sequence, a steady-state free precession-type sequence with a slab-selective inversion pulse was also initially considered for this application. However, it was found that the latter did not perform well. Steady-state free precession sequences have inherent sensitivity to field heterogeneity. In this application, because of the location of the volume of interest close to the edge of the available field of view, image quality was greatly affected by the inhomogeneous field there. Indeed, steady-state free precession has proved to be effective in imaging the aorta and renal arteries. However, for this application, image quality with steady-state free precession was unacceptable.
One limitation of this study is the relatively low number of patients. However, the study goal was to test the feasibility of using ferumoxytol for imaging dialysis fistulas. Accuracy and precision were not investigated. Another limitation is that comparison to a reference standard (DSA) was not performed. Patients infrequently undergo DSA studies, and DSA examinations were not available in all subjects. While improved with respect to TOF, the limited coverage of ferumoxytol-enhanced MR angiography did not allow assessment of central venous stenosis. This issue will be addressed in future studies.
Ferumoxytol has a good safety profile and no known long-term toxicity. However, some adverse reactions may occur. Hypotension and hypersensitivity reactions, including anaphylactic-type reactions, have been reported in patients receiving ferumoxytol. Nausea, dizziness, headache, and vomiting have also been reported. None of the patients in this study experienced adverse reactions. Because of its lengthy retention, the current recommendation is not to perform diagnostic MR imaging scans for 3 months following ferumoxytol use.
Advance in Knowledge.
• Ferumoxytol enables contrast material–enhanced MR angiography in patients with dialysis fistulas in the nephrogenic systemic fibrosis era.
Implication for Patient Care.
• Because ferumoxytol-enhanced MR angiography provides high-quality images, it may prove to be useful in the early detection of vascular complications in patients with dialysis fistulas.
Disclosures of Conflicts of Interest: M.S. No relevant conflicts of interest to disclose. W.G. No relevant conflicts of interest to disclose. H.F.A. No relevant conflicts of interest to disclose. C.D.O. No relevant conflicts of interest to disclose. D.S. No relevant conflicts of interest to disclose.
Received January 3, 2012; revision requested February 22; final revision received March 28; accepted April 11; final version accepted April 23.
D.S. supported by a VA Merit Award.
Funding: This research was supported by the National Institutes of Health (grant NS059944).
Abbreviations:
- AVF
- arteriovenous fistula
- CNR
- contrast-to-noise ratio
- DSA
- digital subtraction angiography
- MIP
- maximum intensity projection
- SI
- signal intensity
- TOF
- time of flight
- USPIO
- ultrasmall superparamagnetic iron oxide
References
- 1.Dixon BS. Why don’t fistulas mature? Kidney Int. 2006;70(8):1413–1422 [DOI] [PubMed] [Google Scholar]
- 2.Perazella MA. How should nephrologists approach gadolinium-based contrast imaging in patients with kidney disease? Clin J Am Soc Nephrol. 2008;3(3):649–651 [DOI] [PubMed] [Google Scholar]
- 3.Grobner T. Gadolinium—a specific trigger for the development of nephrogenic fibrosing dermopathy and nephrogenic systemic fibrosis? Nephrol Dial Transplant. 2006;21(4):1104–1108 [DOI] [PubMed] [Google Scholar]
- 4.High WA, Ayers RA, Cowper SE. Gadolinium is quantifiable within the tissue of patients with nephrogenic systemic fibrosis. J Am Acad Dermatol. 2007;56(4):710–712 [DOI] [PubMed] [Google Scholar]
- 5.High WA, Ayers RA, Chandler J, Zito G, Cowper SE. Gadolinium is detectable within the tissue of patients with nephrogenic systemic fibrosis. J Am Acad Dermatol. 2007;56(1):21–26 [DOI] [PubMed] [Google Scholar]
- 6.Waldman GJ, Pattynama PM, Chang PC, Verburgh C, Reiber JH, de Roos A. Magnetic resonance angiography of dialysis access shunts: initial results. Magn Reson Imaging. 1996;14(2):197–200 [DOI] [PubMed] [Google Scholar]
- 7.Laissy JP, Menegazzo D, Debray MP, et al. Failing arteriovenous hemodialysis fistulas: assessment with magnetic resonance angiography. Invest Radiol. 1999;34(3):218–224 [DOI] [PubMed] [Google Scholar]
- 8.Cavagna E, D’Andrea P, Schiavon F, Tarroni G. Failing hemodialysis arteriovenous fistula and percutaneous treatment: imaging with CT, MRI and digital subtraction angiography. Cardiovasc Intervent Radiol. 2000;23(4):262–265 [DOI] [PubMed] [Google Scholar]
- 9.Bernd H, De Kerviler E, Gaillard S, Bonnemain B. Safety and tolerability of ultrasmall superparamagnetic iron oxide contrast agent: comprehensive analysis of a clinical development program. Invest Radiol. 2009;44(6):336–342 [DOI] [PubMed] [Google Scholar]
- 10.Neuwelt EA, Hamilton BE, Varallyay CG, et al. Ultrasmall superparamagnetic iron oxides (USPIOs): a future alternative magnetic resonance (MR) contrast agent for patients at risk for nephrogenic systemic fibrosis (NSF)? Kidney Int. 2009;75(5):465–474 [DOI] [PMC free article] [PubMed] [Google Scholar]
- 11.Provenzano R, Schiller B, Rao M, Coyne D, Brenner L, Pereira BJ. Ferumoxytol as an intravenous iron replacement therapy in hemodialysis patients. Clin J Am Soc Nephrol. 2009;4(2):386–393 [DOI] [PMC free article] [PubMed] [Google Scholar]
- 12.Townsend TC, Saloner D, Pan XM, Rapp JH. Contrast material-enhanced MRA overestimates severity of carotid stenosis, compared with 3D time-of-flight MRA. J Vasc Surg. 2003;38(1):36–40 [DOI] [PubMed] [Google Scholar]
- 13.Landry R, Jacobs PM, Davis R, Shenouda M, Bolton WK. Pharmacokinetic study of ferumoxytol: a new iron replacement therapy in normal subjects and hemodialysis patients. Am J Nephrol. 2005;25(4):400–410 [DOI] [PubMed] [Google Scholar]
- 14.Spinowitz BS, Schwenk MH, Jacobs PM, et al. The safety and efficacy of ferumoxytol therapy in anemic chronic kidney disease patients. Kidney Int. 2005;68(4):1801–1807 [DOI] [PubMed] [Google Scholar]
- 15.Li W, Tutton S, Vu AT, et al. First-pass contrast-enhanced magnetic resonance angiography in humans using ferumoxytol, a novel ultrasmall superparamagnetic iron oxide (USPIO)-based blood pool agent. J Magn Reson Imaging. 2005;21(1):46–52 [DOI] [PubMed] [Google Scholar]


