While conventional T1-weighted and fluid-sensitive sequences are entirely sufficient to determine the location and extent of a lesion, quantitative methods (chemical shift imaging, perfusion imaging, diffusion-weighted imaging, MR spectroscopy) have become available and provide metrics that may advance the role of MR imaging to include detection, characterization, and the reliable assessment of treatment response.
Abstract
Although the function of magnetic resonance (MR) imaging in the evaluation of musculoskeletal tumors has traditionally been to help identify the extent of disease prior to treatment, its role continues to evolve as new techniques emerge. Conventional pulse sequences remain heavily used and useful, but with the advent of chemical shift imaging, diffusion-weighted imaging, perfusion imaging and MR spectroscopy, additional quantitative metrics have become available that may help expand the role of MR imaging to include detection, characterization, and reliable assessment of treatment response. This review discusses a multiparametric approach to the evaluation of musculoskeletal tumors, with a focus on the utility and potential added value of various pulse sequences in helping establish a diagnosis, assess pretreatment extent, and evaluate a tumor in the posttreatment setting for recurrence and treatment response.
Supplemental material: http://radiology.rsna.org/lookup/suppl/doi:10.1148/radiol.12111740/-/DC1
© RSNA, 2012
Learning Objectives:
After reading the article and taking the test, the reader will be able to:
• List the additional information provided by diffusion-weighted and perfusion MR imaging and MR spectroscopy for characterization of musculoskeltal masses.
• Describe the ways in which diffusion-weighted and dynamic contrast-enhanced MR imaging and MR spectroscopy can be used to assess treatment response after neoadjuvant therapy prior to surgery of musculoskeletal masses.
• List the pulse sequences that constitute a comprehensive protocol for MR imaging of musculoskeletal tumors.
Accreditation and Designation Statement
The RSNA is accredited by the Accreditation Council for Continuing Medical Education (ACCME) to provide continuing medical education for physicians. The RSNA designates this journal-based CME activity for a maximum of 1.0 AMA PRA Category 1 Credit™. Physicans should claim only the credit commensurate with the extent of their participation in the activity.
Disclosure Statement
The ACCME requires that the RSNA, as an accredited provider of CME, obtain signed disclosure statements from the authors, editors, and reviewers for this activity. For this journal-based CME activity, author disclosures are listed at the end of this article.
Introduction
The role of magnetic resonance (MR) imaging in the evaluation of musculoskeletal tumors continues to evolve as newer pulse sequences emerge. One of the most important roles of MR imaging is in evaluating the extent of a musculoskeletal tumor for accurate treatment planning before surgery. For this purpose, conventional MR sequences are frequently entirely adequate in defining the full extent of a tumor, its relationship to the adjacent neurovascular bundle, and nearby joints (1). However, MR imaging may also be used for the roles of detection, characterization, and assessment of a tumor after treatment (both after neoadjuvant therapy before surgery for the assessment of treatment response and after surgery for assessment of postsurgical residual or recurrent disease) (2–6). The advent of chemical shift MR imaging (in-phase and opposed-phase imaging), diffusion-weighted (DW) imaging, perfusion imaging, and MR spectroscopy has advanced the role of MR for characterizing lesions for malignancy and assessing lesions after treatment. In this article, conventional and advanced imaging pulse sequences will be discussed as they relate to each of the roles MR imaging plays in the assessment of musculoskeletal tumors.
Musculoskeletal Tumor Imaging Protocol
No single imaging pulse sequence is sufficient to provide all the information required for the various roles MR imaging plays in the evaluation of musculoskeletal lesions. Each pulse sequence, as part of a comprehensive tumor imaging protocol (Table 1), may provide some additional value for the assessment of a musculoskeletal lesion, whether for characterization, determination of extent, or posttreatment evaluation. Table 1 lists the sequences used at our institution; the purpose of each is to provide anatomic, functional, or metabolic information. The comprehensive protocol in its entirety requires 60 minutes, 15 of which are devoted to the performance of MR spectroscopy. The techniques will be briefly described below in the order that they are performed for the tumor protocol at our institution. To decrease imaging time, if desired, only portions of the protocol may be performed, with the choice of sequences tailored to a specific role that MR imaging needs to fulfill for a given case.
Table 1.
Comprehensive 3-T MR Imaging Tumor Protocol
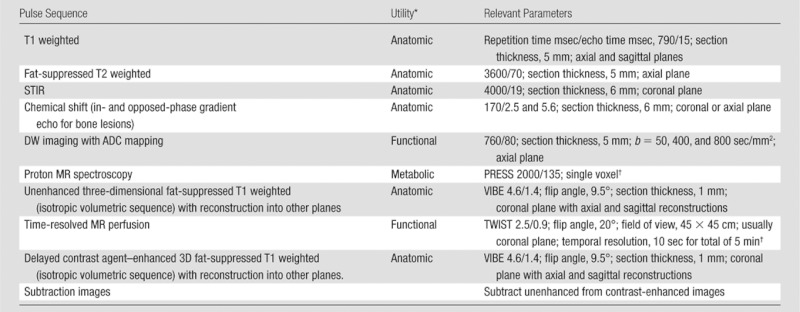
Note.—ADC = apparent diffusion coefficient, PRESS = point-resolved spectroscopy, STIR = short tau inversion recovery, TWIST = time-resolved angiography with interleaved stochastic trajectories (Siemens, Erlangen, Germany), VIBE = volumetric interpolated breath-hold examination.
Refers to whether the sequence provides anatomic detail on tumor location and extent, functional information on tumor cellularity and effects on perfusion or diffusion in a tumor, or metabolic activity through identification of metabolic markers of malignancy.
Single voxel size for spectroscopy varies by lesion size with exclusion of adjacent muscle, bone, and fat.
Field of view varies by body part.
T1-weighted and Fluid-sensitive Sequences (Anatomic Techniques)
Primary musculoskeletal tumors are a heterogeneous group of entities that have variable signal intensity characteristics on T1-weighted and fluid-sensitive images (7). The T1 and T2 relaxation properties are not a consistently static feature of tumors, because they are reflective of changes in the tumor microenvironment due to many interacting factors that are present in a growing tumor, such as changes in water content due to necrosis and hemorrhage or myxoid change or changes in tumor oxygenation. Therefore, with treatment, changes in the T1 and T2 relaxation times in the tumor compared with pretreatment levels are naturally expected (8). In addition, differences in basic tumor histologic characteristics affect the appearance of musculoskeletal tumors on T1- and T2-weighted images. For example, lipomas will demonstrate signal intensity characteristics of fat, while myxoid tumors will generally demonstrate signal intensity characteristics of fluid on nonenhanced T1- and T2-weighted images. However, when Petterson et al (7) studied 54 sarcomas, the T1 and T2 relaxation times were shown to be variable and nonspecific with regard to histologic typing.
Nevertheless, conventional T1-weighted and fluid-sensitive MR sequences (fat-suppressed T2 weighted or STIR) are of paramount importance to the identification and delineation of the extent of a musculoskeletal tumor. In fact, for bone tumors, a nonenhanced true T1-weighted sequence is most important, because contrast between the marrow-replacing tumor and the surrounding normal fatty marrow is exquisitely optimized with a T1-weighted sequence (Fig 1a) (9). For soft-tissue tumors, given that skeletal muscle is of intermediate signal intensity, contrast between tumor and surrounding normal skeletal muscle is often not as pronounced on T1-weighted image but is evident on fluid-sensitive images (Fig 2a, 2b). When producing fluid-sensitive images, there is a choice of whether to use a STIR or a fat-suppressed T2-weighted sequence, and although either of these pulse sequences is sufficient, STIR produces more favorable contrast between fluid and surrounding tissues (10,11). However, the introduction of the spectral presaturation with inversion recovery, or SPIR, technique with T2 weighting may prove to be optimal (12).
Figure 1a:
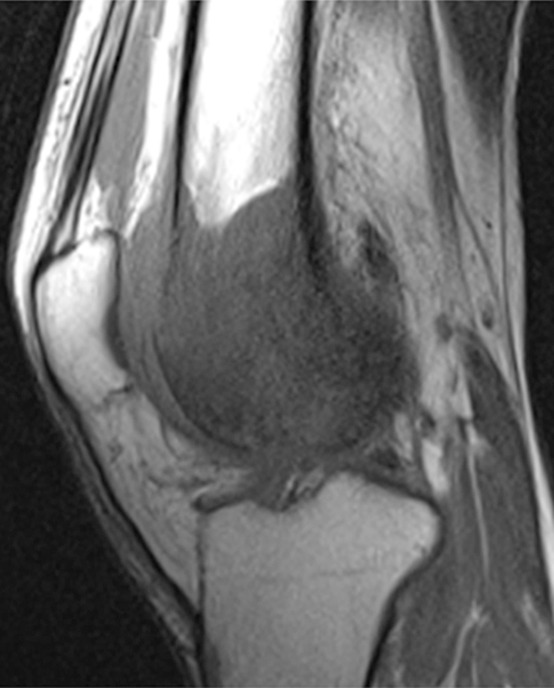
Osteosarcoma of the right femur in a 15-year-old girl. (a) Sagittal T1-weighted MR image (370/10) shows complete replacement of normal fatty marrow signal intensity involving epiphysis and distal metadiaphysis of the right femur. Images obtained with nonenhanced T1-weighted sequence best depict contrast between marrow-replacing tumor and normal fatty marrow for accurately defining extent of the lesion. (b) Coronal fat-suppressed T2-weighted MR image (4000/66) shows perilesional bone marrow edema (short arrow), periosteal reaction (long arrows), and extension of tumor into adjacent soft tissues (arrowhead).
Figure 2a:
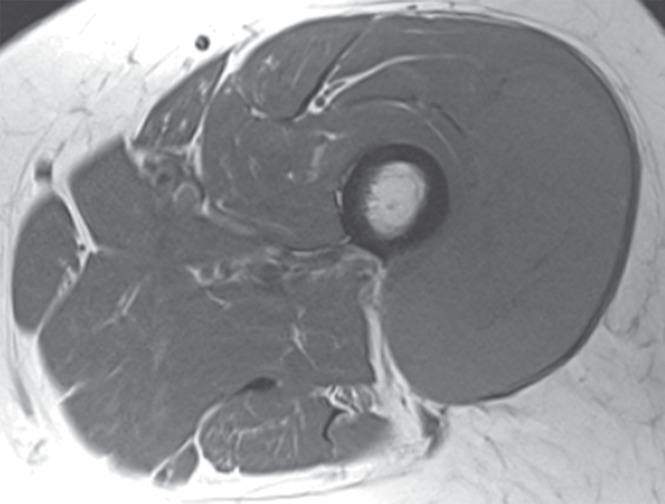
Pleomorphic rhabdomyosarcoma in an 81-year-old woman. Images were obtained (a–f) before and (g–l) after chemotherapy. (a) Axial T1-weighted MR image (466/16) shows lesion as fairly isointense to skeletal muscle with relatively subtle loss of normal muscle architecture. (b) Axial fat-suppressed T2-weighted MR image (3380/60) shows lesion to better advantage with good contrast resolution between mass and surrounding muscle. (c) ADC map shows low signal intensity in the mass and a range of ADCs from 0.9–1.1 × 10⁻³ mm2/sec. (d) Proton MR spectroscopy (point-resolved spectroscopy, 2000/135) shows discrete choline peak at 3.2 ppm (arrow). (e) Axial contrast-enhanced MR image obtained at perfusion imaging (TWIST, 3.4/1.2) 20 seconds after contrast agent administration shows avid early arterial enhancement in the lesion, in keeping with its malignant nature. (f) Coronal delayed contrast-enhanced MR image (volumetric interpolated breath-hold examination, 4.1/1.5) obtained by subtracting nonenhanced from contrast-enhanced images shows enhancement throughout the mass. This sequence, in addition to the T1-weighted and fluid-sensitive sequences, also provides a good anatomic image for evaluating the lesion and its relationship to adjacent structures. Pleomorphic rhabdomyosarcoma in an 81-year-old woman. Images were obtained (a–f) before and (g–l) after chemotherapy. (g) Axial T1-weighted MR image (466/16) shows that lesion remains subtle although decreased in size and of slightly altered signal intensity compared with its pretreatment appearance, now having slightly increased signal intensity relative to that of skeletal muscle. (h) Axial fat-suppressed T2-weighted MR image (3380/60) again shows interval decrease in size of the mass, now with more heterogeneous signal intensity, as compared with pretreatment image. Signal intensity changes after treatment are often identified and are not contributory toward interpretation of whether tumor has undergone treatment-related necrosis. (i) ADC map shows increased signal intensity with range of ADCs of 1.6–2.2 × 10⁻³ mm2/sec., a substantial difference compared with pretreatment images, suggesting interval treatment-related necrosis. (j) Proton MR spectroscopy (point-resolved spectroscopy, 2000/135) shows interval marked decrease in choline peak at 3.2 ppm (arrow), now very close to baseline noise level, also indicating that treatment-related necrosis has occurred. (k) Coronal contrast-enhanced MR image obtained at perfusion imaging (TWIST, 3.4/1.2) 20 seconds after contrast agent administration shows little if any arterial enhancement in the lesion, a substantial difference compared with the pretreatment image. (l) Coronal delayed contrast-enhanced MR image (volumetric interpolated breath-hold examination, 4.1/1.5), obtained by subtracting unenhanced from contrast-enhanced images, now shows evidence of heterogeneous enhancement in the lesion. Final histologic examination after surgical resection revealed 90% treatment-related sclerosis, 5% necrosis, and 5% viable tumor. In this case, contrast enhancement represents, in part, treatment-related sclerosis (scar tissue) rather than viable tumor, but these two entities are indistinguishable on delayed contrast-enhanced studies, underscoring the need for perfusion examination when attempting to evaluate treatment response.
Figure 2b:
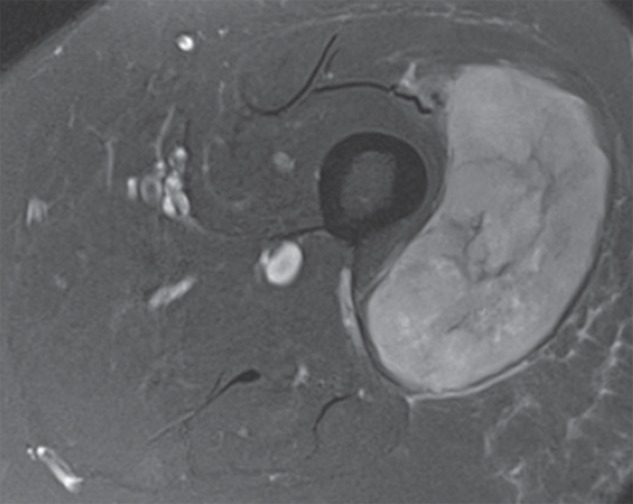
Pleomorphic rhabdomyosarcoma in an 81-year-old woman. Images were obtained (a–f) before and (g–l) after chemotherapy. (a) Axial T1-weighted MR image (466/16) shows lesion as fairly isointense to skeletal muscle with relatively subtle loss of normal muscle architecture. (b) Axial fat-suppressed T2-weighted MR image (3380/60) shows lesion to better advantage with good contrast resolution between mass and surrounding muscle. (c) ADC map shows low signal intensity in the mass and a range of ADCs from 0.9–1.1 × 10⁻³ mm2/sec. (d) Proton MR spectroscopy (point-resolved spectroscopy, 2000/135) shows discrete choline peak at 3.2 ppm (arrow). (e) Axial contrast-enhanced MR image obtained at perfusion imaging (TWIST, 3.4/1.2) 20 seconds after contrast agent administration shows avid early arterial enhancement in the lesion, in keeping with its malignant nature. (f) Coronal delayed contrast-enhanced MR image (volumetric interpolated breath-hold examination, 4.1/1.5) obtained by subtracting nonenhanced from contrast-enhanced images shows enhancement throughout the mass. This sequence, in addition to the T1-weighted and fluid-sensitive sequences, also provides a good anatomic image for evaluating the lesion and its relationship to adjacent structures. Pleomorphic rhabdomyosarcoma in an 81-year-old woman. Images were obtained (a–f) before and (g–l) after chemotherapy. (g) Axial T1-weighted MR image (466/16) shows that lesion remains subtle although decreased in size and of slightly altered signal intensity compared with its pretreatment appearance, now having slightly increased signal intensity relative to that of skeletal muscle. (h) Axial fat-suppressed T2-weighted MR image (3380/60) again shows interval decrease in size of the mass, now with more heterogeneous signal intensity, as compared with pretreatment image. Signal intensity changes after treatment are often identified and are not contributory toward interpretation of whether tumor has undergone treatment-related necrosis. (i) ADC map shows increased signal intensity with range of ADCs of 1.6–2.2 × 10⁻³ mm2/sec., a substantial difference compared with pretreatment images, suggesting interval treatment-related necrosis. (j) Proton MR spectroscopy (point-resolved spectroscopy, 2000/135) shows interval marked decrease in choline peak at 3.2 ppm (arrow), now very close to baseline noise level, also indicating that treatment-related necrosis has occurred. (k) Coronal contrast-enhanced MR image obtained at perfusion imaging (TWIST, 3.4/1.2) 20 seconds after contrast agent administration shows little if any arterial enhancement in the lesion, a substantial difference compared with the pretreatment image. (l) Coronal delayed contrast-enhanced MR image (volumetric interpolated breath-hold examination, 4.1/1.5), obtained by subtracting unenhanced from contrast-enhanced images, now shows evidence of heterogeneous enhancement in the lesion. Final histologic examination after surgical resection revealed 90% treatment-related sclerosis, 5% necrosis, and 5% viable tumor. In this case, contrast enhancement represents, in part, treatment-related sclerosis (scar tissue) rather than viable tumor, but these two entities are indistinguishable on delayed contrast-enhanced studies, underscoring the need for perfusion examination when attempting to evaluate treatment response.
Figure 2d:
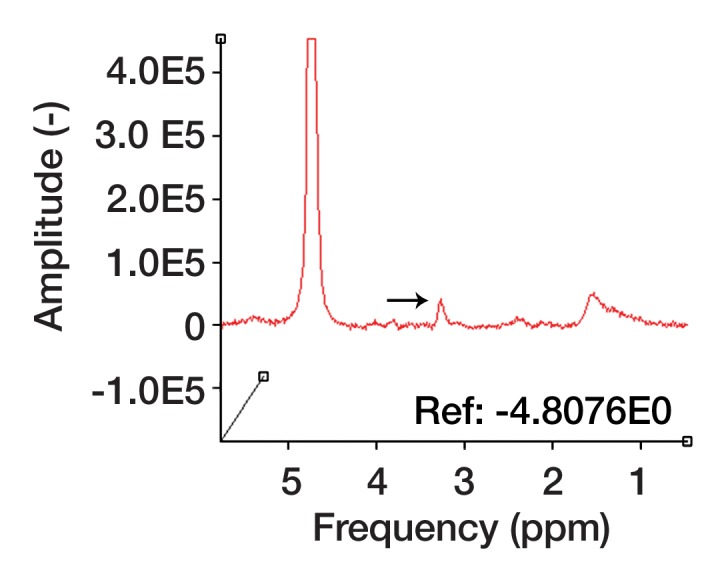
Pleomorphic rhabdomyosarcoma in an 81-year-old woman. Images were obtained (a–f) before and (g–l) after chemotherapy. (a) Axial T1-weighted MR image (466/16) shows lesion as fairly isointense to skeletal muscle with relatively subtle loss of normal muscle architecture. (b) Axial fat-suppressed T2-weighted MR image (3380/60) shows lesion to better advantage with good contrast resolution between mass and surrounding muscle. (c) ADC map shows low signal intensity in the mass and a range of ADCs from 0.9–1.1 × 10⁻³ mm2/sec. (d) Proton MR spectroscopy (point-resolved spectroscopy, 2000/135) shows discrete choline peak at 3.2 ppm (arrow). (e) Axial contrast-enhanced MR image obtained at perfusion imaging (TWIST, 3.4/1.2) 20 seconds after contrast agent administration shows avid early arterial enhancement in the lesion, in keeping with its malignant nature. (f) Coronal delayed contrast-enhanced MR image (volumetric interpolated breath-hold examination, 4.1/1.5) obtained by subtracting nonenhanced from contrast-enhanced images shows enhancement throughout the mass. This sequence, in addition to the T1-weighted and fluid-sensitive sequences, also provides a good anatomic image for evaluating the lesion and its relationship to adjacent structures. Pleomorphic rhabdomyosarcoma in an 81-year-old woman. Images were obtained (a–f) before and (g–l) after chemotherapy. (g) Axial T1-weighted MR image (466/16) shows that lesion remains subtle although decreased in size and of slightly altered signal intensity compared with its pretreatment appearance, now having slightly increased signal intensity relative to that of skeletal muscle. (h) Axial fat-suppressed T2-weighted MR image (3380/60) again shows interval decrease in size of the mass, now with more heterogeneous signal intensity, as compared with pretreatment image. Signal intensity changes after treatment are often identified and are not contributory toward interpretation of whether tumor has undergone treatment-related necrosis. (i) ADC map shows increased signal intensity with range of ADCs of 1.6–2.2 × 10⁻³ mm2/sec., a substantial difference compared with pretreatment images, suggesting interval treatment-related necrosis. (j) Proton MR spectroscopy (point-resolved spectroscopy, 2000/135) shows interval marked decrease in choline peak at 3.2 ppm (arrow), now very close to baseline noise level, also indicating that treatment-related necrosis has occurred. (k) Coronal contrast-enhanced MR image obtained at perfusion imaging (TWIST, 3.4/1.2) 20 seconds after contrast agent administration shows little if any arterial enhancement in the lesion, a substantial difference compared with the pretreatment image. (l) Coronal delayed contrast-enhanced MR image (volumetric interpolated breath-hold examination, 4.1/1.5), obtained by subtracting unenhanced from contrast-enhanced images, now shows evidence of heterogeneous enhancement in the lesion. Final histologic examination after surgical resection revealed 90% treatment-related sclerosis, 5% necrosis, and 5% viable tumor. In this case, contrast enhancement represents, in part, treatment-related sclerosis (scar tissue) rather than viable tumor, but these two entities are indistinguishable on delayed contrast-enhanced studies, underscoring the need for perfusion examination when attempting to evaluate treatment response.
Figure 2g:
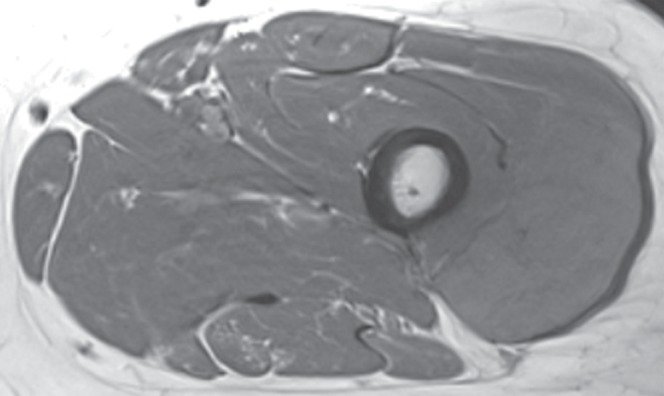
Pleomorphic rhabdomyosarcoma in an 81-year-old woman. Images were obtained (a–f) before and (g–l) after chemotherapy. (a) Axial T1-weighted MR image (466/16) shows lesion as fairly isointense to skeletal muscle with relatively subtle loss of normal muscle architecture. (b) Axial fat-suppressed T2-weighted MR image (3380/60) shows lesion to better advantage with good contrast resolution between mass and surrounding muscle. (c) ADC map shows low signal intensity in the mass and a range of ADCs from 0.9–1.1 × 10⁻³ mm2/sec. (d) Proton MR spectroscopy (point-resolved spectroscopy, 2000/135) shows discrete choline peak at 3.2 ppm (arrow). (e) Axial contrast-enhanced MR image obtained at perfusion imaging (TWIST, 3.4/1.2) 20 seconds after contrast agent administration shows avid early arterial enhancement in the lesion, in keeping with its malignant nature. (f) Coronal delayed contrast-enhanced MR image (volumetric interpolated breath-hold examination, 4.1/1.5) obtained by subtracting nonenhanced from contrast-enhanced images shows enhancement throughout the mass. This sequence, in addition to the T1-weighted and fluid-sensitive sequences, also provides a good anatomic image for evaluating the lesion and its relationship to adjacent structures. Pleomorphic rhabdomyosarcoma in an 81-year-old woman. Images were obtained (a–f) before and (g–l) after chemotherapy. (g) Axial T1-weighted MR image (466/16) shows that lesion remains subtle although decreased in size and of slightly altered signal intensity compared with its pretreatment appearance, now having slightly increased signal intensity relative to that of skeletal muscle. (h) Axial fat-suppressed T2-weighted MR image (3380/60) again shows interval decrease in size of the mass, now with more heterogeneous signal intensity, as compared with pretreatment image. Signal intensity changes after treatment are often identified and are not contributory toward interpretation of whether tumor has undergone treatment-related necrosis. (i) ADC map shows increased signal intensity with range of ADCs of 1.6–2.2 × 10⁻³ mm2/sec., a substantial difference compared with pretreatment images, suggesting interval treatment-related necrosis. (j) Proton MR spectroscopy (point-resolved spectroscopy, 2000/135) shows interval marked decrease in choline peak at 3.2 ppm (arrow), now very close to baseline noise level, also indicating that treatment-related necrosis has occurred. (k) Coronal contrast-enhanced MR image obtained at perfusion imaging (TWIST, 3.4/1.2) 20 seconds after contrast agent administration shows little if any arterial enhancement in the lesion, a substantial difference compared with the pretreatment image. (l) Coronal delayed contrast-enhanced MR image (volumetric interpolated breath-hold examination, 4.1/1.5), obtained by subtracting unenhanced from contrast-enhanced images, now shows evidence of heterogeneous enhancement in the lesion. Final histologic examination after surgical resection revealed 90% treatment-related sclerosis, 5% necrosis, and 5% viable tumor. In this case, contrast enhancement represents, in part, treatment-related sclerosis (scar tissue) rather than viable tumor, but these two entities are indistinguishable on delayed contrast-enhanced studies, underscoring the need for perfusion examination when attempting to evaluate treatment response.
Figure 2h:
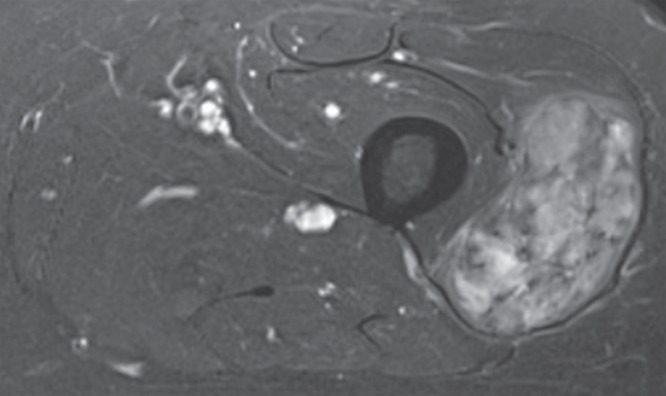
Pleomorphic rhabdomyosarcoma in an 81-year-old woman. Images were obtained (a–f) before and (g–l) after chemotherapy. (a) Axial T1-weighted MR image (466/16) shows lesion as fairly isointense to skeletal muscle with relatively subtle loss of normal muscle architecture. (b) Axial fat-suppressed T2-weighted MR image (3380/60) shows lesion to better advantage with good contrast resolution between mass and surrounding muscle. (c) ADC map shows low signal intensity in the mass and a range of ADCs from 0.9–1.1 × 10⁻³ mm2/sec. (d) Proton MR spectroscopy (point-resolved spectroscopy, 2000/135) shows discrete choline peak at 3.2 ppm (arrow). (e) Axial contrast-enhanced MR image obtained at perfusion imaging (TWIST, 3.4/1.2) 20 seconds after contrast agent administration shows avid early arterial enhancement in the lesion, in keeping with its malignant nature. (f) Coronal delayed contrast-enhanced MR image (volumetric interpolated breath-hold examination, 4.1/1.5) obtained by subtracting nonenhanced from contrast-enhanced images shows enhancement throughout the mass. This sequence, in addition to the T1-weighted and fluid-sensitive sequences, also provides a good anatomic image for evaluating the lesion and its relationship to adjacent structures. Pleomorphic rhabdomyosarcoma in an 81-year-old woman. Images were obtained (a–f) before and (g–l) after chemotherapy. (g) Axial T1-weighted MR image (466/16) shows that lesion remains subtle although decreased in size and of slightly altered signal intensity compared with its pretreatment appearance, now having slightly increased signal intensity relative to that of skeletal muscle. (h) Axial fat-suppressed T2-weighted MR image (3380/60) again shows interval decrease in size of the mass, now with more heterogeneous signal intensity, as compared with pretreatment image. Signal intensity changes after treatment are often identified and are not contributory toward interpretation of whether tumor has undergone treatment-related necrosis. (i) ADC map shows increased signal intensity with range of ADCs of 1.6–2.2 × 10⁻³ mm2/sec., a substantial difference compared with pretreatment images, suggesting interval treatment-related necrosis. (j) Proton MR spectroscopy (point-resolved spectroscopy, 2000/135) shows interval marked decrease in choline peak at 3.2 ppm (arrow), now very close to baseline noise level, also indicating that treatment-related necrosis has occurred. (k) Coronal contrast-enhanced MR image obtained at perfusion imaging (TWIST, 3.4/1.2) 20 seconds after contrast agent administration shows little if any arterial enhancement in the lesion, a substantial difference compared with the pretreatment image. (l) Coronal delayed contrast-enhanced MR image (volumetric interpolated breath-hold examination, 4.1/1.5), obtained by subtracting unenhanced from contrast-enhanced images, now shows evidence of heterogeneous enhancement in the lesion. Final histologic examination after surgical resection revealed 90% treatment-related sclerosis, 5% necrosis, and 5% viable tumor. In this case, contrast enhancement represents, in part, treatment-related sclerosis (scar tissue) rather than viable tumor, but these two entities are indistinguishable on delayed contrast-enhanced studies, underscoring the need for perfusion examination when attempting to evaluate treatment response.
Figure 2j:
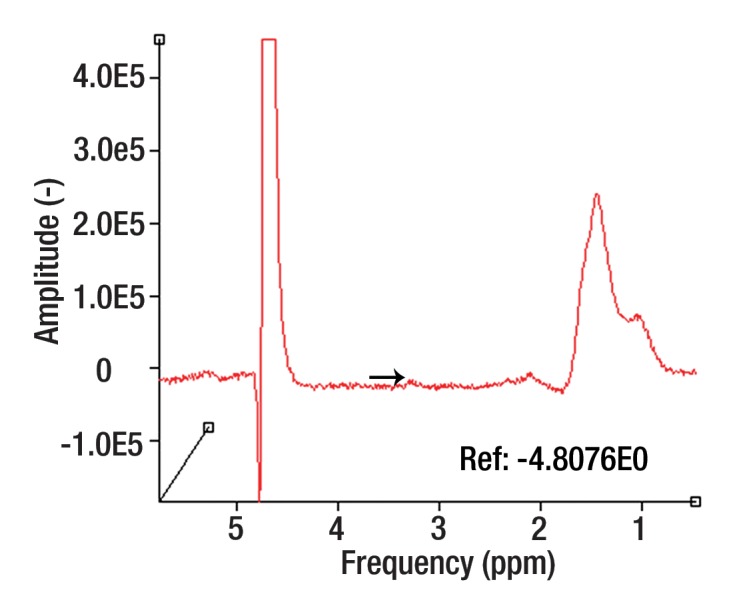
Pleomorphic rhabdomyosarcoma in an 81-year-old woman. Images were obtained (a–f) before and (g–l) after chemotherapy. (a) Axial T1-weighted MR image (466/16) shows lesion as fairly isointense to skeletal muscle with relatively subtle loss of normal muscle architecture. (b) Axial fat-suppressed T2-weighted MR image (3380/60) shows lesion to better advantage with good contrast resolution between mass and surrounding muscle. (c) ADC map shows low signal intensity in the mass and a range of ADCs from 0.9–1.1 × 10⁻³ mm2/sec. (d) Proton MR spectroscopy (point-resolved spectroscopy, 2000/135) shows discrete choline peak at 3.2 ppm (arrow). (e) Axial contrast-enhanced MR image obtained at perfusion imaging (TWIST, 3.4/1.2) 20 seconds after contrast agent administration shows avid early arterial enhancement in the lesion, in keeping with its malignant nature. (f) Coronal delayed contrast-enhanced MR image (volumetric interpolated breath-hold examination, 4.1/1.5) obtained by subtracting nonenhanced from contrast-enhanced images shows enhancement throughout the mass. This sequence, in addition to the T1-weighted and fluid-sensitive sequences, also provides a good anatomic image for evaluating the lesion and its relationship to adjacent structures. Pleomorphic rhabdomyosarcoma in an 81-year-old woman. Images were obtained (a–f) before and (g–l) after chemotherapy. (g) Axial T1-weighted MR image (466/16) shows that lesion remains subtle although decreased in size and of slightly altered signal intensity compared with its pretreatment appearance, now having slightly increased signal intensity relative to that of skeletal muscle. (h) Axial fat-suppressed T2-weighted MR image (3380/60) again shows interval decrease in size of the mass, now with more heterogeneous signal intensity, as compared with pretreatment image. Signal intensity changes after treatment are often identified and are not contributory toward interpretation of whether tumor has undergone treatment-related necrosis. (i) ADC map shows increased signal intensity with range of ADCs of 1.6–2.2 × 10⁻³ mm2/sec., a substantial difference compared with pretreatment images, suggesting interval treatment-related necrosis. (j) Proton MR spectroscopy (point-resolved spectroscopy, 2000/135) shows interval marked decrease in choline peak at 3.2 ppm (arrow), now very close to baseline noise level, also indicating that treatment-related necrosis has occurred. (k) Coronal contrast-enhanced MR image obtained at perfusion imaging (TWIST, 3.4/1.2) 20 seconds after contrast agent administration shows little if any arterial enhancement in the lesion, a substantial difference compared with the pretreatment image. (l) Coronal delayed contrast-enhanced MR image (volumetric interpolated breath-hold examination, 4.1/1.5), obtained by subtracting unenhanced from contrast-enhanced images, now shows evidence of heterogeneous enhancement in the lesion. Final histologic examination after surgical resection revealed 90% treatment-related sclerosis, 5% necrosis, and 5% viable tumor. In this case, contrast enhancement represents, in part, treatment-related sclerosis (scar tissue) rather than viable tumor, but these two entities are indistinguishable on delayed contrast-enhanced studies, underscoring the need for perfusion examination when attempting to evaluate treatment response.
Figure 2k:
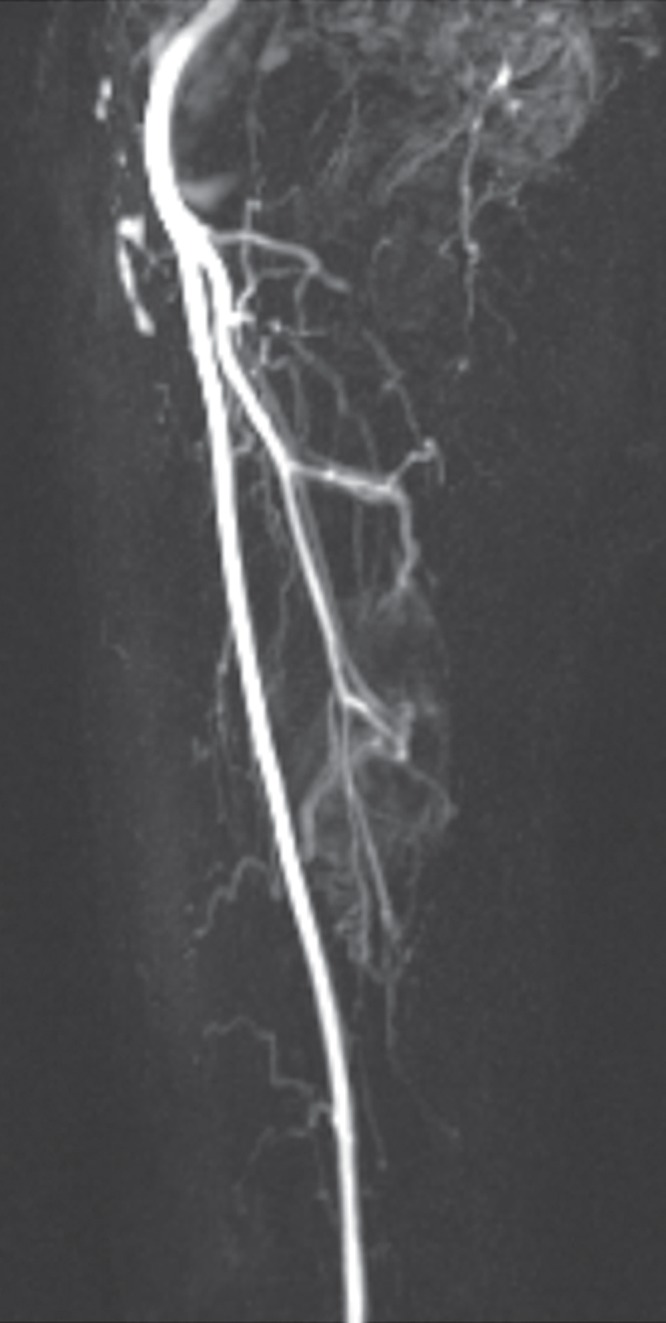
Pleomorphic rhabdomyosarcoma in an 81-year-old woman. Images were obtained (a–f) before and (g–l) after chemotherapy. (a) Axial T1-weighted MR image (466/16) shows lesion as fairly isointense to skeletal muscle with relatively subtle loss of normal muscle architecture. (b) Axial fat-suppressed T2-weighted MR image (3380/60) shows lesion to better advantage with good contrast resolution between mass and surrounding muscle. (c) ADC map shows low signal intensity in the mass and a range of ADCs from 0.9–1.1 × 10⁻³ mm2/sec. (d) Proton MR spectroscopy (point-resolved spectroscopy, 2000/135) shows discrete choline peak at 3.2 ppm (arrow). (e) Axial contrast-enhanced MR image obtained at perfusion imaging (TWIST, 3.4/1.2) 20 seconds after contrast agent administration shows avid early arterial enhancement in the lesion, in keeping with its malignant nature. (f) Coronal delayed contrast-enhanced MR image (volumetric interpolated breath-hold examination, 4.1/1.5) obtained by subtracting nonenhanced from contrast-enhanced images shows enhancement throughout the mass. This sequence, in addition to the T1-weighted and fluid-sensitive sequences, also provides a good anatomic image for evaluating the lesion and its relationship to adjacent structures. Pleomorphic rhabdomyosarcoma in an 81-year-old woman. Images were obtained (a–f) before and (g–l) after chemotherapy. (g) Axial T1-weighted MR image (466/16) shows that lesion remains subtle although decreased in size and of slightly altered signal intensity compared with its pretreatment appearance, now having slightly increased signal intensity relative to that of skeletal muscle. (h) Axial fat-suppressed T2-weighted MR image (3380/60) again shows interval decrease in size of the mass, now with more heterogeneous signal intensity, as compared with pretreatment image. Signal intensity changes after treatment are often identified and are not contributory toward interpretation of whether tumor has undergone treatment-related necrosis. (i) ADC map shows increased signal intensity with range of ADCs of 1.6–2.2 × 10⁻³ mm2/sec., a substantial difference compared with pretreatment images, suggesting interval treatment-related necrosis. (j) Proton MR spectroscopy (point-resolved spectroscopy, 2000/135) shows interval marked decrease in choline peak at 3.2 ppm (arrow), now very close to baseline noise level, also indicating that treatment-related necrosis has occurred. (k) Coronal contrast-enhanced MR image obtained at perfusion imaging (TWIST, 3.4/1.2) 20 seconds after contrast agent administration shows little if any arterial enhancement in the lesion, a substantial difference compared with the pretreatment image. (l) Coronal delayed contrast-enhanced MR image (volumetric interpolated breath-hold examination, 4.1/1.5), obtained by subtracting unenhanced from contrast-enhanced images, now shows evidence of heterogeneous enhancement in the lesion. Final histologic examination after surgical resection revealed 90% treatment-related sclerosis, 5% necrosis, and 5% viable tumor. In this case, contrast enhancement represents, in part, treatment-related sclerosis (scar tissue) rather than viable tumor, but these two entities are indistinguishable on delayed contrast-enhanced studies, underscoring the need for perfusion examination when attempting to evaluate treatment response.
Chemical Shift Imaging (Anatomic Technique)
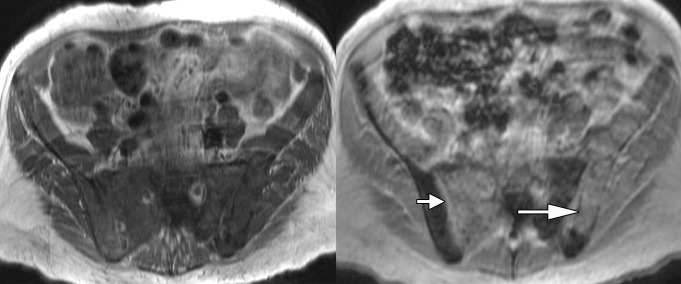
Proton chemical shift MR imaging has been suggested as a valuable addition to a standard MR imaging protocol for the study of the bone marrow in vivo (4,13–16). In the present article, chemical shift imaging refers to in-phase and opposed-phased imaging (acquired with single or separate sequences) (17), although it should be noted that chemical shift imaging is sometimes used to describe spectroscopic imaging as well. In-phase and opposed-phase imaging are based on the principle of separately detecting protons that precess with very similar yet slightly different frequencies—namely, those of water and fat—to identify areas of fatty marrow replacement. When the protons of fat and water are located within the same voxel and are imaged while in phase, they will be responsible for additive signal intensity on the image; but when they are imaged in opposed phase, they will be responsible for a decrease in signal intensity on the image. In bone marrow, therefore, where there is abundant fatty marrow, a marrow-replacing tumor will demonstrate no evidence of decreased signal intensity on the opposed-phase image compared with the in-phase image (Figs 3, 4). Conversely, in a process where fatty marrow is not replaced (such as edema or red marrow mixed with yellow marrow), there will be a decrease in signal intensity on the opposed-phase image as compared with the in-phase image.
Figure 3a:
Anatomic MR images in a 62-year-old man with metastatic disease show value of chemical shift imaging, as compared with delayed contrast-enhanced imaging. (a) Axial gradient-recalled-echo in-phase (left: 10/4.4) and opposed-phase (right: 10/2.2) MR images of the pelvis are shown. There is low signal intensity throughout the pelvic bones on the in-phase image, and it is difficult to distinguish normal hematopoietic marrow in pelvic bones from tumor infiltrating marrow on this image. Opposed-phase image clearly shows there is no decrease in signal intensity in right sacrum (short arrow) and left iliac bone (long arrow), representing areas of metastatic disease. Areas of signal drop-out (in left sacrum and right iliac bone) represent hematopoietic marrow reconversion. (b) Axial static delayed contrast-enhanced fat-suppressed T1-weighted image (10/4.9) obtained 1 minute after injection again shows tumor extent in pelvis (arrows), correlating well with the opposed-phase image.
Figure 4a:
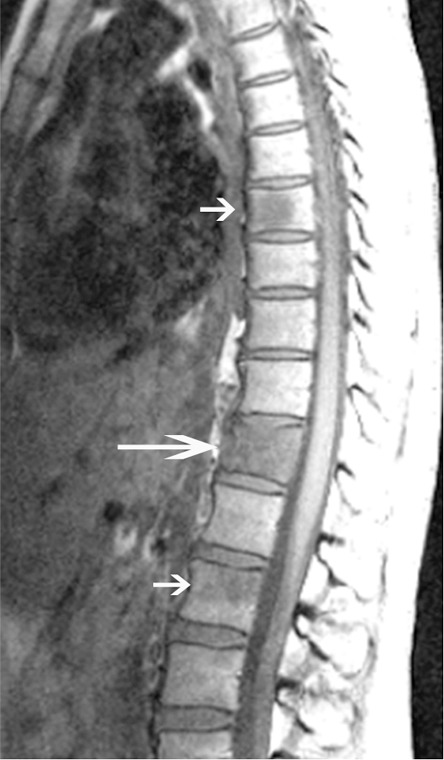
Anatomic MR images in a 40-year-old woman with back pain show added value of chemical shift imaging in confirming neoplastic involvement of the marrow. (a) Sagittal T1-weighted MR image (450/15) shows multiple sites of abnormal signal intensity in the spine (short arrows) with fracture in the midthoracic spine (long arrow). (b) Sagittal gradient-recalled-echo in-phase (left: 10/4.4) and opposed-phase (right: 10/2.2) MR images show obvious areas of marrow-replacement, which were subsequently worked up and proved to be unsuspected metastatic breast cancer. Marrow replacement is identified quantitatively as absence of a notable decrease in signal intensity on opposed-phase, compared with in-phase, images—in this case, a decrease of less than 1%.
Figure 3b:
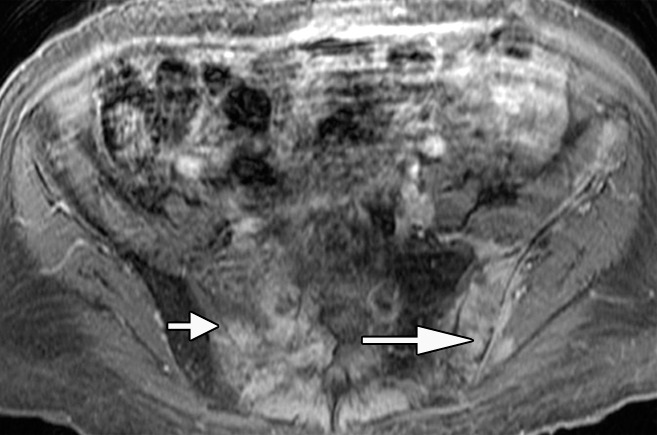
Anatomic MR images in a 62-year-old man with metastatic disease show value of chemical shift imaging, as compared with delayed contrast-enhanced imaging. (a) Axial gradient-recalled-echo in-phase (left: 10/4.4) and opposed-phase (right: 10/2.2) MR images of the pelvis are shown. There is low signal intensity throughout the pelvic bones on the in-phase image, and it is difficult to distinguish normal hematopoietic marrow in pelvic bones from tumor infiltrating marrow on this image. Opposed-phase image clearly shows there is no decrease in signal intensity in right sacrum (short arrow) and left iliac bone (long arrow), representing areas of metastatic disease. Areas of signal drop-out (in left sacrum and right iliac bone) represent hematopoietic marrow reconversion. (b) Axial static delayed contrast-enhanced fat-suppressed T1-weighted image (10/4.9) obtained 1 minute after injection again shows tumor extent in pelvis (arrows), correlating well with the opposed-phase image.
Figure 4b:
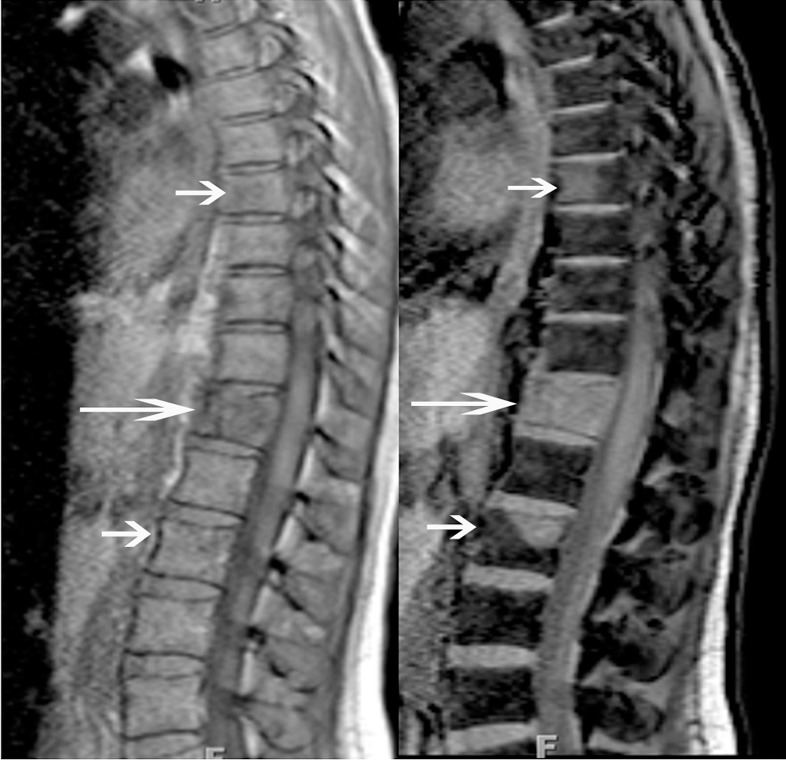
Anatomic MR images in a 40-year-old woman with back pain show added value of chemical shift imaging in confirming neoplastic involvement of the marrow. (a) Sagittal T1-weighted MR image (450/15) shows multiple sites of abnormal signal intensity in the spine (short arrows) with fracture in the midthoracic spine (long arrow). (b) Sagittal gradient-recalled-echo in-phase (left: 10/4.4) and opposed-phase (right: 10/2.2) MR images show obvious areas of marrow-replacement, which were subsequently worked up and proved to be unsuspected metastatic breast cancer. Marrow replacement is identified quantitatively as absence of a notable decrease in signal intensity on opposed-phase, compared with in-phase, images—in this case, a decrease of less than 1%.
There have been a number of reports regarding the utility of distinguishing benign and malignant marrow processes by using chemical shift MR imaging, mainly by distinguishing whether the processes contain fat. According to Zajick et al (4), a 20% decrease in signal intensity on the opposed-phase images relative to that on the in-phase images is a reliable quantitative metric for distinguishing benign from malignant bone marrow in the spine. Other researchers have found similar results (13,16), but caution should be used in interpreting these studies. The utility of chemical shift imaging is likely more important in distinguishing a true marrow-replacing tumor from an infiltrative process such as bone marrow edema, hematopoietic marrow, or other infiltrative lesions rather than for strictly distinguishing benign and malignant bone tumors. Also, one should remember that the voxel of interest must contain both lipid and water; hence, a benign tumor such as a lipoma may show no decrease in signal intensity on the opposed-phase images as compared with that on the in-phase images, even though the neoplasm is benign.
DW Imaging (Functional Technique)
Unlike traditional T1-weighted, fluid-sensitive, and chemical shift imaging, with which signal intensity and morphologic changes are analyzed, DW imaging is a method of functional imaging (18,19). DW imaging measures the brownian motion of water at a microscopic level and is sensitive to changes in the microdiffusion of water within the intracellular and extracellular spaces (20). There is relatively unimpeded water motion in free extracellular water compared with intracellular water (21). Hence, restricted diffusion of water is observed in tumors and has been attributed to the increased cellularity that restricts water motion. As such, DW imaging is a measure of cellularity or cellular integrity (22,23).
Whereas DW imaging has been studied in the central nervous system more extensively, there are reports of its use in the evaluation of musculoskeletal tumors, including the characterization of vertebral fractures for the presence of underlying malignancy (24–26) and the characterization of soft tissue masses as benign or malignant (18,27–32). DW imaging has also been used for characterizing changes in the surgical bed in patients examined for evaluation of the possibility of recurrent tumor (23). Furthermore, DW imaging is well suited to the study of a sarcoma after neoadjuvant therapy to determine whether treatment-related necrosis has occurred in a tumor (19,22,33–45). Where cytotoxic edema develops (eg, in areas of treatment-related necrosis with changes to the dependent sodium-potassium pumps across the cell membrane), there will be increased water mobility, as compared with areas where tumor cellularity is maintained (eg, nonresponsive tumors) (46).
With a DW sequence, water diffusivity is measured by applying diffusion sensitizing gradients to T2-weighted sequences; DW images are interpreted by measuring the signal intensity decrease, which is proportional to the free motion of water molecules, with qualitative and quantitative analyses. For a qualitative analysis, viable malignant tissue shows little loss of signal intensity on DW images obtained with successively heavier diffusion weighting, whereas benign tissues or malignant tissues that have undergone necrosis lose their signal intensity with successively heavier diffusion weighting.
However, one of the best known pitfalls of DW imaging is in relying on a qualitative assessment of the signal intensity in a tumor. It is well known that the appearance of a tumor can be of similar intensity to fluid (so-called T2 shine through) on T2-weighted images. As such, it is essential to correlate qualitative findings with ADC maps, which provide a quantitative assessment of the diffusivity of the lesion. ADC quantifies the combined effects of diffusion and capillary perfusion and provides a measure of the flow and distance a water molecule moves in a tissue of interest. Hence, ADC is an established marker of tumor density or cellularity, such that a highly cellular region will have a low ADC (restricted water motion) and a poorly cellular region will exhibit a high ADC (unrestricted water motion). ADC is calculated from tumor signal intensities acquired with different diffusion weightings (represented by b values). When visualizing an ADC map, an area containing high ADCs will have increased signal intensity, whereas an area containing low ADCs will have correspondingly low signal intensity. Three diffusion weightings are used in our practice: b values of 50, 400, and 800 sec/mm2, which help ensure an accurate ADC measurement.
ADC mapping has been explored for the differentiation of benign from malignant lesions in the musculoskeletal system by exploiting potential differences in cellularity between benign and malignant abnormalities (47). In addition, after any event that has caused a change in the amount of water within a tissue, such as may be due to tumor growth, neovascularity, or tumor necrosis (19), changes in signal intensity on the DW images are naturally expected (Fig 2c, 2i). In fact, in the brain, changes on the DW images are visible before they can be seen on a T2-weighted image (48). Thus, although not fully established in the current literature at this time, there is a suggestion that DW imaging with ADC mapping can impart valuable information when attempting to assess a musculoskeletal tumor, especially when assessing for change after treatment (18,23,39).
Figure 2c:
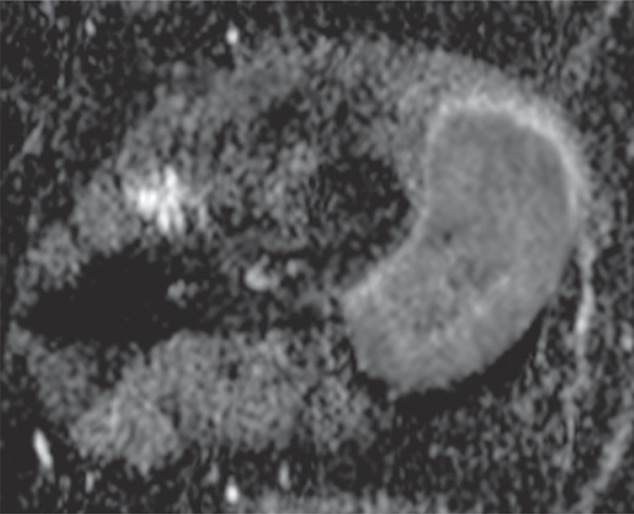
Pleomorphic rhabdomyosarcoma in an 81-year-old woman. Images were obtained (a–f) before and (g–l) after chemotherapy. (a) Axial T1-weighted MR image (466/16) shows lesion as fairly isointense to skeletal muscle with relatively subtle loss of normal muscle architecture. (b) Axial fat-suppressed T2-weighted MR image (3380/60) shows lesion to better advantage with good contrast resolution between mass and surrounding muscle. (c) ADC map shows low signal intensity in the mass and a range of ADCs from 0.9–1.1 × 10⁻³ mm2/sec. (d) Proton MR spectroscopy (point-resolved spectroscopy, 2000/135) shows discrete choline peak at 3.2 ppm (arrow). (e) Axial contrast-enhanced MR image obtained at perfusion imaging (TWIST, 3.4/1.2) 20 seconds after contrast agent administration shows avid early arterial enhancement in the lesion, in keeping with its malignant nature. (f) Coronal delayed contrast-enhanced MR image (volumetric interpolated breath-hold examination, 4.1/1.5) obtained by subtracting nonenhanced from contrast-enhanced images shows enhancement throughout the mass. This sequence, in addition to the T1-weighted and fluid-sensitive sequences, also provides a good anatomic image for evaluating the lesion and its relationship to adjacent structures. Pleomorphic rhabdomyosarcoma in an 81-year-old woman. Images were obtained (a–f) before and (g–l) after chemotherapy. (g) Axial T1-weighted MR image (466/16) shows that lesion remains subtle although decreased in size and of slightly altered signal intensity compared with its pretreatment appearance, now having slightly increased signal intensity relative to that of skeletal muscle. (h) Axial fat-suppressed T2-weighted MR image (3380/60) again shows interval decrease in size of the mass, now with more heterogeneous signal intensity, as compared with pretreatment image. Signal intensity changes after treatment are often identified and are not contributory toward interpretation of whether tumor has undergone treatment-related necrosis. (i) ADC map shows increased signal intensity with range of ADCs of 1.6–2.2 × 10⁻³ mm2/sec., a substantial difference compared with pretreatment images, suggesting interval treatment-related necrosis. (j) Proton MR spectroscopy (point-resolved spectroscopy, 2000/135) shows interval marked decrease in choline peak at 3.2 ppm (arrow), now very close to baseline noise level, also indicating that treatment-related necrosis has occurred. (k) Coronal contrast-enhanced MR image obtained at perfusion imaging (TWIST, 3.4/1.2) 20 seconds after contrast agent administration shows little if any arterial enhancement in the lesion, a substantial difference compared with the pretreatment image. (l) Coronal delayed contrast-enhanced MR image (volumetric interpolated breath-hold examination, 4.1/1.5), obtained by subtracting unenhanced from contrast-enhanced images, now shows evidence of heterogeneous enhancement in the lesion. Final histologic examination after surgical resection revealed 90% treatment-related sclerosis, 5% necrosis, and 5% viable tumor. In this case, contrast enhancement represents, in part, treatment-related sclerosis (scar tissue) rather than viable tumor, but these two entities are indistinguishable on delayed contrast-enhanced studies, underscoring the need for perfusion examination when attempting to evaluate treatment response.
Figure 2i:
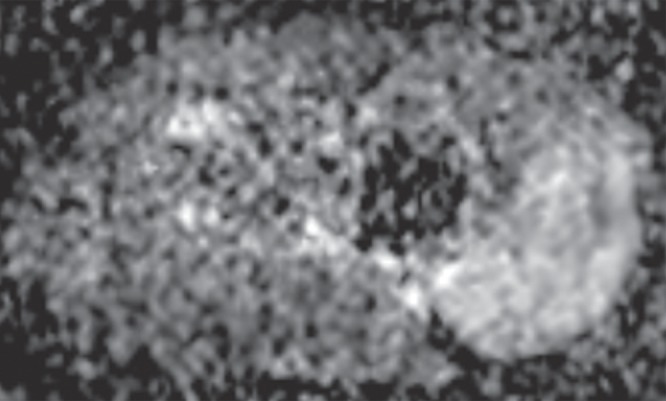
Pleomorphic rhabdomyosarcoma in an 81-year-old woman. Images were obtained (a–f) before and (g–l) after chemotherapy. (a) Axial T1-weighted MR image (466/16) shows lesion as fairly isointense to skeletal muscle with relatively subtle loss of normal muscle architecture. (b) Axial fat-suppressed T2-weighted MR image (3380/60) shows lesion to better advantage with good contrast resolution between mass and surrounding muscle. (c) ADC map shows low signal intensity in the mass and a range of ADCs from 0.9–1.1 × 10⁻³ mm2/sec. (d) Proton MR spectroscopy (point-resolved spectroscopy, 2000/135) shows discrete choline peak at 3.2 ppm (arrow). (e) Axial contrast-enhanced MR image obtained at perfusion imaging (TWIST, 3.4/1.2) 20 seconds after contrast agent administration shows avid early arterial enhancement in the lesion, in keeping with its malignant nature. (f) Coronal delayed contrast-enhanced MR image (volumetric interpolated breath-hold examination, 4.1/1.5) obtained by subtracting nonenhanced from contrast-enhanced images shows enhancement throughout the mass. This sequence, in addition to the T1-weighted and fluid-sensitive sequences, also provides a good anatomic image for evaluating the lesion and its relationship to adjacent structures. Pleomorphic rhabdomyosarcoma in an 81-year-old woman. Images were obtained (a–f) before and (g–l) after chemotherapy. (g) Axial T1-weighted MR image (466/16) shows that lesion remains subtle although decreased in size and of slightly altered signal intensity compared with its pretreatment appearance, now having slightly increased signal intensity relative to that of skeletal muscle. (h) Axial fat-suppressed T2-weighted MR image (3380/60) again shows interval decrease in size of the mass, now with more heterogeneous signal intensity, as compared with pretreatment image. Signal intensity changes after treatment are often identified and are not contributory toward interpretation of whether tumor has undergone treatment-related necrosis. (i) ADC map shows increased signal intensity with range of ADCs of 1.6–2.2 × 10⁻³ mm2/sec., a substantial difference compared with pretreatment images, suggesting interval treatment-related necrosis. (j) Proton MR spectroscopy (point-resolved spectroscopy, 2000/135) shows interval marked decrease in choline peak at 3.2 ppm (arrow), now very close to baseline noise level, also indicating that treatment-related necrosis has occurred. (k) Coronal contrast-enhanced MR image obtained at perfusion imaging (TWIST, 3.4/1.2) 20 seconds after contrast agent administration shows little if any arterial enhancement in the lesion, a substantial difference compared with the pretreatment image. (l) Coronal delayed contrast-enhanced MR image (volumetric interpolated breath-hold examination, 4.1/1.5), obtained by subtracting unenhanced from contrast-enhanced images, now shows evidence of heterogeneous enhancement in the lesion. Final histologic examination after surgical resection revealed 90% treatment-related sclerosis, 5% necrosis, and 5% viable tumor. In this case, contrast enhancement represents, in part, treatment-related sclerosis (scar tissue) rather than viable tumor, but these two entities are indistinguishable on delayed contrast-enhanced studies, underscoring the need for perfusion examination when attempting to evaluate treatment response.
Proton MR Spectroscopy (Metabolic Technique)
Proton MR spectroscopy is a means of molecular characterization of tumors with MR, and, like DW imaging, carries the important advantage that it requires no intravenous contrast medium. Signals of water, lipid, and other metabolites are acquired from a specific region of interest with MR spectroscopy, and the metabolic “footprint” of that region is elucidated. Certain biochemicals that have been established as markers of malignancy may be detected and provide a noninvasive method to help distinguish malignant from nonmalignant tissue. Results from previous studies have suggested that the metabolite choline, a composite spectral resonance consisting of free choline, phosphocholine, and glycerophosphocholine, is elevated in malignant lesions. Choline-containing compounds are constituents of the phospholipid metabolism of cell membranes that reflect cell membrane turnover, a feature of malignancy. Whereas proton MR spectroscopy has been a more routine part of a tumor imaging protocol in the brain, it has recently been explored in the musculoskeletal system (49–59).
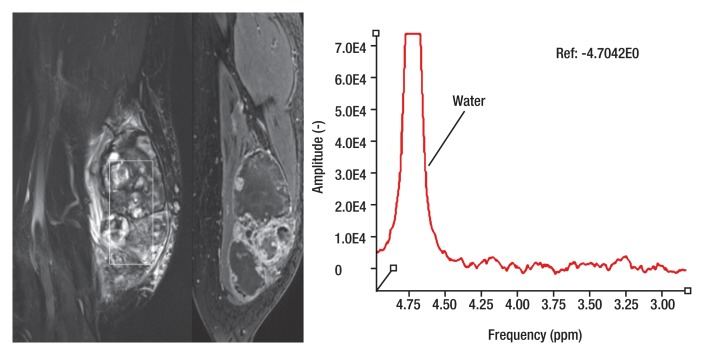
A description of MR spectroscopy techniques along with their challenges and limitations is beyond the scope of this article; however, the literature thus far has supported the use of MR spectroscopy in the characterization of musculoskeletal tumors for malignancy, preferably with quantitative rather than qualitative approaches to the assessment of choline content in a lesion (51,52,54,56–59). The authors of musculoskeletal MR spectroscopy studies have been mostly qualitative in their assessment of choline content, using choline peaks or qualitative ratios (51,52,57–59) rather than absolutely quantitative measurements (53,56), a problem given that choline is elevated in malignant as well as benign tumors (49–59). Because MR spectroscopic measurements are affected by many imaging-related factors, qualitative imaging is limited in its reproducibility and its ability to provide a generalized solution (54). Recent investigations at 3 T (54,56) affirm the benefits of increased signal available with 3-T MR and the feasibility of determining the absolute choline concentration at MR spectroscopy by using a water-referencing method. These studies have shown that choline concentrations are notably different for benign and malignant musculoskeletal lesions, despite obvious limitations with the water-referencing method (notably, unpredictable and variable water content in a voxel of interest). Hence, in our practice, the tumor protocol is implemented at 3 T when possible, primarily to enable optimal assessment of metabolic content with MR spectroscopy. Figure 5 is an example of an indeterminate soft-tissue mass assessed with MR spectroscopy.
Figure 5a:
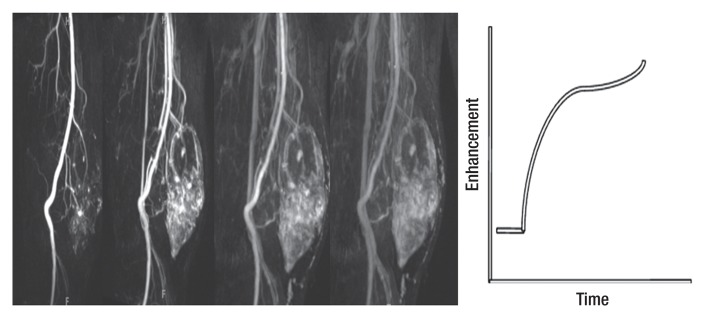
Proton MR spectroscopy and functional imaging in a 61-year-old man with a soft-tissue mass. The patient was referred for biopsy due to suspicious imaging features. (a) Proton MR spectroscopic imaging (point-resolved spectroscopy, 2000/135) with single voxel (rectangular outline) in the heterogeneous mass shown on coronal STIR and contrast-enhanced MR images shows no detectable choline peak. (b) Multiple coronal MR images from a dynamic contrast-enhanced study obtained at 10, 30, 60 and 90 seconds after injection (TWIST, 3.4/1.2) and time-intensity curve show the mass to be markedly heterogeneous with aggressive features, including arterial enhancement. However, the contrast enhancement patterns of benign and malignant lesions can overlap. In this case, negligible choline content at MR spectroscopy was consistent with the histologic diagnosis of benign degenerated cystic schwannoma, which was confirmed after surgical resection.
Figure 5b:
Proton MR spectroscopy and functional imaging in a 61-year-old man with a soft-tissue mass. The patient was referred for biopsy due to suspicious imaging features. (a) Proton MR spectroscopic imaging (point-resolved spectroscopy, 2000/135) with single voxel (rectangular outline) in the heterogeneous mass shown on coronal STIR and contrast-enhanced MR images shows no detectable choline peak. (b) Multiple coronal MR images from a dynamic contrast-enhanced study obtained at 10, 30, 60 and 90 seconds after injection (TWIST, 3.4/1.2) and time-intensity curve show the mass to be markedly heterogeneous with aggressive features, including arterial enhancement. However, the contrast enhancement patterns of benign and malignant lesions can overlap. In this case, negligible choline content at MR spectroscopy was consistent with the histologic diagnosis of benign degenerated cystic schwannoma, which was confirmed after surgical resection.
Perfusion MR Imaging (Functional Technique)
Perfusion imaging sequences are used for providing insight into the vascularity of a tumor and can be accomplished with a variety of pulse sequences, including DW sequences (31), unenhanced perfusion sequences (60,61), and the most commonly implemented dynamic contrast-enhanced sequence (62–80). Perfusion imaging with dynamic contrast-enhanced MR imaging is the most popular technique at this time, since other techniques have not been well explored for musculoskeletal tumors.
Dynamic contrast-enhanced MR imaging is performed with fast (usually volumetric) gradient-echo sequences that are prescribed over a section or volume of interest and repeated several times after intravenous contrast agent administration, to exploit the contrast-enhancement properties of a tumor (81). A gadolinium-based contrast agent is usually injected intravenously at a rate of 2–5 mL/sec, and imaging takes place with a temporal resolution of 5–30 seconds for approximately 3–7 minutes. The temporal resolution chosen for this pulse sequence depends on the need for spatial resolution and field-of-view coverage; as greater spatial resolution or a larger volume of sections is desired, the temporal resolution will be reduced. In our practice, we choose to perform a highly time-resolved MR angiographic sequence known as TWIST (Fig 5). TWIST sequences use a spiral trajectory that acquires k space from the center to the periphery. TWIST relies on partial k-space undersampling, with increased sampling of the center of k space compared with the periphery of k space, which thereby accentuates image contrast rather than fine detail, an advantage when attempting to identify areas of contrast enhancement compared with nonenhancing tissue within a tumor (82,83).
Analysis of a dynamic contrast-enhanced MR imaging study has been accomplished by using a variety of postprocessing methods, typically with the creation of time-intensity curves from a region of interest. At the first pass, tissue microvascularization and perfusion account for any early enhancement. Later, capillary permeability and enhancement of the interstitial space account for the plateau, washout, or postarterial increase in enhancement. Therefore, observation of the pattern of enhancement over time on a time-intensity curve provides insight into the vascular pharmacokinetics of a tumor that can be assessed qualitatively (with characterization of the enhancement pattern) or quantitatively (with calculation of various pharmacokinetic parameters such as the mean arterial slope or the time to peak enhancement) (73,76,77,84). Distinguishing patterns of enhancement that have been associated with benign and malignant musculoskeletal lesions (77,81,84,85), mainly by assessing the first-pass kinetics. Malignant lesions generally show early rapid enhancement (Fig 2e) and higher slopes of arterial enhancement compared with benign lesions, although this pattern is not entirely specific, as shown in Figure 5. The latter was echoed in a report by van Rijswijk et al (77), in which 32 of 67 benign soft tissue-tumors showed rapid arterial enhancement.
Figure 2e:
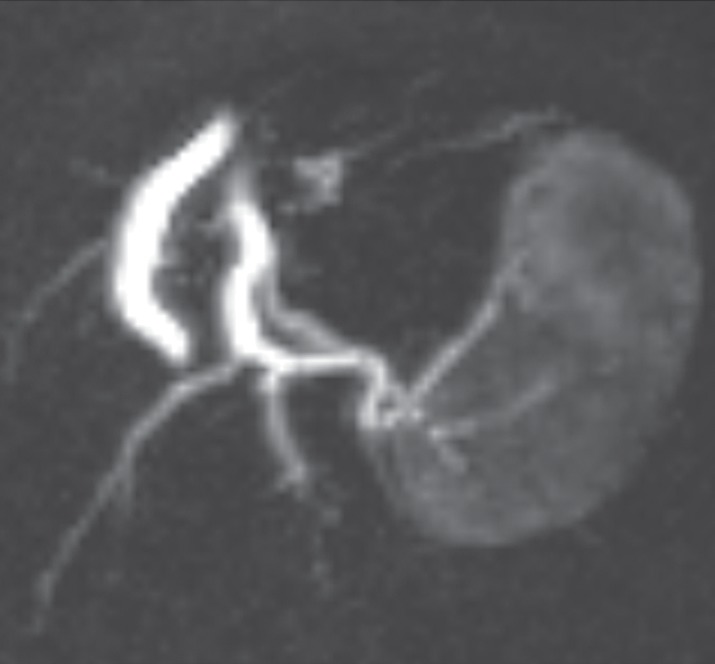
Pleomorphic rhabdomyosarcoma in an 81-year-old woman. Images were obtained (a–f) before and (g–l) after chemotherapy. (a) Axial T1-weighted MR image (466/16) shows lesion as fairly isointense to skeletal muscle with relatively subtle loss of normal muscle architecture. (b) Axial fat-suppressed T2-weighted MR image (3380/60) shows lesion to better advantage with good contrast resolution between mass and surrounding muscle. (c) ADC map shows low signal intensity in the mass and a range of ADCs from 0.9–1.1 × 10⁻³ mm2/sec. (d) Proton MR spectroscopy (point-resolved spectroscopy, 2000/135) shows discrete choline peak at 3.2 ppm (arrow). (e) Axial contrast-enhanced MR image obtained at perfusion imaging (TWIST, 3.4/1.2) 20 seconds after contrast agent administration shows avid early arterial enhancement in the lesion, in keeping with its malignant nature. (f) Coronal delayed contrast-enhanced MR image (volumetric interpolated breath-hold examination, 4.1/1.5) obtained by subtracting nonenhanced from contrast-enhanced images shows enhancement throughout the mass. This sequence, in addition to the T1-weighted and fluid-sensitive sequences, also provides a good anatomic image for evaluating the lesion and its relationship to adjacent structures. Pleomorphic rhabdomyosarcoma in an 81-year-old woman. Images were obtained (a–f) before and (g–l) after chemotherapy. (g) Axial T1-weighted MR image (466/16) shows that lesion remains subtle although decreased in size and of slightly altered signal intensity compared with its pretreatment appearance, now having slightly increased signal intensity relative to that of skeletal muscle. (h) Axial fat-suppressed T2-weighted MR image (3380/60) again shows interval decrease in size of the mass, now with more heterogeneous signal intensity, as compared with pretreatment image. Signal intensity changes after treatment are often identified and are not contributory toward interpretation of whether tumor has undergone treatment-related necrosis. (i) ADC map shows increased signal intensity with range of ADCs of 1.6–2.2 × 10⁻³ mm2/sec., a substantial difference compared with pretreatment images, suggesting interval treatment-related necrosis. (j) Proton MR spectroscopy (point-resolved spectroscopy, 2000/135) shows interval marked decrease in choline peak at 3.2 ppm (arrow), now very close to baseline noise level, also indicating that treatment-related necrosis has occurred. (k) Coronal contrast-enhanced MR image obtained at perfusion imaging (TWIST, 3.4/1.2) 20 seconds after contrast agent administration shows little if any arterial enhancement in the lesion, a substantial difference compared with the pretreatment image. (l) Coronal delayed contrast-enhanced MR image (volumetric interpolated breath-hold examination, 4.1/1.5), obtained by subtracting unenhanced from contrast-enhanced images, now shows evidence of heterogeneous enhancement in the lesion. Final histologic examination after surgical resection revealed 90% treatment-related sclerosis, 5% necrosis, and 5% viable tumor. In this case, contrast enhancement represents, in part, treatment-related sclerosis (scar tissue) rather than viable tumor, but these two entities are indistinguishable on delayed contrast-enhanced studies, underscoring the need for perfusion examination when attempting to evaluate treatment response.
In addition to the analysis of time-intensity curves and enhancement patterns over time, pharmacokinetic modeling approaches to quantifying tumor blood flow, tumor microvasculature, and capillary permeability have been investigated and were shown to be potentially useful (64,86–88), although such an approach has been more extensively studied in other organ systems (89). Specifically, by incorporating the fractional volume of the extracellular extravascular space (ve), the transfer constant characterizing extravasation of gadolinium-containing agents from the plasma (Ktrans) and the transfer constant characterizing reflux of gadopentetate dimeglumine from the extravascular extracellular compartment into the plasma compartment (kep = Ktrans/ve) have been proposed as useful quantitative parameters for the assessment of tumor perfusion (86).
Dynamic contrast-enhanced MR imaging with pharmacokinetic modeling has been hampered by the fact that it is relatively cumbersome and requires postprocessing time; however, with the advent of more advanced and accessible postprocessing software, pharmacokinetic modeling may become a mainstream approach to the assessment of musculoskeletal tumors. In addition, early in its introduction dynamic contrast-enhanced MR imaging had been performed as a single-section technique, rather than as a volumetric acquisition (90). Single-section dynamic contrast-enhanced MR imaging provides data regarding a single section and only a portion of the tumor. Hence, because sarcomas tend to be heterogeneous and large, it has been shown for single-section dynamic contrast-enhanced MR imaging that no significant correlation is present between perfusion parameters and total tumor necrosis in patients who have undergone chemotherapy (73). It is imperative, therefore, that the entire tumor volume be analyzed with regard to perfusion dynamics. As such, a TWIST sequence is used at our institution for dynamic contrast-enhanced MR imaging with a 10-second resolution for 5 minutes. A composite image of the entire imaged volume is constructed that shows the contrast-enhancement pattern of the tumor over time; from these latter data, time-intensity curves may be produced and analyzed.
Delayed Contrast-enhanced T1-weighted MR Imaging (Anatomic Technique)
Following the dynamic perfusion sequence, which yields lower spatial resolution and greater time resolution, performance of a delayed contrast-enhanced fat-suppressed T1-weighted sequence, which produces higher spatial resolution, is advised to obtain a contrast-enhanced anatomic image (Fig 2f, 2l). This can be performed as a spoiled gradient-echo sequence or spin-echo type of sequence, typically with a 3–5 minute delay after contrast agent administration and completion of the perfusion sequence. In our practice, a gradient-echo sequence of isotropic resolution is performed in the coronal plane, and that data set is subsequently reconstructed into the other two planes. Fat suppression is applied to augment contrast between an enhancing tumor and surrounding structures. In addition, subtraction images, which are constructed by subtracting the unenhanced images from the contrast-enhanced images, further maximize contrast between an enhancing tumor and the surrounding tissues.
Figure 2f:
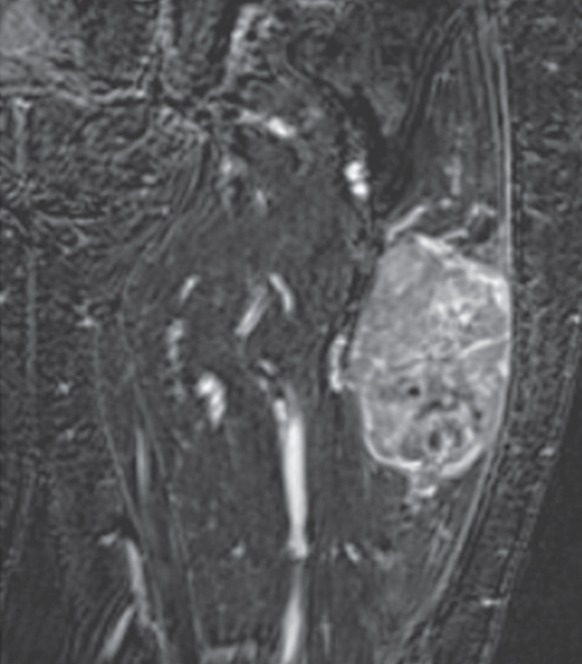
Pleomorphic rhabdomyosarcoma in an 81-year-old woman. Images were obtained (a–f) before and (g–l) after chemotherapy. (a) Axial T1-weighted MR image (466/16) shows lesion as fairly isointense to skeletal muscle with relatively subtle loss of normal muscle architecture. (b) Axial fat-suppressed T2-weighted MR image (3380/60) shows lesion to better advantage with good contrast resolution between mass and surrounding muscle. (c) ADC map shows low signal intensity in the mass and a range of ADCs from 0.9–1.1 × 10⁻³ mm2/sec. (d) Proton MR spectroscopy (point-resolved spectroscopy, 2000/135) shows discrete choline peak at 3.2 ppm (arrow). (e) Axial contrast-enhanced MR image obtained at perfusion imaging (TWIST, 3.4/1.2) 20 seconds after contrast agent administration shows avid early arterial enhancement in the lesion, in keeping with its malignant nature. (f) Coronal delayed contrast-enhanced MR image (volumetric interpolated breath-hold examination, 4.1/1.5) obtained by subtracting nonenhanced from contrast-enhanced images shows enhancement throughout the mass. This sequence, in addition to the T1-weighted and fluid-sensitive sequences, also provides a good anatomic image for evaluating the lesion and its relationship to adjacent structures. Pleomorphic rhabdomyosarcoma in an 81-year-old woman. Images were obtained (a–f) before and (g–l) after chemotherapy. (g) Axial T1-weighted MR image (466/16) shows that lesion remains subtle although decreased in size and of slightly altered signal intensity compared with its pretreatment appearance, now having slightly increased signal intensity relative to that of skeletal muscle. (h) Axial fat-suppressed T2-weighted MR image (3380/60) again shows interval decrease in size of the mass, now with more heterogeneous signal intensity, as compared with pretreatment image. Signal intensity changes after treatment are often identified and are not contributory toward interpretation of whether tumor has undergone treatment-related necrosis. (i) ADC map shows increased signal intensity with range of ADCs of 1.6–2.2 × 10⁻³ mm2/sec., a substantial difference compared with pretreatment images, suggesting interval treatment-related necrosis. (j) Proton MR spectroscopy (point-resolved spectroscopy, 2000/135) shows interval marked decrease in choline peak at 3.2 ppm (arrow), now very close to baseline noise level, also indicating that treatment-related necrosis has occurred. (k) Coronal contrast-enhanced MR image obtained at perfusion imaging (TWIST, 3.4/1.2) 20 seconds after contrast agent administration shows little if any arterial enhancement in the lesion, a substantial difference compared with the pretreatment image. (l) Coronal delayed contrast-enhanced MR image (volumetric interpolated breath-hold examination, 4.1/1.5), obtained by subtracting unenhanced from contrast-enhanced images, now shows evidence of heterogeneous enhancement in the lesion. Final histologic examination after surgical resection revealed 90% treatment-related sclerosis, 5% necrosis, and 5% viable tumor. In this case, contrast enhancement represents, in part, treatment-related sclerosis (scar tissue) rather than viable tumor, but these two entities are indistinguishable on delayed contrast-enhanced studies, underscoring the need for perfusion examination when attempting to evaluate treatment response.
Figure 2l:
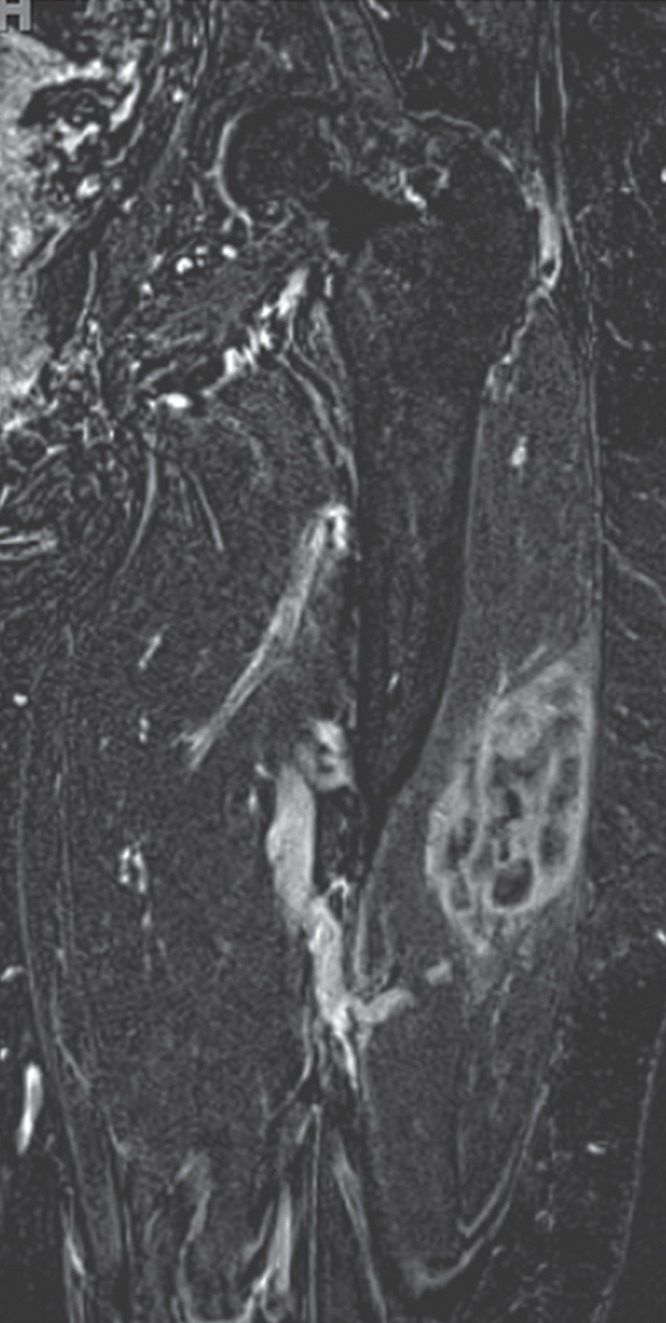
Pleomorphic rhabdomyosarcoma in an 81-year-old woman. Images were obtained (a–f) before and (g–l) after chemotherapy. (a) Axial T1-weighted MR image (466/16) shows lesion as fairly isointense to skeletal muscle with relatively subtle loss of normal muscle architecture. (b) Axial fat-suppressed T2-weighted MR image (3380/60) shows lesion to better advantage with good contrast resolution between mass and surrounding muscle. (c) ADC map shows low signal intensity in the mass and a range of ADCs from 0.9–1.1 × 10⁻³ mm2/sec. (d) Proton MR spectroscopy (point-resolved spectroscopy, 2000/135) shows discrete choline peak at 3.2 ppm (arrow). (e) Axial contrast-enhanced MR image obtained at perfusion imaging (TWIST, 3.4/1.2) 20 seconds after contrast agent administration shows avid early arterial enhancement in the lesion, in keeping with its malignant nature. (f) Coronal delayed contrast-enhanced MR image (volumetric interpolated breath-hold examination, 4.1/1.5) obtained by subtracting nonenhanced from contrast-enhanced images shows enhancement throughout the mass. This sequence, in addition to the T1-weighted and fluid-sensitive sequences, also provides a good anatomic image for evaluating the lesion and its relationship to adjacent structures. Pleomorphic rhabdomyosarcoma in an 81-year-old woman. Images were obtained (a–f) before and (g–l) after chemotherapy. (g) Axial T1-weighted MR image (466/16) shows that lesion remains subtle although decreased in size and of slightly altered signal intensity compared with its pretreatment appearance, now having slightly increased signal intensity relative to that of skeletal muscle. (h) Axial fat-suppressed T2-weighted MR image (3380/60) again shows interval decrease in size of the mass, now with more heterogeneous signal intensity, as compared with pretreatment image. Signal intensity changes after treatment are often identified and are not contributory toward interpretation of whether tumor has undergone treatment-related necrosis. (i) ADC map shows increased signal intensity with range of ADCs of 1.6–2.2 × 10⁻³ mm2/sec., a substantial difference compared with pretreatment images, suggesting interval treatment-related necrosis. (j) Proton MR spectroscopy (point-resolved spectroscopy, 2000/135) shows interval marked decrease in choline peak at 3.2 ppm (arrow), now very close to baseline noise level, also indicating that treatment-related necrosis has occurred. (k) Coronal contrast-enhanced MR image obtained at perfusion imaging (TWIST, 3.4/1.2) 20 seconds after contrast agent administration shows little if any arterial enhancement in the lesion, a substantial difference compared with the pretreatment image. (l) Coronal delayed contrast-enhanced MR image (volumetric interpolated breath-hold examination, 4.1/1.5), obtained by subtracting unenhanced from contrast-enhanced images, now shows evidence of heterogeneous enhancement in the lesion. Final histologic examination after surgical resection revealed 90% treatment-related sclerosis, 5% necrosis, and 5% viable tumor. In this case, contrast enhancement represents, in part, treatment-related sclerosis (scar tissue) rather than viable tumor, but these two entities are indistinguishable on delayed contrast-enhanced studies, underscoring the need for perfusion examination when attempting to evaluate treatment response.
Role of MR Imaging in Musculoskeletal Tumor Evaluation
MR is used for a variety of indications in the evaluation of musculoskeletal tumors. Although, in the authors’ opinion, one of the most important roles for MR is in determining the extent of disease prior to treatment, (by using the anatomic sequences described earlier), detection, characterization, and posttreatment assessment will be discussed. Table 2 summarizes the role of MR in musculoskeletal tumor evaluation.
Table 2.
MR Applications in Musculoskeletal Tumor Evaluation
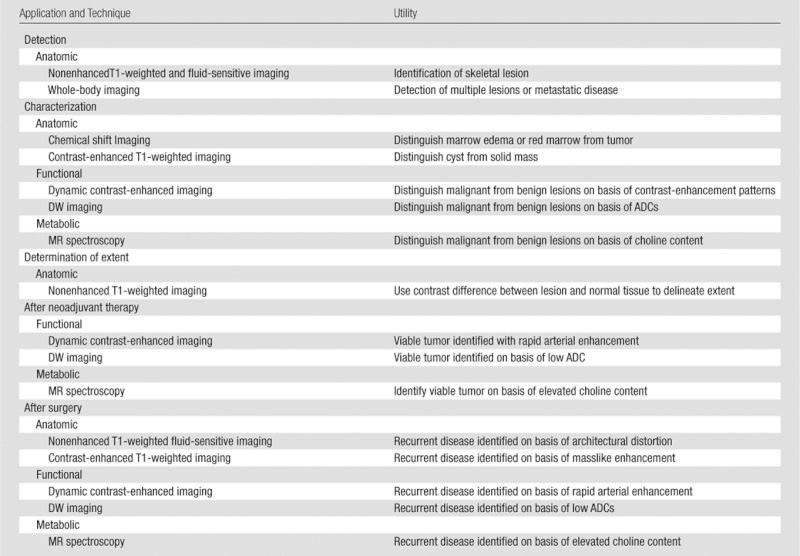
Detection
It is not uncommon for musculoskeletal lesions to be incidentally detected on imaging studies obtained for other reasons. For the purpose of detection of a symptomatic lesion, MR imaging is not typically a first-line test. A soft-tissue mass commonly comes to light because of its palpable nature and is found either by the patient or by the clinician at physical examination. For a bone lesion, bone pain often prompts a visit to the clinician, and a subsequent radiograph will commonly enable detection of the abnormality for the first time. For the axial skeleton, however, in areas such as the sacrum and pelvic bones, lesions may be radiographically occult and are not uncommonly detected for the first time at MR imaging. With the advent of whole-body MR imaging, MR may become a widespread first-line tool for the detection of metastatic disease, and it is currently performed at some centers (Fig 6). Whole-body imaging has been studied as an alternative to bone scintigraphy for the detection of metastatic disease to the skeleton. DW imaging has recently been added to whole-body protocols and has been shown to be equivalent to bone scintigraphy for the purpose of staging (91,92), although, in one study more lesions were detected with whole-body DW imaging than with scintigraphy (92).
Figure 6:

Metastatic breast cancer in 53-year-old woman evaluated with whole-body MR imaging. Coronal whole-body fat-suppressed T2-weighted MR image (5000/87) shows several sites of metastatic disease in the left iliac and acetabular bones (short arrows) and liver (long arrows).
Characterization
After detection of a musculoskeletal lesion, the next step in the management of the lesion is determination of whether the lesion is benign or malignant and, subsequently, whether it should be referred for biopsy to determine its histologic characteristics. Although the clinical features and findings from radiography and other imaging tests certainly play a role in the characterization of a musculoskeletal lesion, MR imaging by itself often lacks adequate specificity. On the basis of results from various studies (2,3,93,94), it is estimated that the ability of MR imaging to characterize lesion histologic characteristics is quite low, often less than 50%. This is especially true when lipomas and cysts are excluded from the analysis (95). Delayed contrast-enhanced MR imaging has been studied for the characterization of lesions, mainly for distinguishing benignity and malignancy, and has shown some promise (85,96). Malignant lesions tend to show arterial phase enhancement, compared with benign lesions. However, in one study, observers were able to improve their ability to characterize lesions for malignancy to only 48% at best (77). This is indeed unfortunate, because patients with benign musculoskeletal masses present to orthopedic clinics 100 times more frequently than do those with malignant lesions (97,98). Even at tertiary care centers, which have centralized sarcoma centers, at least half of biopsies performed on musculoskeletal lesions show a benign origin (99). The latter underscores the inability of current imaging techniques to enable a specific diagnosis, although the decision regarding biopsy of a benign lesion is also based on factors unrelated to the imaging appearance, such as the clinical presentation and anxiety level of the patient.
In a small number of pathologic conditions, the MR features of the lesion on conventional anatomic images are sufficiently specific to allow a histologic diagnosis. For example, simple lipomas are diagnosed by comparing the signal intensity of the lesion on fat-suppressed and non–fat-suppressed images. Cystic lesions, such as soft-tissue ganglia and synovial cysts or bone cysts, which may have variable internal signal intensity on T1-weighted and fluid-sensitive images, are diagnosed on the basis of a lack of contrast enhancement internally. As such, T1- and T2-weighted images are insufficient for diagnosing a cyst. In addition, caution is necessary for apparent “cysts” that contain thick septations or focal nodularity, because these features may indicate malignancy. Necrotic regions within a tumor and hematomas will also demonstrate cystic features. True cysts must have thin rims and simple septations without irregularity or nodularity. For entities such as simple cysts and lipomas, the use of functional and metabolic techniques is not necessary.
However, a lesion is commonly identified at MR imaging but has features on the anatomic images that lack sufficient specificity for enabling a diagnosis. In such cases, there are some general trends to keep in mind with regard to imaging characteristics on anatomic, functional, and metabolic images. First, with conventional unenhanced T1-weighted and fluid-sensitive sequences, the MR features of benign and malignant lesions overlap, although malignant lesions are generally more likely to have a heterogeneous appearance (100).
Second, intravenous contrast material allows the simple differentiation of a cyst from a solid lesion in both the skeleton and the soft tissues. If the lesion fails to enhance after contrast agent administration, it is deemed a cyst; if the lesion enhances with contrast agent administration, it is regarded as a solid lesion. Once again, as with conventional unenhanced anatomic imaging, there is much overlap between enhancement characteristics of benign and malignant lesions, although there are some general rules to apply. Malignant lesions usually enhance heterogeneously with contrast enhancement, show evidence of liquefaction, and enhance early and rapidly in the arterial phase (Fig 2). Because of the latter property, dynamic contrast-enhanced MR imaging is a favored technique to be used in the routine characterization of musculoskeletal tumors but is not performed at all institutions (77,85,96,101,102). The administration of intravenous contrast material is also useful for directing biopsies toward areas of contrast enhancement rather than areas of necrosis.
Third, as already discussed, chemical shift imaging is useful for differentiating a true marrow-replacing tumor from bone marrow edema, hematopoietic marrow, or other infiltrative processes in the skeleton (4,13–16). Chemical shift imaging is most helpful for differentiating benign from malignant fractures in the spine (Fig 4) and can similarly be used in the extremities for differentiating stress fractures from pathologic fractures (103).
Fourth, DW imaging has been used for the purpose of characterization. A number of authors have used DW imaging to distinguish benign and malignant entities (27,30,31,104). For example, Namimomoto et al (29) showed that leiomyomas could be distinguished from leiomyosarcomas on the basis of ADCs, with an ADC of less than 1 × 10⁻³ mm2/sec as a threshold for defining malignancy, although this work refers to soft-tissue tumors in the gynecologic system. Some authors have studied the differentiation of different histologic features of primary malignant lesions (32) and some have suggested that bone masses showing poor contrast enhancement and prolonged T2 can be evaluated with quantitative DW imaging (27). Caution should be exercised, however, when using DW imaging for characterization, because an overlap in the diffusion properties has been identified within benign and malignant soft-tissue tumors (18) and in particular, benign and malignant myxoid lesions (28). In general, the lower the ADC in a lesion, the higher the likelihood of malignancy. It should also be remembered that in a large or heterogeneous mass, multiple regions of interest should be analyzed within the mass to search for areas of lowest ADC (high cellularity).
Finally, MR spectroscopy is an emerging technique that has recently been applied to the characterization of musculoskeletal tumors. A systematic review of the literature in which a pooled analysis of 122 untreated musculoskeletal lesions reported in the literature was analyzed reveals that using the presence of detectable choline within a lesion has a sensitivity of 88% and specificity of 68% for malignancy (51,52,54,56–59), while the use of a quantitative approach to MR spectroscopy results (measurement of choline concentration) carried a specificity between 90% and 100%, depending on the threshold concentration that was used (54,56). At this time, the utility of MR spectroscopy lies with its high negative predictive value: If no choline is detectable in a tumor, it is likely to be benign. And, as various quantitative methods are validated, MR spectroscopy may prove to yield additional specificity for identifying those benign lesions that are metabolically active (with detectable choline levels).
Determination of Extent of Disease
Following characterization of a musculoskeletal tumor as malignant, an important role that MR plays in evaluating musculoskeletal lesions is in the identification of the extent of the tumor prior to surgery. This role is, in fact, easily accomplished with conventional T1-weighted and fluid-sensitive sequences. For bone tumors, as discussed by Vogler and Murphy (105) in 1988, a true T1-weighted sequence is one of the most important sequences needed to help evaluate the bone marrow. Because adult marrow is heavily composed of fat, normal marrow will be of increased signal intensity on T1-weighted images. A tumor is very simply identified by its complete replacement of normal fatty marrow (Fig 1a) which is darker than skeletal muscle. It is quite important to ensure that a true T1 weighted sequence is performed rather than an intermediate-weighted image, which will contain contributions from both T1 and T2 relaxation properties of the lesion and will not optimize contrast between the lesion and normal marrow. In patients with hematopoietic marrow reconversion, as is often seen with smokers, obese patients, and those with anemia, it is helpful to have criteria for distinguishing hematopoietic marrow from tumor infiltration. Hematopoietic marrow is typically ill defined and of higher signal intensity than adjacent skeletal muscle on a true T1-weighted image.
When there is dense hematopoietic marrow reconversion and it is unclear whether a tumor is present in the marrow, a second simple and quick imaging technique, chemical shift imaging, should be performed, which often provides valuable information, as shown in Figure 3. Chemical shift imaging is a fairly reliable means of distinguishing a marrow-replacing lesion from a non–marrow-replacing region and carries a sensitivity of 85%–95% and specificity of 80%–95% for this purpose (4,13,16). One of the main pitfalls of using chemical shift imaging is that it often has a low signal-to-noise ratio as a two-dimensional gradient echo sequence. Hence, it is best used in combination with a T1-weighted spin-echo sequence, which provides a greater signal-to-noise ratio and anatomic detail.
With regard to bone tumors, fluid-sensitive sequences with fat-suppressed T2-weighted imaging or STIR imaging help define periarticular bone marrow edema, periosteal reaction, and extension into the surrounding soft tissues (Fig 1b). This is important for defining how aggressive the lesion is, rather than defining its extent, in our opinion. As already discussed, for soft-tissue tumors the fluid-sensitive sequences frequently allow the lesion to become more conspicuous.
Figure 1b:
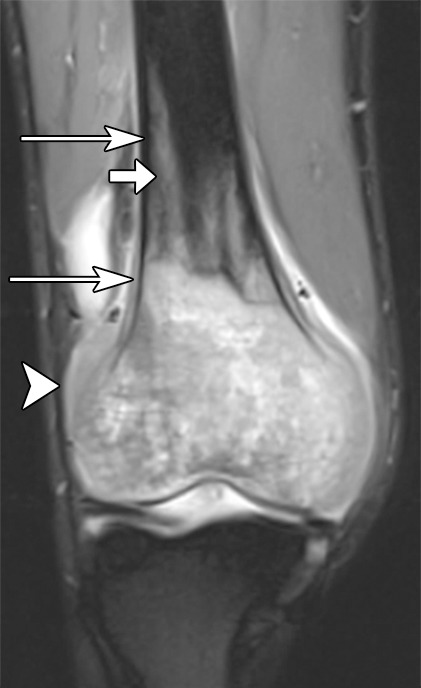
Osteosarcoma of the right femur in a 15-year-old girl. (a) Sagittal T1-weighted MR image (370/10) shows complete replacement of normal fatty marrow signal intensity involving epiphysis and distal metadiaphysis of the right femur. Images obtained with nonenhanced T1-weighted sequence best depict contrast between marrow-replacing tumor and normal fatty marrow for accurately defining extent of the lesion. (b) Coronal fat-suppressed T2-weighted MR image (4000/66) shows perilesional bone marrow edema (short arrow), periosteal reaction (long arrows), and extension of tumor into adjacent soft tissues (arrowhead).
For soft-tissue tumors or those with soft-tissue extension, contrast material is routinely administered, although primarily for characterization purposes (to help distinguish cystic from solid soft-tissue lesions) rather than for defining the extent. With unenhanced imaging, encasement of the neurovascular bundle can be identified, although vascular patency is best assessed with contrast-enhanced techniques or angiography sequences.
Posttreatment Assessment
There are two settings in which MR imaging is utilized in the assessment of primary musculoskeletal tumors following treatment. First, after neoadjuvant chemotherapy and/or radiation therapy (before surgery), MR imaging is used to define the extent of the lesion after treatment and to help determine treatment response. Second, MR imaging is used after surgery to distinguish postoperative fibrosis and inflammation from residual or recurrent tumor.
Prediction of Treatment Response Following Neoadjuvant Therapy
The percentage of tumor necrosis seen at histologic examination (after surgical resection) has been shown to be the most reliable factor in predicting treatment response (and ultimately patient survival and risk of local recurrence) in patients with sarcoma. For bone sarcomas, the relationship between histologic necrosis and outcome has been well established, with necrosis greater than 90%–95% required for a good patient outcome (106,107). For soft-tissue sarcomas, the relationship of histologic tumor necrosis to patient outcome has not been as well explored, although Eilber and colleagues (108,109) have shown a good outcome in patients with 95% necrosis.
Unfortunately, histologic necrosis can only be determined after surgery. As such, it would be beneficial to have a presurgical measure of response with imaging. Predicting treatment response prior to surgery could result in an alteration of the chemotherapy regimen for the patient, a change in the timing of surgery and possibly the extent of surgery. Currently, response is measured by using RECIST (Response Evaluation Criteria In Solid Tumors, which simply use the longest dimension of the lesion as a quantitative metric), the Choi criteria (which incorporates density and longest dimension of the lesion as quantitative measures), and the recently proposed but not fully explored PERCIST (PET Response Criteria in Solid Tumors, which incorporate positron emission tomographic imaging results into the prediction of response) (110,111).
With conventional MR imaging, size and signal intensity changes are most commonly used to predict treatment response but have not been shown to be reliable for determining the effects of treatment (112). The limitations of conventional pulse sequences are related to the multiple scenarios that can occur after neoadjuvant therapy: A mass can remain stable in size due to nonresponse or it may increase in size due to nonresponse; alternatively, it may increase in size due to hemorrhage or it may decrease in size due to response. Hence, signal intensity and size changes can be highly variable and are not a robust measure of whether treatment necrosis has occurred (50). Therefore, for the prediction of treatment response, intravenous contrast material is universally given and, as discussed above, may be administered for a static or dynamic examination.
A static contrast-enhanced examination does not provide adequate detail regarding the percentage of necrosis in a tumor after treatment. Although the static contrast-enhanced study appears to show nonenhancement in many patients who have not responded to treatment, the static study can be misleading, because it has been observed that sarcomas show pathologic treatment response in the form of hyaline fibrosis, necrosis, and granulation tissue (112). As such, differentiation of viable tumor from fibrosis and granulation tissue can be difficult on static contrast-enhanced images, given that fibrosis and granulation tissue usually also enhance with intravenous contrast agent administration. Erlemann et al (65) echoed this concern and showed that static MR imaging is of little value in the determination of treatment response. As described earlier, dynamic contrast-enhanced MR imaging is a technique that exploits the contrast enhancement pattern in a tumor over time. With dynamic contrast-enhanced MR imaging, the differentiation of rapidly enhancing viable tumor from slowly enhancing inflammation and fibrosis is possible. In our practice, we perform the time-resolved TWIST sequence, which provides a volumetric view of contrast enhancement over time in the entire tumor. With this sequence, a qualitative analysis of the images will demonstrate the presence or absence of viable tumor on the early arterial phase contrast-enhanced images; a quantitative analysis can also be performed and pharmacokinetic parameters determined, although in our practice this may not done routinely due to constraints on time and practicality.
Another technique that has been explored for determining treatment response is DW imaging. The analysis of DW imaging data for this application should not be qualitative but rather rely on quantitative changes between the pretreatment and posttreatment images with measurement of the ADCs. Several reports have addressed the utility of DW imaging in the assessment of treatment response and have shown that ADCs correlate well with response in primary bone sarcomas in human patients (36,39,80,113) and in animal models (35,40,43). In soft-tissue sarcomas (18,22,45), ADC changes have been shown to correlate with tumor volume (22) and treatment response (18,45) (Fig 2).
One of the challenges in sarcoma imaging is the need to image the entire lesion. Often, an average ADC from a large tumor is used to show whether posttreatment necrosis has occurred, but this may mask substantial changes in portions of the tumor; Oka et al (39) showed that minimum ADC correlates with response better than average ADC does. At this time, an ADC threshold for differentiating a treatment responder from a nonresponder has not been rigidly determined, but it is likely that a change in posttreatment from pretreatment ADCs signifies some measure of response.
Finally, MR spectroscopy has been used in other organ systems to assess treatment response (114–117) but requires further study in the musculoskeletal system. MR spectroscopy may be used to assess posttreatment levels of metabolite markers of malignancy, compared with their pretreatment levels, to gauge whether treatment-related necrosis has occurred (Fig 2). When choline levels decline to undetectable levels in a tumor, it is likely that substantial necrosis has occurred (55).
Assessment of Postsurgical Site for Recurrent or Residual Disease
After surgery, the goal of MR imaging is to assess the surgical site for the possibility of recurrent or residual tumor. Unfortunately, postoperative inflammation and fibrosis are present in the surgical bed and may share many of the same characteristics as tumor on conventional MR images, because they can occasionally appear masslike (5). As such, it has been shown that only in the absence of abnormal T2-weighted signal intensity can one comfortably rule out the presence of recurrent tumor (118,119), although, uncommonly, a sarcoma recurrence may be of low signal intensity on T2-weighted images. A T1-weighted study is also useful for showing architectural distortion associated with a recurrent tumor, which is not well seen on fluid-sensitive images (Fig 7b). Hence, when a recurrent tumor is present, it can be fairly obvious on nonenhanced images. However, smaller or more subtle recurrences require contrast material administration. In addition, postoperative inflammation or fibrosis can appear masslike. As such, intravenous contrast material is routinely administered to help detect recurrence in the surgical bed when nonenhanced T2-weighted images show signal intensity abnormalities (119). At our institution, a dynamic contrast-enhanced MR imaging study, as well as a delayed contrast-enhanced T1-weighted study, is routinely acquired for the purpose of assessing the postsurgical site for recurrent or residual disease. As is the case with remaining viable tumor after neoadjuvant therapy, recurrent or residual viable tumor after surgery is sought in our practice on a dynamic contrast-enhanced MR imaging study. Recurrent or residual tumor generally enhances early and rapidly, while posttreatment inflammation and fibrosis enhance gradually over time (Fig 7c). DW imaging has also been studied for the purpose of distinguishing different tissue types in the surgical bed, including edema, hygromas, and recurrent tumors (23). Often, in our experience, a recurrent tumor is identified by using an anatomic image or a dynamic contrast-enhanced MR study. The DW image then provides additional characterization properties for confirmation of the tumor’s malignant nature (Fig 7c).
Figure 7b:
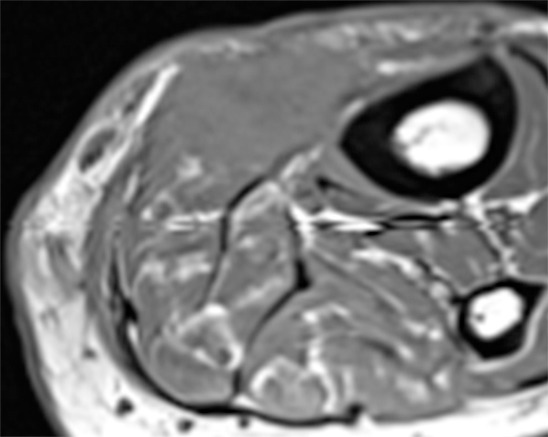
67-year-old woman with recurrent malignant fibrous histiocytoma. The advantages of functional techniques over anatomic imaging are highlighted. (a) Axial fat-suppressed T2 weighted image (TR/TE 3560/64) shows a relatively low to intermediate signal area of signal abnormality in the surgical bed (rectangle) with surrounding postoperative inflammation. (b) Axial T1 weighted image (TR/TE 580/20) shows architectural distortion suspicious for a recurrent mass. (c) ADC map shows a low signal intensity region with ADC value of 0.4, highly suspicious for recurrent tumor. (d) Finally, a contrast-enhanced coronal view from a DCE-MR imaging study (shown here at 20 seconds) shows the neovascularity of the recurrent tumor to best advantage.
Figure 7c:
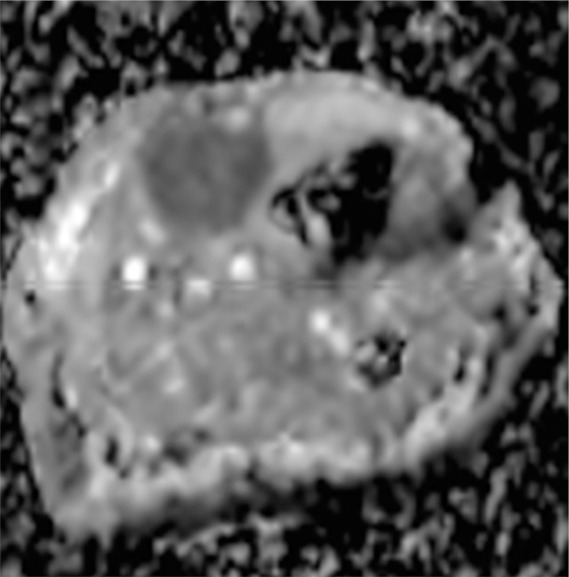
67-year-old woman with recurrent malignant fibrous histiocytoma. The advantages of functional techniques over anatomic imaging are highlighted. (a) Axial fat-suppressed T2 weighted image (TR/TE 3560/64) shows a relatively low to intermediate signal area of signal abnormality in the surgical bed (rectangle) with surrounding postoperative inflammation. (b) Axial T1 weighted image (TR/TE 580/20) shows architectural distortion suspicious for a recurrent mass. (c) ADC map shows a low signal intensity region with ADC value of 0.4, highly suspicious for recurrent tumor. (d) Finally, a contrast-enhanced coronal view from a DCE-MR imaging study (shown here at 20 seconds) shows the neovascularity of the recurrent tumor to best advantage.
Figure 7a:
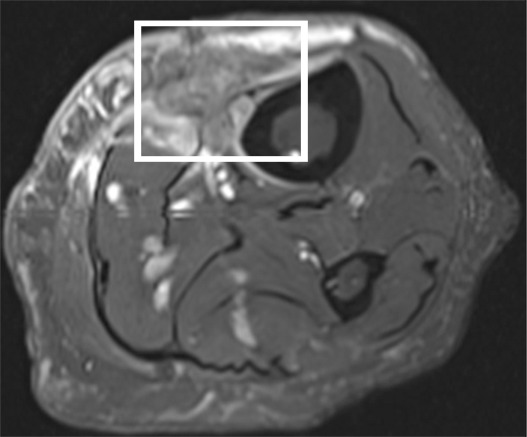
67-year-old woman with recurrent malignant fibrous histiocytoma. The advantages of functional techniques over anatomic imaging are highlighted. (a) Axial fat-suppressed T2 weighted image (TR/TE 3560/64) shows a relatively low to intermediate signal area of signal abnormality in the surgical bed (rectangle) with surrounding postoperative inflammation. (b) Axial T1 weighted image (TR/TE 580/20) shows architectural distortion suspicious for a recurrent mass. (c) ADC map shows a low signal intensity region with ADC value of 0.4, highly suspicious for recurrent tumor. (d) Finally, a contrast-enhanced coronal view from a DCE-MR imaging study (shown here at 20 seconds) shows the neovascularity of the recurrent tumor to best advantage.
Figure 7d:
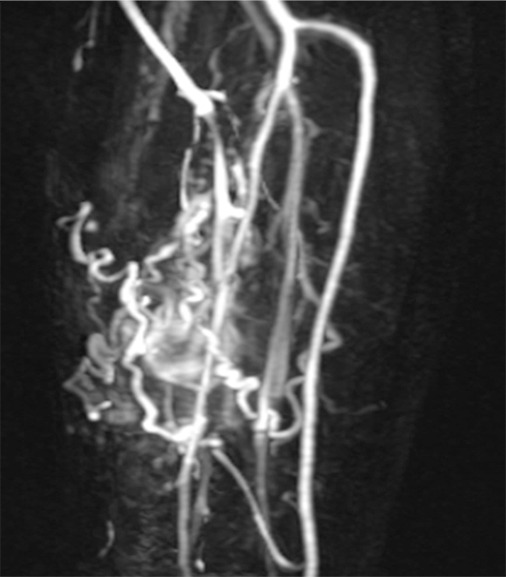
67-year-old woman with recurrent malignant fibrous histiocytoma. The advantages of functional techniques over anatomic imaging are highlighted. (a) Axial fat-suppressed T2 weighted image (TR/TE 3560/64) shows a relatively low to intermediate signal area of signal abnormality in the surgical bed (rectangle) with surrounding postoperative inflammation. (b) Axial T1 weighted image (TR/TE 580/20) shows architectural distortion suspicious for a recurrent mass. (c) ADC map shows a low signal intensity region with ADC value of 0.4, highly suspicious for recurrent tumor. (d) Finally, a contrast-enhanced coronal view from a DCE-MR imaging study (shown here at 20 seconds) shows the neovascularity of the recurrent tumor to best advantage.
Finally, MR spectroscopy has been studied in the postsurgical setting. There are two spectral patterns that have been identified: In patients who have undergone resection with placement of musculocutaneous flap, MR spectroscopy of the surgical bed shows the typical spectrum of muscle in the surgical bed, as expected (51); in patients without muscle flap reconstruction, MR spectroscopy usually shows negligible choline content if no recurrent tumor is present (51,54). However, as with DW imaging, MR spectroscopic measurements of metabolite content in the surgical bed have yet to be fully explored.
Conclusion
The role of MR imaging in the evaluation of musculoskeletal tumors continues to evolve as new techniques emerge. While conventional T1-weighted and fluid-sensitive sequences are entirely sufficient to help determine the location and extent of a lesion, quantitative methods (chemical shift imaging, perfusion imaging, DW imaging, MR spectroscopy) have become available and provide metrics that may advance the role of MR imaging to include detection, characterization, and reliable assessment of treatment response. In this review, the evaluation of musculoskeletal tumors with MR imaging was discussed with an eye to the potential value of the various pulse sequences in providing important information for establishing a diagnosis, assessing pretreatment extent, and evaluating a tumor in the posttreatment setting (Movie [online]). It should be noted that further investigation of these sequences is still needed to draw definitive conclusions as to their value and effect on patient outcome in each of the roles that MR imaging plays for the assessment of musculoskeletal tumors.
Essentials.
• For the detection of a musculoskeletal mass, whole-body imaging has advanced the role of MR, and radiographically occult lesions—especially in the pelvis or spine—may be detected by using MR.
• For the characterization of a musculoskeletal mass with MR, functional (diffusion-weighted imaging, perfusion imaging), and metabolic techniques (proton MR spectroscopy) may provide additional valuable information.
• When evaluating for treatment response after neoadjuvant therapy and before surgery, contrast-enhanced static MR imaging is limited, because both viable tumor and posttreatment scar tissue enhance after contrast agent administration.
• To accurately determine the extent of a bone tumor before surgery, a nonenhanced T1-weighted MR image is essential.
• Chemical shift MR imaging, both in phase and opposed phase, is a fast imaging technique with which a marrow-replacing tumor can be identified and distinguished from bone marrow edema or hematopoietic marrow.
Disclosures of Conflicts of Interest: L.M.F. No relevant conflicts of interest to disclose. M.A.J. No relevant conflicts of interest to disclose. X.W. No relevant conflicts of interest to disclose. J.A.C. Financial activities related to the present article: received a grant from Siemens Medical Systems. Financial activities not related to the present article: served as consultant to Quality Medical Metrics and Medtronics; has grants or grants pending from Siemens Medical Systems, Carestream Health, Toshiba, and Integra. Other relationships: none to disclose. D.A.B. No relevant conflicts of interest to disclose.
Supplementary Material
Acknowledgments
The authors thank Rena Geckle and Leonard Frankford for assisting with media production related to this manuscript.
Received September 19, 2011; revision requested October 26; revision received December 8; accepted January 13, 2012; final version accepted January 23.
L.M.F. supported by the AUR GE Radiology Research Academic Fellowship (2008), SCBT-MR Young Investigator Award (2004), and the William M. G. Gatewood Fellowship.
Funding: This research was supported by the National Institutes of Health (grants R01 CA118371, R01EB009367, 2R01CA112163, NIH R01CA100184, P50CA103175, 5P30CA06973, P50CA88843, and U01CA140204). D.A.B. is an employee of the National Institutes of Health.
Abbreviations:
- ADC
- apparent diffusion coefficient
- DW
- diffusion weighted
- STIR
- short tau inversion recovery
- TWIST
- time-resolved angiography with interleaved stochastic trajectories
References
- 1.Miller SL, Hoffer FA. Malignant and benign bone tumors. Radiol Clin North Am 2001;39(4):673–699 [DOI] [PubMed] [Google Scholar]
- 2.Kransdorf MJ, Jelinek JS, Moser RP, Jr, et al. Soft-tissue masses: diagnosis using MR imaging. AJR Am J Roentgenol 1989;153(3):541–547 [DOI] [PubMed] [Google Scholar]
- 3.Gielen JL, De Schepper AM, Vanhoenacker F, et al. Accuracy of MRI in characterization of soft tissue tumors and tumor-like lesions. A prospective study in 548 patients. Eur Radiol 2004;14(12):2320–2330 [DOI] [PubMed] [Google Scholar]
- 4.Zajick DC, Jr, Morrison WB, Schweitzer ME, Parellada JA, Carrino JA. Benign and malignant processes: normal values and differentiation with chemical shift MR imaging in vertebral marrow. Radiology 2005;237(2):590–596 [DOI] [PubMed] [Google Scholar]
- 5.Griffiths HJ, Thompson RC, Nitke SJ, Olson PN, Thielen KR, Amundson P. Use of MRI in evaluating postoperative changes in patients with bone and soft tissue tumors. Orthopedics 1997;20(3):215–220 [DOI] [PubMed] [Google Scholar]
- 6.Lang P, Grampp S, Vahlensieck M, et al. Primary bone tumors: value of MR angiography for preoperative planning and monitoring response to chemotherapy. AJR Am J Roentgenol 1995;165(1):135–142 [DOI] [PubMed] [Google Scholar]
- 7.Pettersson H, Gillespy T, 3rd, Hamlin DJ, et al. Primary musculoskeletal tumors: examination with MR imaging compared with conventional modalities. Radiology 1987;164(1):237–241 [DOI] [PubMed] [Google Scholar]
- 8.Belfi CA, Medendorp SV, Ngo FQ. The response of the KHT sarcoma to radiotherapy as measured by water proton NMR relaxation times: relationships with tumor volume and water content. Int J Radiat Oncol Biol Phys 1991;20(3):497–507 [DOI] [PubMed] [Google Scholar]
- 9.Richardson ML, Amparo EG, Gillespy T, 3rd, Helms CA, Demas BE, Genant HK. Theoretical considerations for optimizing intensity differences between primary musculoskeletal tumors and normal tissue with spin-echo magnetic resonance imaging. Invest Radiol 1985;20(5):492–497 [DOI] [PubMed] [Google Scholar]
- 10.Jones KM, Schwartz RB, Mantello MT, et al. Fast spin-echo MR in the detection of vertebral metastases: comparison of three sequences. AJNR Am J Neuroradiol 1994;15(3):401–407 [PMC free article] [PubMed] [Google Scholar]
- 11.Pozzi Mucelli R, Cova M, Shariat-Razavi I, Zucconi F, Ukmar M, Longo R. Comparison of magnetic resonance Spin-echo sequences and fat-suppressed sequences in bone diseases [in Italian]. Radiol Med (Torino) 1997;93(5):504–509 [PubMed] [Google Scholar]
- 12.Terk MR, Gober JR, de Verdier H, Simon HE, Colletti PM. Evaluation of suspected musculoskeletal neoplasms using 3D T2-weighted spectral presaturation with inversion recovery. Magn Reson Imaging 1993;11(7):931–939 [DOI] [PubMed] [Google Scholar]
- 13.Disler DG, McCauley TR, Ratner LM, Kesack CD, Cooper JA. In-phase and out-of-phase MR imaging of bone marrow: prediction of neoplasia based on the detection of coexistent fat and water. AJR Am J Roentgenol 1997;169(5):1439–1447 [DOI] [PubMed] [Google Scholar]
- 14.Eito K, Waka S, Naoko N, Makoto A, Atsuko H. Vertebral neoplastic compression fractures: assessment by dual-phase chemical shift imaging. J Magn Reson Imaging 2004;20(6):1020–1024 [DOI] [PubMed] [Google Scholar]
- 15.Ragab Y, Emad Y, Gheita T, et al. Differentiation of osteoporotic and neoplastic vertebral fractures by chemical shift in-phase and out-of phase MR imaging. Eur J Radiol 2009;72(1):125–133 [DOI] [PubMed] [Google Scholar]
- 16.Zampa V, Cosottini M, Michelassi C, Ortori S, Bruschini L, Bartolozzi C. Value of opposed-phase gradient-echo technique in distinguishing between benign and malignant vertebral lesions. Eur Radiol 2002;12(7):1811–1818 [DOI] [PubMed] [Google Scholar]
- 17.Buxton RB, Wismer GL, Brady TJ, Rosen BR. Quantitative proton chemical-shift imaging. Magn Reson Med 1986;3(6):881–900 [DOI] [PubMed] [Google Scholar]
- 18.Einarsdóttir H, Karlsson M, Wejde J, Bauer HC. Diffusion-weighted MRI of soft tissue tumours. Eur Radiol 2004;14(6):959–963 [DOI] [PubMed] [Google Scholar]
- 19.Chenevert TL, Meyer CR, Moffat BA, et al. Diffusion MRI: a new strategy for assessment of cancer therapeutic efficacy. Mol Imaging 2002;1(4):336–343 [DOI] [PubMed] [Google Scholar]
- 20.Szafer A, Zhong J, Gore JC. Theoretical model for water diffusion in tissues. Magn Reson Med 1995;33(5):697–712 [DOI] [PubMed] [Google Scholar]
- 21.Le Bihan D. Intravoxel incoherent motion perfusion MR imaging: a wake-up call. Radiology 2008;249(3):748–752 [DOI] [PubMed] [Google Scholar]
- 22.Dudeck O, Zeile M, Pink D, et al. Diffusion-weighted magnetic resonance imaging allows monitoring of anticancer treatment effects in patients with soft-tissue sarcomas. J Magn Reson Imaging 2008;27(5):1109–1113 [DOI] [PubMed] [Google Scholar]
- 23.Baur A, Huber A, Arbogast S, et al. Diffusion-weighted imaging of tumor recurrencies and posttherapeutical soft-tissue changes in humans. Eur Radiol 2001;11(5):828–833 [DOI] [PubMed] [Google Scholar]
- 24.Baur A, Stäbler A, Brüning R, et al. Diffusion-weighted MR imaging of bone marrow: differentiation of benign versus pathologic compression fractures. Radiology 1998;207(2):349–356 [DOI] [PubMed] [Google Scholar]
- 25.Herneth AM, Naude J, Philipp M, Beichel R, Trattnig S, Imhof H. The value of diffusion-weighted MRT in assessing the bone marrow changes in vertebral metastases [in German]. Radiologe 2000;40(8):731–736 [DOI] [PubMed] [Google Scholar]
- 26.Herneth AM, Philipp MO, Naude J, et al. Vertebral metastases: assessment with apparent diffusion coefficient. Radiology 2002;225(3):889–894 [DOI] [PubMed] [Google Scholar]
- 27.Hayashida Y, Hirai T, Yakushiji T, et al. Evaluation of diffusion-weighted imaging for the differential diagnosis of poorly contrast-enhanced and T2-prolonged bone masses: Initial experience. J Magn Reson Imaging 2006;23(3):377–382 [DOI] [PubMed] [Google Scholar]
- 28.Nagata S, Nishimura H, Uchida M, et al. Diffusion-weighted imaging of soft tissue tumors: usefulness of the apparent diffusion coefficient for differential diagnosis. Radiat Med 2008;26(5):287–295 [DOI] [PubMed] [Google Scholar]
- 29.Namimoto T, Yamashita Y, Awai K, et al. Combined use of T2-weighted and diffusion-weighted 3-T MR imaging for differentiating uterine sarcomas from benign leiomyomas. Eur Radiol 2009;19(11):2756–2764 [DOI] [PubMed] [Google Scholar]
- 30.Oka K, Yakushiji T, Sato H, et al. Ability of diffusion-weighted imaging for the differential diagnosis between chronic expanding hematomas and malignant soft tissue tumors. J Magn Reson Imaging 2008;28(5):1195–1200 [DOI] [PubMed] [Google Scholar]
- 31.van Rijswijk CS, Kunz P, Hogendoorn PC, Taminiau AH, Doornbos J, Bloem JL. Diffusion-weighted MRI in the characterization of soft-tissue tumors. J Magn Reson Imaging 2002;15(3):302–307 [DOI] [PubMed] [Google Scholar]
- 32.Yakushiji T, Oka K, Sato H, et al. Characterization of chondroblastic osteosarcoma: gadolinium-enhanced versus diffusion-weighted MR imaging. J Magn Reson Imaging 2009;29(4):895–900 [DOI] [PubMed] [Google Scholar]
- 33.Zhao M, Pipe JG, Bonnett J, Evelhoch JL. Early detection of treatment response by diffusion-weighted 1H-NMR spectroscopy in a murine tumour in vivo. Br J Cancer 1996;73(1):61–64 [DOI] [PMC free article] [PubMed] [Google Scholar]
- 34.Brisse H, Ollivier L, Edeline V, et al. Imaging of malignant tumours of the long bones in children: monitoring response to neoadjuvant chemotherapy and preoperative assessment. Pediatr Radiol 2004;34(8):595–605 [DOI] [PubMed] [Google Scholar]
- 35.De Keyzer F, Vandecaveye V, Thoeny H, et al. Dynamic contrast-enhanced and diffusion-weighted MRI for early detection of tumoral changes in single-dose and fractionated radiotherapy: evaluation in a rat rhabdomyosarcoma model. Eur Radiol 2009;19(11):2663–2671 [DOI] [PubMed] [Google Scholar]
- 36.Hayashida Y, Yakushiji T, Awai K, et al. Monitoring therapeutic responses of primary bone tumors by diffusion-weighted image: Initial results. Eur Radiol 2006;16(12):2637–2643 [DOI] [PubMed] [Google Scholar]
- 37.Kharuzhyk SA, Petrovskaya NA, Vosmitel MA. Diffusion-weighted magnetic resonance imaging in non-invasive monitoring of antiangiogenic therapy in experimental tumor model. Exp Oncol 2010;32(2):104–106 [PubMed] [Google Scholar]
- 38.Lang P, Wendland MF, Saeed M, et al. Osteogenic sarcoma: noninvasive in vivo assessment of tumor necrosis with diffusion-weighted MR imaging. Radiology 1998;206(1):227–235 [DOI] [PubMed] [Google Scholar]
- 39.Oka K, Yakushiji T, Sato H, Hirai T, Yamashita Y, Mizuta H. The value of diffusion-weighted imaging for monitoring the chemotherapeutic response of osteosarcoma: a comparison between average apparent diffusion coefficient and minimum apparent diffusion coefficient. Skeletal Radiol 2010;39(2):141–146 [DOI] [PubMed] [Google Scholar]
- 40.Reichardt W, Juettner E, Uhl M, Elverfeldt DV, Kontny U. Diffusion-weighted imaging as predictor of therapy response in an animal model of Ewing sarcoma. Invest Radiol 2009;44(5):298–303 [DOI] [PubMed] [Google Scholar]
- 41.Ross BD, Moffat BA, Lawrence TS, et al. Evaluation of cancer therapy using diffusion magnetic resonance imaging. Mol Cancer Ther 2003;2(6):581–587 [PubMed] [Google Scholar]
- 42.Schnapauff D, Zeile M, Niederhagen MB, et al. Diffusion-weighted echo-planar magnetic resonance imaging for the assessment of tumor cellularity in patients with soft-tissue sarcomas. J Magn Reson Imaging 2009;29(6):1355–1359 [DOI] [PubMed] [Google Scholar]
- 43.Thoeny HC, De Keyzer F, Chen F, et al. Diffusion-weighted MR imaging in monitoring the effect of a vascular targeting agent on rhabdomyosarcoma in rats. Radiology 2005;234(3):756–764 [DOI] [PubMed] [Google Scholar]
- 44.Uhl M, Saueressig U, Koehler G, et al. Evaluation of tumour necrosis during chemotherapy with diffusion-weighted MR imaging: preliminary results in osteosarcomas. Pediatr Radiol 2006;36(12):1306–1311 [DOI] [PubMed] [Google Scholar]
- 45.Vossen JA, Kamel IR, Buijs M, et al. Role of functional magnetic resonance imaging in assessing metastatic leiomyosarcoma response to chemoembolization. J Comput Assist Tomogr 2008;32(3):347–352 [DOI] [PubMed] [Google Scholar]
- 46.Le Bihan D, Turner R, Douek P, Patronas N. Diffusion MR imaging: clinical applications. AJR Am J Roentgenol 1992;159(3):591–599 [DOI] [PubMed] [Google Scholar]
- 47.Genovese E, Canì A, Rizzo S, Angeretti MG, Leonardi A, Fugazzola C. Comparison between MRI with spin-echo echo-planar diffusion-weighted sequence (DWI) and histology in the diagnosis of soft-tissue tumours. Radiol Med (Torino) 2011;116(4):644–656 [DOI] [PubMed] [Google Scholar]
- 48.Mintorovitch J, Moseley ME, Chileuitt L, Shimizu H, Cohen Y, Weinstein PR. Comparison of diffusion- and T2-weighted MRI for the early detection of cerebral ischemia and reperfusion in rats. Magn Reson Med 1991;18(1):39–50 [DOI] [PubMed] [Google Scholar]
- 49.Fadul D, Fayad LM. Advanced modalities for the imaging of sarcoma. Surg Clin North Am 2008;88(3):521–537, vi [DOI] [PubMed] [Google Scholar]
- 50.Fayad LM, Barker PB, Bluemke DA. Molecular characterization of musculoskeletal tumors by proton MR spectroscopy. Semin Musculoskelet Radiol 2007;11(3):240–245 [DOI] [PubMed] [Google Scholar]
- 51.Fayad LM, Barker PB, Jacobs MA, et al. Characterization of musculoskeletal lesions on 3-T proton MR spectroscopy. AJR Am J Roentgenol 2007;188(6):1513–1520 [DOI] [PubMed] [Google Scholar]
- 52.Fayad LM, Bluemke DA, McCarthy EF, Weber KL, Barker PB, Jacobs MA. Musculoskeletal tumors: use of proton MR spectroscopic imaging for characterization. J Magn Reson Imaging 2006;23(1):23–28 [DOI] [PubMed] [Google Scholar]
- 53.Fayad LM, Salibi N, Wang X, et al. Quantification of muscle choline concentrations by proton MR spectroscopy at 3 T: technical feasibility. AJR Am J Roentgenol 2010;194(1):W73–W79 [DOI] [PMC free article] [PubMed] [Google Scholar]
- 54.Fayad LM, Wang X, Salibi N, et al. A feasibility study of quantitative molecular characterization of musculoskeletal lesions by proton MR spectroscopy at 3 T. AJR Am J Roentgenol 2010;195(1):W69–W75 [DOI] [PMC free article] [PubMed] [Google Scholar]
- 55.Hsieh TJ, Li CW, Chuang HY, Liu GC, Wang CK. Longitudinally monitoring chemotherapy effect of malignant musculoskeletal tumors with in vivo proton magnetic resonance spectroscopy: an initial experience. J Comput Assist Tomogr 2008;32(6):987–994 [DOI] [PubMed] [Google Scholar]
- 56.Lee CW, Lee JH, Kim DH, et al. Proton magnetic resonance spectroscopy of musculoskeletal lesions at 3 T with metabolite quantification. Clin Imaging 2010;34(1):47–52 [DOI] [PubMed] [Google Scholar]
- 57.Qi ZH, Li CF, Li ZF, Zhang K, Wang Q, Yu DX. Preliminary study of 3T 1H MR spectroscopy in bone and soft tissue tumors. Chin Med J (Engl) 2009;122(1):39–43 [PubMed] [Google Scholar]
- 58.Sah PL, Sharma R, Kandpal H, et al. In vivo proton spectroscopy of giant cell tumor of the bone. AJR Am J Roentgenol 2008;190(2):W133–W139 [DOI] [PubMed] [Google Scholar]
- 59.Wang CK, Li CW, Hsieh TJ, Chien SH, Liu GC, Tsai KB. Characterization of bone and soft-tissue tumors with in vivo 1H MR spectroscopy: initial results. Radiology 2004;232(2):599–605 [DOI] [PubMed] [Google Scholar]
- 60.Lacerda S, Law M. Magnetic resonance perfusion and permeability imaging in brain tumors. Neuroimaging Clin N Am 2009;19(4):527–557 [DOI] [PubMed] [Google Scholar]
- 61.Warmuth C, Gunther M, Zimmer C. Quantification of blood flow in brain tumors: comparison of arterial spin labeling and dynamic susceptibility-weighted contrast-enhanced MR imaging. Radiology 2003;228(2):523–532 [DOI] [PubMed] [Google Scholar]
- 62.Bajpai J, Gamanagatti S, Sharma MC, et al. Noninvasive imaging surrogate of angiogenesis in osteosarcoma. Pediatr Blood Cancer 2010;54(4):526–531 [DOI] [PubMed] [Google Scholar]
- 63.Dyke JP, Panicek DM, Healey JH, et al. Osteogenic and Ewing sarcomas: estimation of necrotic fraction during induction chemotherapy with dynamic contrast-enhanced MR imaging. Radiology 2003;228(1):271–278 [DOI] [PubMed] [Google Scholar]
- 64.Egmont-Petersen M, Hogendoorn PC, van der Geest RJ, et al. Detection of areas with viable remnant tumor in postchemotherapy patients with Ewing’s sarcoma by dynamic contrast-enhanced MRI using pharmacokinetic modeling. Magn Reson Imaging 2000;18(5):525–535 [DOI] [PubMed] [Google Scholar]
- 65.Erlemann R, Sciuk J, Bosse A, et al. Response of osteosarcoma and Ewing sarcoma to preoperative chemotherapy: assessment with dynamic and static MR imaging and skeletal scintigraphy. Radiology 1990;175(3):791–796 [DOI] [PubMed] [Google Scholar]
- 66.Guo JY, Reddick WE. DCE-MRI pixel-by-pixel quantitative curve pattern analysis and its application to osteosarcoma. J Magn Reson Imaging 2009;30(1):177–184 [DOI] [PubMed] [Google Scholar]
- 67.Hoang BH, Dyke JP, Koutcher JA, et al. VEGF expression in osteosarcoma correlates with vascular permeability by dynamic MRI. Clin Orthop Relat Res 2004;426(426):32–38 [DOI] [PubMed] [Google Scholar]
- 68.Lavini C, Pikaart BP, de Jonge MC, Schaap GR, Maas M. Region of interest and pixel-by-pixel analysis of dynamic contrast enhanced magnetic resonance imaging parameters and time-intensity curve shapes: a comparison in chondroid tumors. Magn Reson Imaging 2009;27(1):62–68 [DOI] [PubMed] [Google Scholar]
- 69.Preda A, Wielopolski PA, Ten Hagen TL, et al. Dynamic contrast-enhanced MRI using macromolecular contrast media for monitoring the response to isolated limb perfusion in experimental soft-tissue sarcomas. MAGMA 2004;17(3-6):296–302 [DOI] [PubMed] [Google Scholar]
- 70.Reddick WE, Wang S, Xiong X, et al. Dynamic magnetic resonance imaging of regional contrast access as an additional prognostic factor in pediatric osteosarcoma. Cancer 2001;91(12):2230–2237 [PubMed] [Google Scholar]
- 71.Schramm N, Schlemmer M, Rist C, Issels R, Reiser MF, Berger F. Combined functional and morphological imaging of sarcomas: significance for diagnostics and therapy monitoring [in German]. Radiologe 2010;50(4):339–348 [DOI] [PubMed] [Google Scholar]
- 72.Shapeero LG, Vanel D. Imaging evaluation of the response of high-grade osteosarcoma and Ewing sarcoma to chemotherapy with emphasis on dynamic contrast-enhanced magnetic resonance imaging. Semin Musculoskelet Radiol 2000;4(1):137–146 [DOI] [PubMed] [Google Scholar]
- 73.Toms AP, White LM, Kandel R, et al. Limitations of single slice dynamic contrast enhanced MR in pharmacokinetic modeling of bone sarcomas. Acta Radiol 2009;50(5):512–520 [DOI] [PubMed] [Google Scholar]
- 74.Torricelli P, Montanari N, Spina V, et al. Dynamic contrast enhanced magnetic resonance imaging subtraction in evaluating osteosarcoma response to chemotherapy. Radiol Med (Torino) 2001;101(3):145–151 [PubMed] [Google Scholar]
- 75.Tuncbilek N, Karakas HM, Okten OO. Dynamic contrast enhanced MRI in the differential diagnosis of soft tissue tumors. Eur J Radiol 2005;53(3):500–505 [DOI] [PubMed] [Google Scholar]
- 76.van Rijswijk CS, Geirnaerdt MJ, Hogendoorn PC, et al. Dynamic contrast-enhanced MR imaging in monitoring response to isolated limb perfusion in high-grade soft tissue sarcoma: initial results. Eur Radiol 2003;13(8):1849–1858 [DOI] [PubMed] [Google Scholar]
- 77.van Rijswijk CS, Geirnaerdt MJ, Hogendoorn PC, et al. Soft-tissue tumors: value of static and dynamic gadopentetate dimeglumine-enhanced MR imaging in prediction of malignancy. Radiology 2004;233(2):493–502 [DOI] [PubMed] [Google Scholar]
- 78.van Rijswijk CS, Hogendoorn PC, Taminiau AH, Bloem JL. Synovial sarcoma: dynamic contrast-enhanced MR imaging features. Skeletal Radiol 2001;30(1):25–30 [DOI] [PubMed] [Google Scholar]
- 79.Viglianti BL, Lora-Michiels M, Poulson JM, et al. Dynamic contrast-enhanced magnetic resonance imaging as a predictor of clinical outcome in canine spontaneous soft tissue sarcomas treated with thermoradiotherapy. Clin Cancer Res 2009;15(15):4993–5001 [DOI] [PMC free article] [PubMed] [Google Scholar]
- 80.Uhl M, Saueressig U, van Buiren M, et al. Osteosarcoma: preliminary results of in vivo assessment of tumor necrosis after chemotherapy with diffusion- and perfusion-weighted magnetic resonance imaging. Invest Radiol 2006;41(8):618–623 [DOI] [PubMed] [Google Scholar]
- 81.Erlemann R, Reiser MF, Peters PE, et al. Musculoskeletal neoplasms: static and dynamic Gd-DTPA—enhanced MR imaging. Radiology 1989;171(3):767–773 [DOI] [PubMed] [Google Scholar]
- 82.Korosec FR, Frayne R, Grist TM, Mistretta CA. Time-resolved contrast-enhanced 3D MR angiography. Magn Reson Med 1996;36(3):345–351 [DOI] [PubMed] [Google Scholar]
- 83.Song T, Laine AF, Chen Q, et al. Optimal k-space sampling for dynamic contrast-enhanced MRI with an application to MR renography. Magn Reson Med 2009;61(5):1242–1248 [DOI] [PMC free article] [PubMed] [Google Scholar]
- 84.Hawighorst H, Libicher M, Knopp MV, Moehler T, Kauffmann GW, Kaick G. Evaluation of angiogenesis and perfusion of bone marrow lesions: role of semiquantitative and quantitative dynamic MRI. J Magn Reson Imaging 1999;10(3):286–294 [DOI] [PubMed] [Google Scholar]
- 85.van der Woude HJ, Verstraete KL, Hogendoorn PC, Taminiau AH, Hermans J, Bloem JL. Musculoskeletal tumors: does fast dynamic contrast-enhanced subtraction MR imaging contribute to the characterization? Radiology 1998;208(3):821–828 [DOI] [PubMed] [Google Scholar]
- 86.Alic L, van Vliet M, van Dijke CF, Eggermont AM, Veenland JF, Niessen WJ. Heterogeneity in DCE-MRI parametric maps: a biomarker for treatment response? Phys Med Biol 2011;56(6):1601–1616 [DOI] [PubMed] [Google Scholar]
- 87.Huang W, Wang Y, Panicek DM, Schwartz LH, Koutcher JA. Feasibility of using limited-population-based average R10 for pharmacokinetic modeling of osteosarcoma dynamic contrast-enhanced magnetic resonance imaging data. Magn Reson Imaging 2009;27(6):852–858 [DOI] [PMC free article] [PubMed] [Google Scholar]
- 88.Taylor JS, Tofts PS, Port R, et al. MR imaging of tumor microcirculation: promise for the new millennium. J Magn Reson Imaging 1999;10(6):903–907 [DOI] [PubMed] [Google Scholar]
- 89.Zhou Q, Gallo JM. The pharmacokinetic/pharmacodynamic pipeline: translating anticancer drug pharmacology to the clinic. AAPS J 2011;13(1):111–120 [DOI] [PMC free article] [PubMed] [Google Scholar]
- 90.van der Woude HJ, Bloem JL, Verstraete KL, Taminiau AH, Nooy MA, Hogendoorn PC. Osteosarcoma and Ewing’s sarcoma after neoadjuvant chemotherapy: value of dynamic MR imaging in detecting viable tumor before surgery. AJR Am J Roentgenol 1995;165(3):593–598 [DOI] [PubMed] [Google Scholar]
- 91.Takenaka D, Ohno Y, Matsumoto K, et al. Detection of bone metastases in non-small cell lung cancer patients: comparison of whole-body diffusion-weighted imaging (DWI), whole-body MR imaging without and with DWI, whole-body FDG-PET/CT, and bone scintigraphy. J Magn Reson Imaging 2009;30(2):298–308 [DOI] [PubMed] [Google Scholar]
- 92.Gutzeit A, Doert A, Froehlich JM, et al. Comparison of diffusion-weighted whole body MRI and skeletal scintigraphy for the detection of bone metastases in patients with prostate or breast carcinoma. Skeletal Radiol 2010;39(4):333–343 [DOI] [PubMed] [Google Scholar]
- 93.Hayes CW, Conway WF, Sundaram M. Misleading aggressive MR imaging appearance of some benign musculoskeletal lesions. RadioGraphics 1992;12(6):1119–1134; discussion 1135–1136 [DOI] [PubMed] [Google Scholar]
- 94.Crim JR, Seeger LL, Yao L, Chandnani V, Eckardt JJ. Diagnosis of soft-tissue masses with MR imaging: can benign masses be differentiated from malignant ones? Radiology 1992;185(2):581–586 [DOI] [PubMed] [Google Scholar]
- 95.Moulton JS, Blebea JS, Dunco DM, Braley SE, Bisset GS, 3rd, Emery KH. MR imaging of soft-tissue masses: diagnostic efficacy and value of distinguishing between benign and malignant lesions. AJR Am J Roentgenol 1995;164(5):1191–1199 [DOI] [PubMed] [Google Scholar]
- 96.Ma LD, Frassica FJ, McCarthy EF, Bluemke DA, Zerhouni EA. Benign and malignant musculoskeletal masses: MR imaging differentiation with rim-to-center differential enhancement ratios. Radiology 1997;202(3):739–744 [DOI] [PubMed] [Google Scholar]
- 97.Bodner G, Schocke MF, Rachbauer F, et al. Differentiation of malignant and benign musculoskeletal tumors: combined color and power Doppler US and spectral wave analysis. Radiology 2002;223(2):410–416 [DOI] [PubMed] [Google Scholar]
- 98.Rydholm A. Improving the management of soft tissue sarcoma. Diagnosis and treatment should be given in specialist centres. BMJ 1998;317(7151):93–94 [DOI] [PMC free article] [PubMed] [Google Scholar]
- 99.Yang J, Frassica FJ, Fayad L, Clark DP, Weber KL. Analysis of nondiagnostic results after image-guided needle biopsies of musculoskeletal lesions. Clin Orthop Relat Res 2010;468(11):3103–3111 [DOI] [PMC free article] [PubMed] [Google Scholar]
- 100.Hermann G, Abdelwahab IF, Miller TT, Klein MJ, Lewis MM. Tumour and tumour-like conditions of the soft tissue: magnetic resonance imaging features differentiating benign from malignant masses. Br J Radiol 1992;65(769):14–20 [DOI] [PubMed] [Google Scholar]
- 101.Ma LD, McCarthy EF, Bluemke DA, Frassica FJ. Differentiation of benign from malignant musculoskeletal lesions using MR imaging: pitfalls in MR evaluation of lesions with a cystic appearance. AJR Am J Roentgenol 1998;170(5):1251–1258 [DOI] [PubMed] [Google Scholar]
- 102.Verstraete KL, Vanzieleghem B, De Deene Y, et al. Static, dynamic and first-pass MR imaging of musculoskeletal lesions using gadodiamide injection. Acta Radiol 1995;36(1):27–36 [PubMed] [Google Scholar]
- 103.Fayad LM, Kamel IR, Kawamoto S, Bluemke DA, Frassica FJ, Fishman EK. Distinguishing stress fractures from pathologic fractures: a multimodality approach. Skeletal Radiol 2005;34(5):245–259 [DOI] [PubMed] [Google Scholar]
- 104.Tamai K, Koyama T, Saga T, et al. The utility of diffusion-weighted MR imaging for differentiating uterine sarcomas from benign leiomyomas. Eur Radiol 2008;18(4):723–730 [DOI] [PubMed] [Google Scholar]
- 105.Vogler JB, 3rd, Murphy WA. Bone marrow imaging. Radiology 1988;168(3):679–693 [DOI] [PubMed] [Google Scholar]
- 106.Gelderblom H, Jinks RC, Sydes M, et al. Survival after recurrent osteosarcoma: data from 3 European Osteosarcoma Intergroup (EOI) randomized controlled trials. Eur J Cancer 2011;47(6):895–902 [DOI] [PubMed] [Google Scholar]
- 107.Hegyi M, Semsei AF, Jakab Z, et al. Good prognosis of localized osteosarcoma in young patients treated with limb-salvage surgery and chemotherapy. Pediatr Blood Cancer 2011;57(3):415–422 [Published correction appears in Pediatr Blood Cancer 2012;58(4):654.] [DOI] [PubMed] [Google Scholar]
- 108.Donahue TR, Kattan MW, Nelson SD, Tap WD, Eilber FR, Eilber FC. Evaluation of neoadjuvant therapy and histopathologic response in primary, high-grade retroperitoneal sarcomas using the sarcoma nomogram. Cancer 2010;116(16):3883–3891 [DOI] [PubMed] [Google Scholar]
- 109.Eilber FC, Rosen G, Eckardt J, et al. Treatment-induced pathologic necrosis: a predictor of local recurrence and survival in patients receiving neoadjuvant therapy for high-grade extremity soft tissue sarcomas. J Clin Oncol 2001;19(13):3203–3209 [DOI] [PubMed] [Google Scholar]
- 110.Wahl RL, Jacene H, Kasamon Y, Lodge MA. From RECIST to PERCIST: Evolving Considerations for PET response criteria in solid tumors. J Nucl Med 2009;50(Suppl 1):122S–150S [DOI] [PMC free article] [PubMed] [Google Scholar]
- 111.Stacchiotti S, Collini P, Messina A, et al. High-grade soft-tissue sarcomas: tumor response assessment—pilot study to assess the correlation between radiologic and pathologic response by using RECIST and Choi criteria. Radiology 2009;251(2):447–456 [DOI] [PubMed] [Google Scholar]
- 112.Roberge D, Skamene T, Nahal A, Turcotte RE, Powell T, Freeman C. Radiological and pathological response following pre-operative radiotherapy for soft-tissue sarcoma. Radiother Oncol 2010;97(3):404–407 [DOI] [PubMed] [Google Scholar]
- 113.Lang P, Johnston JO, Arenal-Romero F, Gooding CA. Advances in MR imaging of pediatric musculoskeletal neoplasms. Magn Reson Imaging Clin N Am 1998;6(3):579–604 [PubMed] [Google Scholar]
- 114.Bonekamp S, Shen J, Salibi N, Lai HC, Geschwind J, Kamel IR. Early response of hepatic malignancies to locoregional therapy-value of diffusion-weighted magnetic resonance imaging and proton magnetic resonance spectroscopy. J Comput Assist Tomogr 2011;35(2):167–173 [DOI] [PMC free article] [PubMed] [Google Scholar]
- 115.Glunde K, Bhujwalla ZM. Metabolic tumor imaging using magnetic resonance spectroscopy. Semin Oncol 2011;38(1):26–41 [DOI] [PMC free article] [PubMed] [Google Scholar]
- 116.Jansen JF, Schöder H, Lee NY, et al. Tumor metabolism and perfusion in head and neck squamous cell carcinoma: pretreatment multimodality imaging with 1H magnetic resonance spectroscopy, dynamic contrast-enhanced MRI, and [18F]FDG-PET. Int J Radiat Oncol Biol Phys 2012;82(1):299–307 [DOI] [PMC free article] [PubMed] [Google Scholar]
- 117.Vöglein J, Tüttenberg J, Weimer M, et al. Treatment monitoring in gliomas: comparison of dynamic susceptibility-weighted contrast-enhanced and spectroscopic MRI techniques for identifying treatment failure. Invest Radiol 2011;46(6):390–400 [DOI] [PubMed] [Google Scholar]
- 118.Vanel D, Lacombe MJ, Couanet D, Kalifa C, Spielmann M, Genin J. Musculoskeletal tumors: follow-up with MR imaging after treatment with surgery and radiation therapy. Radiology 1987;164(1):243–245 [DOI] [PubMed] [Google Scholar]
- 119.Vanel D, Shapeero LG, De Baere T, et al. MR imaging in the follow-up of malignant and aggressive soft-tissue tumors: results of 511 examinations. Radiology 1994;190(1):263–268 [DOI] [PubMed] [Google Scholar]
Associated Data
This section collects any data citations, data availability statements, or supplementary materials included in this article.


