In men with clinically low-risk prostate cancer, detection of lesions of less than 1 cm3 with T2-weighted MR imaging is significantly dependent on lesion Gleason score; detection of lesions of 1 cm3 or greater is significantly better than detection of smaller lesions and is not affected by lesion Gleason score.
Abstract
Purpose:
To prospectively evaluate diagnostic performance of T2-weighted magnetic resonance (MR) imaging and MR spectroscopic imaging in detecting lesions stratified by pathologic volume and Gleason score in men with clinically determined low-risk prostate cancer.
Materials and Methods:
The institutional review board approved this prospective, HIPAA-compliant study. Written informed consent was obtained from 183 men with clinically low-risk prostate cancer (cT1–cT2a, Gleason score ≤ 6 at biopsy, prostate-specific antigen [PSA] level < 10 ng/mL [10 μg/L]) undergoing MR imaging before prostatectomy. By using a scale of 1–5 (score 1, definitely no tumor; score 5, definitely tumor), two radiologists independently scored likelihood of tumor per sextant on T2-weighted images. Two spectroscopists jointly recorded locations of lesions with metabolic features consistent with tumor on MR spectroscopic images. Whole-mount step-section histopathologic analysis constituted the reference standard. Diagnostic performance at sextant level (T2-weighted imaging) and detection sensitivities (T2-weighted imaging and MR spectroscopic imaging) for lesions of 0.5 cm3 or larger were calculated.
Results:
For T2-weighted imaging, areas under the receiver operating characteristic curves for sextant-level detection were 0.77 (reader 1) and 0.82 (reader 2). For lesions of ≥0.5 cm3 and ,1 <cm3, sensitivities were significantly lower when the lesion Gleason score was ≤6 (0.44 [reader 1] and 0.61 [reader 2]) rather than when the Gleason score was ≥7 (0.73, P = .02 [reader 1]; and 0.84, P = .05 [reader 2]). For lesions of ≥1 cm3, lesion Gleason score did not significantly affect sensitivity (0.83 [reader 1] and 1.00 [reader 2] for Gleason score ≤6 vs 0.82 and 0.92 for Gleason score ≥ 7; P ≥ .07). MR spectroscopic imaging sensitivity was low and was not significantly affected by pathologic lesion volume or Gleason score.
Conclusion:
In men with clinically low-risk prostate cancer, detection of lesions of <1 cm3 with T2-weighted imaging is significantly dependent on lesion Gleason score; detection of lesions of ≥1 cm3 is significantly better than detection of smaller lesions and is not affected by lesion Gleason score. The role of MR spectroscopic imaging alone in this population is limited.
© RSNA, 2012
Introduction
Widespread use of serum prostate-specific antigen (PSA) level screening has dramatically increased the diagnosis of small, early-stage prostate cancers (1). Data suggest that, from 1989–1992 to 1999–2001, the proportion of newly diagnosed prostate cancers in the United States that fit the standard definition of clinically low-risk disease (clinical stage of T1–T2a, Gleason score of ≤6 at biopsy, PSA level of <10 ng/mL [<10 μg/L]) rose from less than one-third to nearly one-half (2). Most patients with clinically low-risk prostate cancer are offered a choice between active surveillance and radical treatment (eg, radical prostatectomy or radiation therapy), which carries substantial risks of morbidity. Making this choice is often difficult, because the natural history of low-risk prostate cancer is poorly understood and there is no consensus in regard to best practice.
At surgery, many prostate cancers initially considered low risk prove to be of higher grade, stage, or volume than expected (3,4). Conversely, many patients with clinically low-risk prostate cancer harbor clinically insignificant disease that may never require treatment (5). Although statistical tools have been developed to predict the pathologic stage of prostate cancer or the treatment outcome on the basis of clinical variables, the predictive capability of these variables has decreased with the downward migration in prostate cancer volume and stage (6,7).
Focal ablative therapy is emerging as a less invasive alternative to radical treatment for men with low-risk prostate cancer. Debate continues as to whether focal therapy should aim exclusively at the cancer (to achieve a “prostate lumpectomy”) or, in an approach that has recently gained wider acceptance, should be directed at the portion of the prostate that harbors the cancer (8). Although prostate cancer is often multifocal, the volume of the largest, or index, tumor has been found to be as good a predictor of recurrence after radical prostatectomy as the total tumor volume (9). Evidence suggests that pathologic tumor volume of greater than 0.5 cm3 and a Gleason score of 7 or higher are the main determinants of clinical significance (10). Thus, it has been proposed that, even in patients with multifocal cancer, focal therapy directed only at clinically significant tumors might suffice (10).
The capability to reliably detect and localize clinically important tumors within the prostate by using imaging would allow better selection among active surveillance, focal therapy, and radical therapy. Researchers in numerous studies have suggested that magnetic resonance (MR) imaging, used alone or in combination with functional or metabolic MR imaging techniques, such as MR spectroscopic imaging, can contribute valuable information to the pretreatment assessment of prostate cancer (4,11–18). Therefore, the purpose of our study was to prospectively evaluate the diagnostic performance of T2-weighted MR imaging and MR spectroscopic imaging in detecting lesions stratified by pathologic volume and Gleason score in men with clinically determined low-risk prostate cancer.
Materials and Methods
Patients
Between December 2005 and November 2009, 358 patients gave informed consent to be enrolled in a prospective Institutional Review Board–approved National Institutes of Health study investigating the use of pretreatment MR imaging and MR spectroscopic imaging for assessing clinically low-risk prostate cancer (clinical stage T1c–T2a, Gleason score of ≤6 at biopsy, PSA level of <10 ng/mL [<10 μg/L]). Management of these patients’ cancers depended on discussions between the patient and referring physician and patient choice. Options included active surveillance, radical prostatectomy, and radiation therapy. As per the study design and clear wording in the consent form, MR imaging and MR spectroscopic imaging findings did not influence treatment selection. At the completion of the National Institutes of Health trial, 200 patients had undergone radical prostatectomy as the primary treatment modality, 57 patients had undergone radiation therapy, 67 patients had undergone active surveillance, and 34 were treated at an outside institution or lost to follow-up after they had undergone their initial MR imaging. For our analysis, we selected patients enrolled in the National Institutes of Health study who had undergone radical prostatectomy; of these 200 patients, 17 were subsequently excluded (three because they withdrew consent, nine because they had a Gleason score of ≥7 at biopsy or a PSA level of ≥10 ng/mL [≥10 μg/L] when their pathology slides or laboratory values were reevaluated at our institution, and five because of an incomplete examination). Another five patients did not complete the MR spectroscopic imaging portion of the study. Therefore, 183 patients were included in our T2-weighted MR imaging analysis, and 178 patients were included in our MR spectroscopic imaging analysis.
Endorectal MR Imaging and MR Spectroscopic Imaging Acquisition and Processing
Endorectal MR imaging and MR spectroscopic imaging were performed by using a 1.5-T whole-body MR unit (GE Medical Systems, Waukesha, Wis). Patients were examined in the supine position, with use of a body coil for excitation and a phased-array pelvic coil (GE Medical Systems) combined with a commercially available balloon-covered expandable endorectal coil (Medrad, Warrendale, Pa) filled with air for signal reception. The prostate MR imaging and MR spectroscopic imaging acquisition protocols used remained constant throughout the study and consisted of transverse T1-weighted images (repetition time msec/echo time msec, 400–750/10–14; 5-mm section thickness; 1-mm intersection gap; 28–36-cm field of view; matrix, 256 × 192); and transverse, coronal, and sagittal T2-weighted fast spin-echo images (3500–6000/120 [effective]; 3-mm section thickness; no intersection gap; 12–14-cm field of view; matrix, 256 × 192). MR spectroscopic imaging was acquired with commercially available software (PROSE; GE Medical Systems), which acquires data with the point-resolved spatially localized spectroscopy technique by using spectral-spatial pulses to excite choline, polyamines, creatine, and citrate within the point-resolved spatially localized spectroscopy excitation volume. Water and lipids were suppressed in a voxel array with an in-plane resolution of 6.9 mm and voxel volume of 0.16 cm3 (total acquisition time of 17 minutes). Peak areas were calculated by means of numerical integration. Ratios of choline plus polyamines plus creatine to citrate were calculated for all diagnostic voxels.
Endorectal MR Imaging and MR Spectroscopic Imaging Interpretation
T2-weighted images were prospectively and independently interpreted by two radiologists with more than 5 (O.A.) and more than 20 (H.H.) years of experience reading prostate MR images. MR spectroscopic imaging data were interpreted in consensus by two spectroscopists (A.S., K.L.Z.), who each had more than 5 years of experience reading prostate MR spectroscopic images and were blinded to the T2-weighted imaging findings. All readers knew the patients had clinically determined low-risk disease but were blinded to patients’ specific clinical data and biopsy findings.
With the use of established criteria (11,19,20), each radiologist scored the probability of the presence of tumor on T2-weighted images in each sextant of the prostate (for both peripheral and transition zones) on the following scale: score 1, definitely absent; score 2, probably absent; score 3, indeterminate; score 4, probably present; and score 5, definitely present. On MR spectroscopic images, spectroscopists recorded the number and locations of suspicious voxels fulfilling previously established metabolic criteria (15). In addition, readers of the T2-weighted MR images and MR spectroscopic images also drew the locations of tumors on a schematic representation of the right and left peripheral and transition zones at the level of the base, midgland, and apex. For the purpose of this study, the prostate was divided into an upper third, which included the region in the base of the prostate; a middle third, which included the region at the level of the verumontanum; and a lower third, which included the remaining apical portion of the prostate.
Histopathologic Analysis and Image Correlation
Whole-mount step-section histopathologic tumor maps served as the reference standard for MR imaging findings in each patient. A genitourinary pathologist (V.E.R.) with more than 20 years of experience, who was blinded to MR imaging and MR spectroscopic imaging results, mapped prostate cancer foci in each section and determined the Gleason grade patterns present in each lesion. The primary Gleason grade was the one representing the majority of the lesion, whereas the secondary Gleason grade represented the second most prevalent Gleason pattern, comprising at least 5% of the lesion. The primary and secondary Gleason grades were added to obtain the total lesion Gleason score. Tumor volume for each cancer focus was calculated with computerized planimetry by using image analysis and measurement software (Image-Pro Plus; Media Cybernetics, Bethesda, Md) from the whole-mount pathologic specimen by a pathology fellow (K.K.). MR imaging–pathology correlation was performed by a radiologist not involved in MR interpretation (H.A.V., with 4 years of experience in prostate MR imaging), taking into account the location of tumors with respect to the prostatic urethra (anterior, posterior, right, and/or left) and other anatomic landmarks, such as prostate zones, the ejaculatory ducts, and the verumontanum, thus subjectively allowing for distortions in the prostate size and shape caused in vivo by the presence of the endorectal coil and ex vivo by the preparation (eg, tissue shrinking during fixation) of the whole-mount pathologic specimen. Tumor locations were assigned to the prostatic sextant regions (right, left; base, midgland, apex) on the basis of whole-mount histopathologic tumor maps. In addition, the location of the pathologic index (largest volume) lesion was determined in each patient.
Statistical Methods
Statistical analyses were done at the sextant level and, for individual lesions of 0.5 cm3 or greater, at the lesion level. Readers’ T2-weighted imaging scores were dichotomized as follows: a score of 3 or lower was indicative of negative findings and a score of 4 or higher was indicative of positive findings. On MR spectroscopic images, lesions were deemed consistent with tumor in the presence of three or more contiguous abnormal voxels (representing a volume of 0.48 cm3). For the purpose of sextant analyses, any lesion occupying more than one sextant was assigned to the sextant containing the center of the lesion. Because of the inherent limitations in regard to anatomic coverage of the region of the base of the prostate on MR spectroscopic images, diagnostic performance at a sextant level was only evaluated on T2-weighted images. Lesion-level analysis was performed on both T2-weighted images and MR spectroscopic images. For lesion-level analyses, if a patient had multiple lesions of 0.5 cm3 or larger, all were included. Detection of the largest lesion with a pathologic volume of 0.5 cm3 or greater (ie, the index lesion) in each patient was also assessed. Interreader agreement on T2-weighted images was assessed by using weighted κ statistics with Fleiss-Cohen (quadratic) weights; κ statistics were interpreted on the basis of the table provided by Landis and Koch (21) and Fleiss et al (22). Interreader agreement was not assessed on MR spectroscopic images, as the spectroscopists evaluated the MR spectroscopic imaging studies in consensus.
The sensitivities for lesions of 0.5 cm3 or larger of different volumes and grades were evaluated and compared by using the adjusted Wald test for the correlated data for each reader separately. The 95% confidence interval (CI) of the sensitivity was calculated on the basis of the robust variance estimation. The univariate associations between volume and sensitivity and between grade and sensitivity were examined by using the generalized estimating equation with an independent correlation matrix and a robust covariance matrix.
The empirical receiver operating characteristic curve and estimated area under the curve (AUC) were estimated, taking into account multiple sextants or multiple lesions per patient. Measurements of accuracy (sensitivity and/or specificity, positive predictive value, and negative predictive value) were estimated along with the corresponding 95% CIs at the sextant and lesion levels, taking into account multiple sextants or lesions per patient.
Analyses were performed in software (SAS 9.2, SAS Institute, Cary, NC; and Stata 11.0, StataCorp, College Station, Tex). A test with P ≤ .05 was considered to indicate a significant difference.
Results
Patient Characteristics
Patients’ characteristics are summarized in Table 1. Although all 183 patients were initially considered to have clinically low-risk disease, at surgical pathology, only 80 patients (43.7%) had Gleason scores of 6 or lower, whereas 103 (56.3%) had Gleason scores of 7 or higher, and 152 (83.1%) had stage T2b disease or higher (Table 1). As determined from the whole-mount pathology tumor maps, the mean tumor volume was 1.21 cm3 (range, 0.5–9.65 cm3). In total, there were 74 tumors of 0.5 to 1 cm3 and 45 tumors of 1 cm3 or greater. One hundred eight tumors were located in the peripheral zone (mean volume, 1.1 cm3 ± 0.76 [standard deviation]) and 11 tumors in the transition zone (mean volume 2.3 ± 2.6 mL). One hundred three patients had at least one lesion of 0.5 cm3 or greater, 14 of 103 patients had two lesions of 0.5 cm3 or greater, and one of 103 had three lesions of 0.5 cm3 or greater. Tumors with Gleason scores of 6 or lower had a mean volume of 0.9 cm3 ± 0.7, and tumors with Gleason scores of 7 or higher had a mean volume of 1.3 cm3 ± 1.2.
Table 1.
Clinical and Pathologic Characteristics in 183 Patients
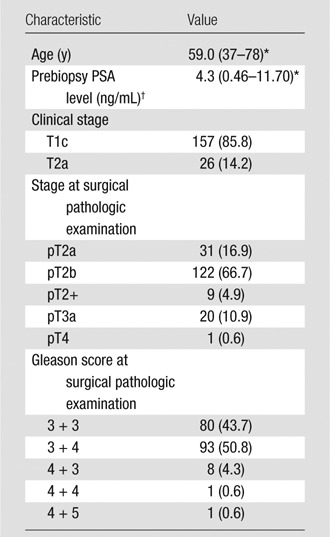
Note.—Unless otherwise noted, data are numbers of patients, with percentages in parentheses.
Median value, with range in parentheses.
To convert to Système International units in micrograms per liter, multiply by 1.0.
Performance Characteristics in Tumor Detection
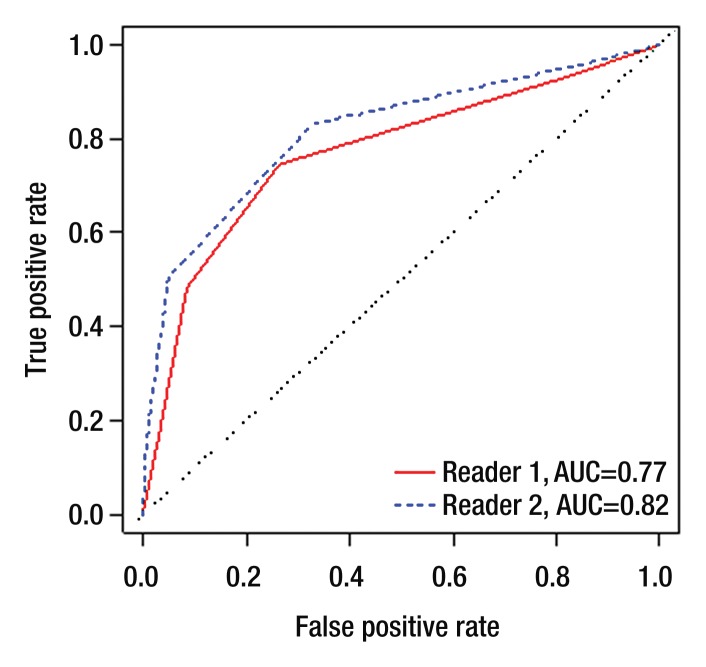
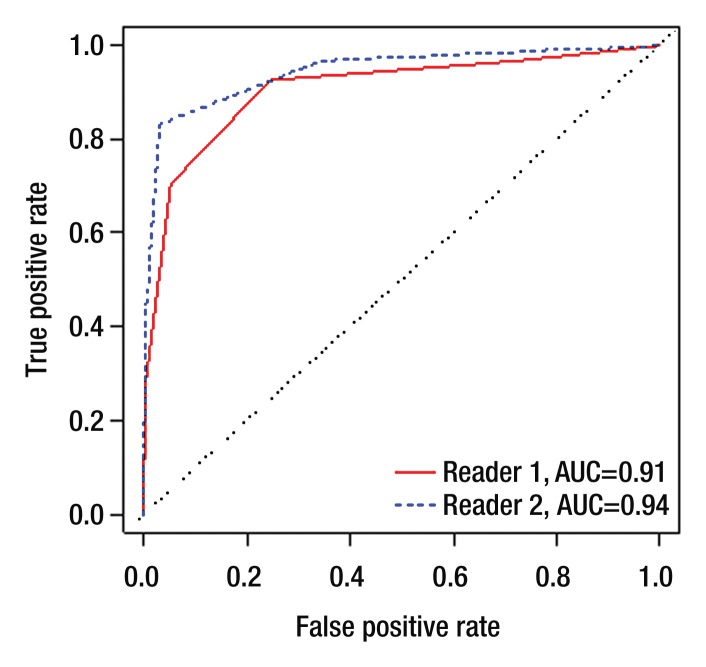
Per-sextant detection.—The interreader agreement for prostate cancer detection on T2-weighted images at the sextant level was substantial (weighted k, 0.73). Table 2 summarizes sensitivities, specificities, and positive and negative predictive values. In tumor detection at the sextant level, reader 1 achieved an AUC of 0.77 (95% CI: 0.73, 0.81), and reader 2 achieved an AUC of 0.82 (95% CI: 0.78, 0.86) (Figure 1a). When only lesions with pathologic volumes of 0.5 cm3 or greater were included in the analysis, the AUCs for readers 1 and 2 increased to 0.91 (95% CI: 0.77, 1.00) and 0.94 (95% CI: 0.80, 1.00), respectively (Fig 1b).
Table 2.
Statistics for Tumor Detection at Prostate Sextant Level with Dichotomized Readers’ Scores at MR Imaging Interpretation and Different Cutoffs

Note.—MR imaging interpretation scale was as follows: score 1, definitely absent; score 2, probably absent; score 3, indeterminate; score 4, probably present; and score 5, definitely present. NPV = negative predictive value, PPV = positive predictive value.
Figure 1a:
Empirical receiver operating characteristic curves representing tumor detection accuracy (a) at the sextant level and (b) for lesions of 0.5 cm3 or greater in volume.
Figure 1b:
Empirical receiver operating characteristic curves representing tumor detection accuracy (a) at the sextant level and (b) for lesions of 0.5 cm3 or greater in volume.
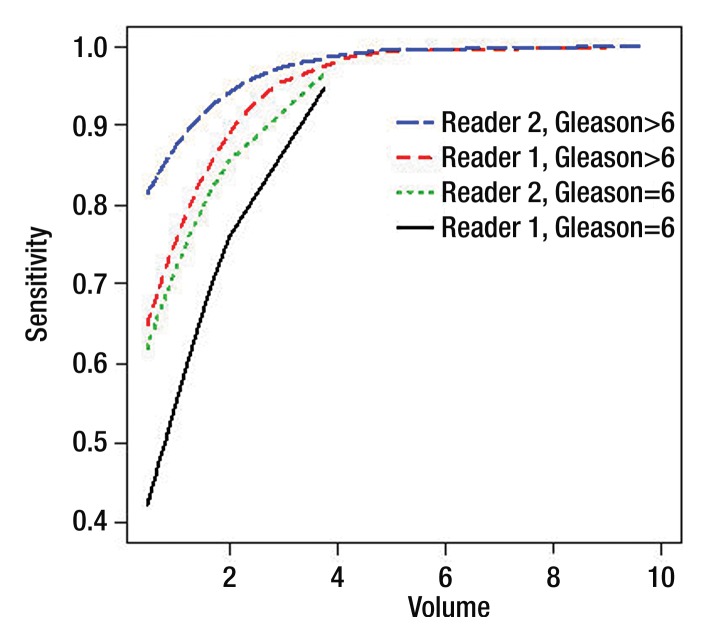
Per-lesion detection.—The sensitivity of T2-weighted imaging in detecting lesions of 0.5 cm3 or greater was significantly associated with pathologic lesion volume and Gleason score for both readers (Tables 3, 4). The sensitivity of detection was lower for lesions with a Gleason score of 6 or lower than for lesions with Gleason scores of 7 or higher (odds ratio, 3.07 [P = .01] and 3.23 [P = .03] for readers 1 and 2, respectively) (Fig 2); it was also lower for lesions of 0.5 cm3 or greater and less than1 cm3 than for lesions of 1 cm3 and greater and less than 1.5 cm3 (odds ratio, 2.66 [P = .04] and 4.18 [P = .03] for readers 1 and 2, respectively) (Tables 3, 4).
Table 3.
Associations between Sensitivity and Pathologic Volume, Sensitivity, and Gleason Score for Lesions of 0.5 cm3 or Greater
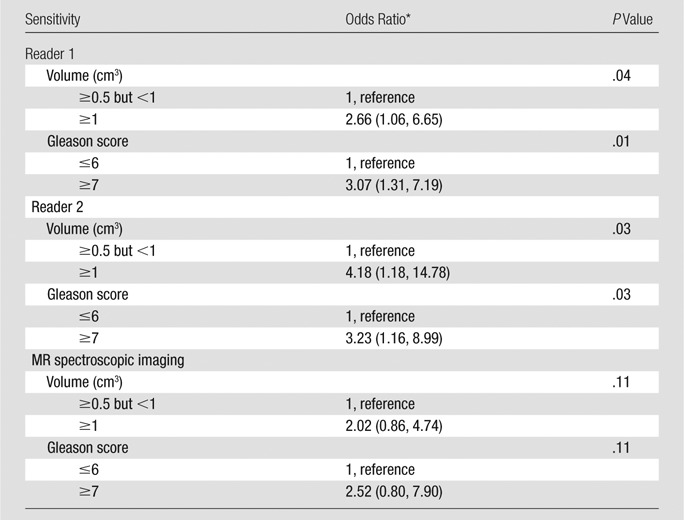
Note.—MR imaging scores were dichotomized as follows: A score of 3 or less was indicative of negative findings, and a score of 4 or greater was indicative of positive findings.
Numbers in parentheses are 95% CIs.
Table 4.
Sensitivity for the Detection of Lesions of 0.5 cm3 or Greater Stratified by Volume and Gleason Score
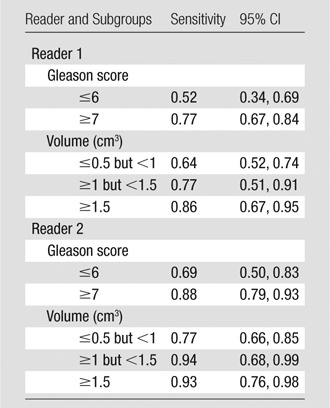
Note.—MR imaging scores were dichotomized as follows: A score of 3 or less was indicative of negative findings, and a score of 4 or greater was indicative of positive findings.
Figure 2:
Detection sensitivity estimates for lesions classified by both volume (in cubic centimeters) and Gleason score. Curves show sensitivity as a function of volume for lesions with a Gleason score of 6 and lesions with a Gleason score greater than 6 for each reader. Note that only one lesion had a volume greater than 5.2 cm3 (9.65 cm3).
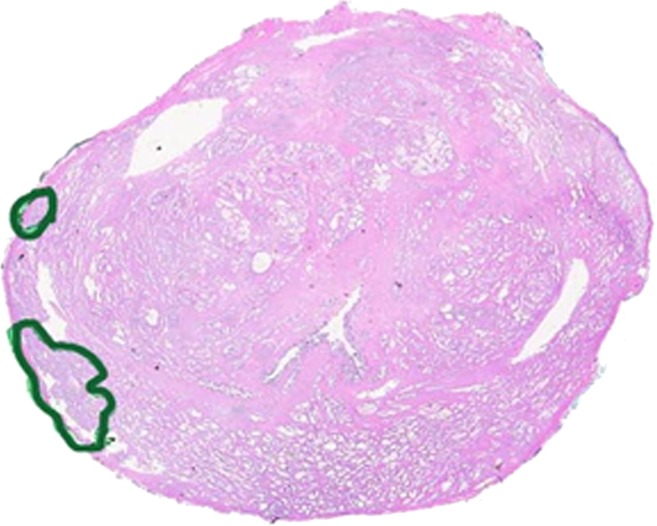
Sensitivities in the detection of lesions of 0.5 cm3 or greater grouped by both pathologic volume and Gleason score are shown in Table 5. For lesions of 0.5 cm3 or greater but less than 1 cm3, the sensitivity of detection was significantly lower when the lesion Gleason score was 6 or lower (P = .02 for reader 1; P = .05 for reader 2) (Figs 3, 4); for lesions of 1 cm3 and greater, Gleason score did not have a significant effect on sensitivity (Table 5).
Table 5.
Sensitivity Estimates for Lesions of 0.5 cm3 or Greater Stratified by Pathologic Volume and Gleason Score Simultaneously
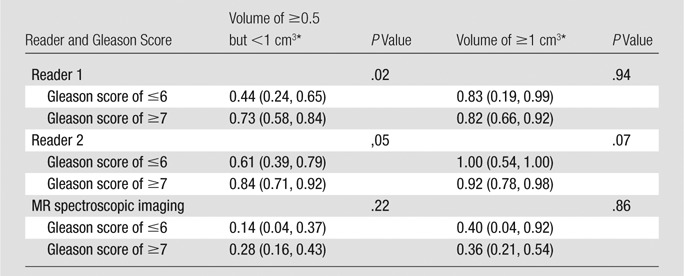
Note.—MR imaging scores were dichotomized as follows: A score of 3 or less was indicative of negative findings, and a score of 4 or greater was indicative of positive findings.
Numbers in parentheses are 95% CIs.
Figure 3a:
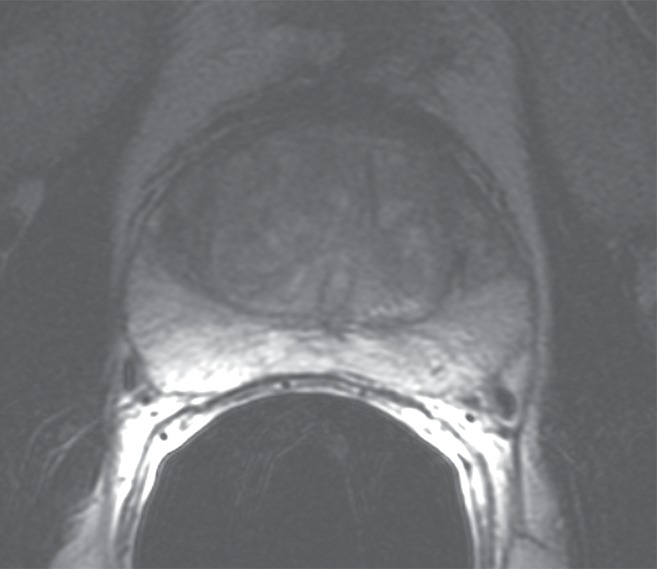
Prostate cancer in 50-year-old man. (a) On axial T2-weighted MR image (5566/112 [effective]), no definite abnormality was detected by either reader. (b) Representative image from whole-mount step-section pathologic specimen demonstrates two Gleason score 6 (3 + 3) tumor foci in the right peripheral zone (outlined in green), each with a volume less than 1 cm3. (Hematoxylin-eosin stain; original magnification, ×1.05.).
Figure 4a:
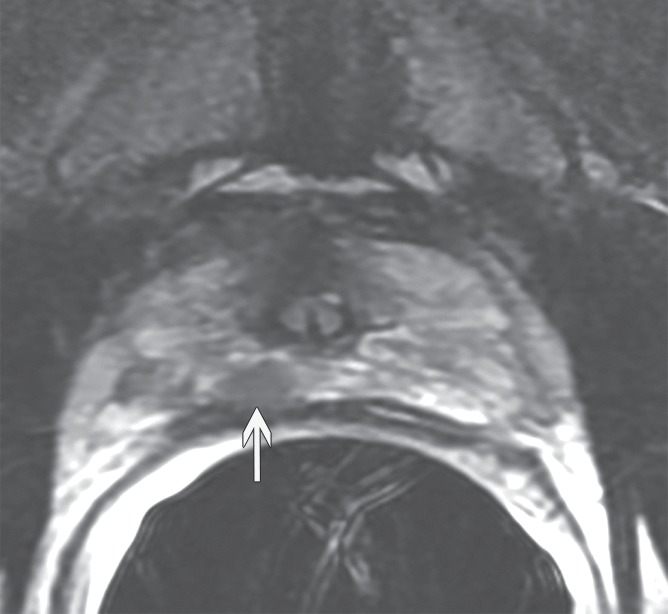
Prostate cancer in 59-year-old man. (a) Axial and (b) coronal T2-weighted MR images (6000/116 [effective]) demonstrate an area of low signal intensity in the right peripheral zone, apex, that was suspicious for tumor (arrows). (c) Representative image from whole-mount step-section pathologic specimen demonstrates a Gleason score of 7 (3 + 4) tumor in the right peripheral zone (outlined in green and black), with a volume of 0.6 cm3. (Hematoxylin-eosin stain; original magnification, ×1.05.)
Figure 3b:
Prostate cancer in 50-year-old man. (a) On axial T2-weighted MR image (5566/112 [effective]), no definite abnormality was detected by either reader. (b) Representative image from whole-mount step-section pathologic specimen demonstrates two Gleason score 6 (3 + 3) tumor foci in the right peripheral zone (outlined in green), each with a volume less than 1 cm3. (Hematoxylin-eosin stain; original magnification, ×1.05.).
Figure 4b:
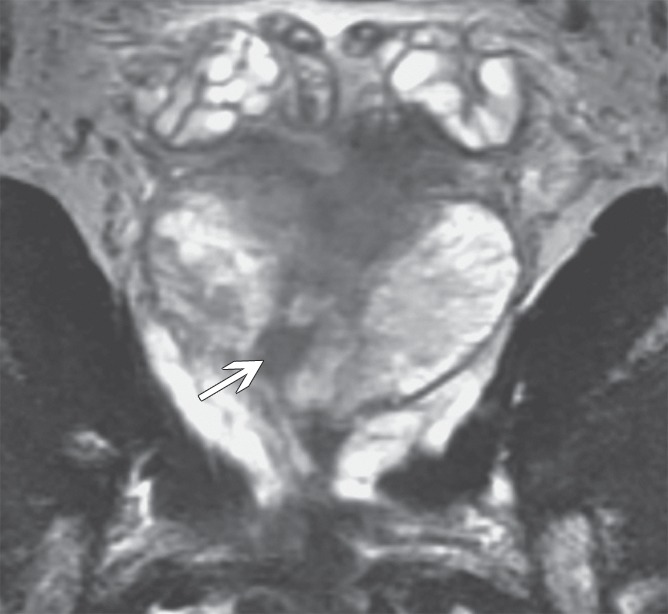
Prostate cancer in 59-year-old man. (a) Axial and (b) coronal T2-weighted MR images (6000/116 [effective]) demonstrate an area of low signal intensity in the right peripheral zone, apex, that was suspicious for tumor (arrows). (c) Representative image from whole-mount step-section pathologic specimen demonstrates a Gleason score of 7 (3 + 4) tumor in the right peripheral zone (outlined in green and black), with a volume of 0.6 cm3. (Hematoxylin-eosin stain; original magnification, ×1.05.)
Figure 4c:
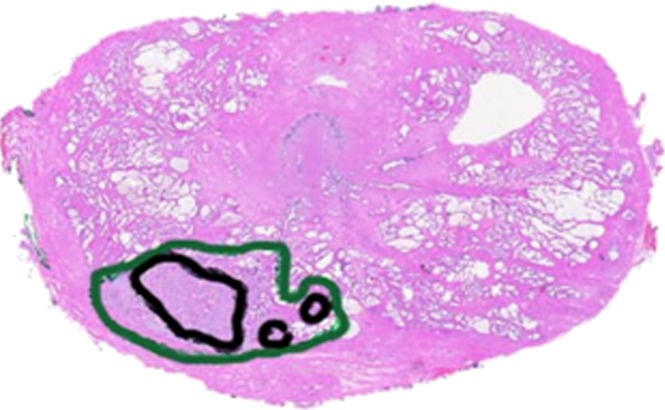
Prostate cancer in 59-year-old man. (a) Axial and (b) coronal T2-weighted MR images (6000/116 [effective]) demonstrate an area of low signal intensity in the right peripheral zone, apex, that was suspicious for tumor (arrows). (c) Representative image from whole-mount step-section pathologic specimen demonstrates a Gleason score of 7 (3 + 4) tumor in the right peripheral zone (outlined in green and black), with a volume of 0.6 cm3. (Hematoxylin-eosin stain; original magnification, ×1.05.)
The sensitivity of MR spectroscopic imaging in detecting lesions of 0.5 cm3 or greater was consistently lower than that of T2-weighted imaging and was not significantly affected by tumor volume or Gleason score (Tables 3, 5).
Detection of index lesions.—For T2-weighted imaging, sensitivities for detecting index lesions of 0.5 cm3 or greater were 0.72 (95% CI: 0.62, 0.80) for reader 1 and 0.84 (95% CI: 0.76, 0.91) for reader 2. Sensitivity increased with index lesion volume: For the detection of index lesions of 0.5 cm3 but less than 1 cm3, sensitivities were 0.66 (95% CI: 0.53, 0.78) and 0.77 (95% CI: 0.65, 0.87) for readers 1 and 2, respectively; for the detection of index lesions of 1 cm3 or greater, these values increased to 0.80 (95% CI: 0.65, 0.91) and 0.95 (95% CI: 0.83, 0.99) for readers 1 and 2, respectively. For MR spectroscopic imaging, sensitivity in detecting index lesions of 0.5 cm3 or greater was 0.27 (95% CI: 0.18, 0.37). Detection sensitivity did not differ significantly for index lesions of less than 1 cm3 (sensitivity, 0.21; 95% CI: 0.11, 0.34) and index lesions of 1 cm3 or greater (sensitivity, 0.35; 95% CI: 0.21, 0.52; P = .16).
Discussion
Our results show that in patients with clinically determined low-risk prostate cancer, tumor detection on T2-weighted images is significantly affected by both tumor volume and tumor Gleason score. For tumors of less than 1 cm3, detection was significantly lower for tumors with a Gleason score of 6 or lower than for those with a Gleason score of 7 or higher (P = .02 for reader 1; P = .05 for reader 2); for tumors of 1 cm3 or greater, tumor Gleason score did not have a significant effect on sensitivity for either reader. These findings have implications for the use of MR imaging in the management of patients with clinically low-risk prostate cancer, who now constitute about one-half of all patients diagnosed with prostate cancer in the United States (23).
Our results confirm findings from retrospective studies in smaller groups of patients, suggesting relationships between tumor grade and tumor detection with MR imaging; researchers in these smaller studies combined anatomic with metabolic and/or functional MR techniques, and the studies were not confined to patients with clinically low-risk prostate cancer (16,24,25). For example, in a retrospective study of 51 patients who underwent prostatectomy, tumors with a Gleason score of 6 or lower were found to be more difficult to detect than more aggressive tumors on both T2-weighted images and diffusion-weighted MR images, and approximately 20% of low-grade tumors were not visible on T2-weighted images, even with knowledge of tumor locations in pathologic specimens (16). In regard to the relationship between tumor volume and tumor detection, in a retrospective study of dynamic contrast material–enhanced MR imaging conducted in 24 patients, Villers et al (26) concluded that the mean volume of foci detected by using dynamic contrast-enhanced MR imaging was 1.37 cm3, whereas the mean volume of tumors not detected by using dynamic contrast-enhanced MR imaging was significantly lower, at 0.50 cm3.
To our knowledge, the only reported prospective study in which the investigators evaluated MR imaging in clinically low-risk prostate cancer included 58 consecutive patients with unilateral cancer involvement at prostate biopsy who underwent multiparametric MR imaging before surgery (27). At prostatectomy, bilateral tumor was found in 20 patients (34%). The sensitivities and specificities of T2-weighted imaging for tumor detection were 31%–72% and 68%–99%, respectively, depending on the imaging score used as a threshold to define cancer. The combination of T2-weighted imaging with qualitatively evaluated diffusion-weighted and dynamic contrast-enhanced MR imaging performed significantly better than T2-weighted imaging alone (P < .001). No attempt was made to identify associations between the diagnostic performance of MR imaging and tumor volume or Gleason score (27).
Other studies in which the researchers evaluated the use of MR imaging specifically in patients with low-risk or clinically localized prostate cancer were retrospective and analyzed different end points. Shukla-Dave et al (15) analyzed the capability of MR imaging and combined MR imaging and MR spectroscopic imaging to help predict clinically insignificant cancer at prostatectomy in 220 patients with low-risk prostate cancer (defined as clinical stage T1c or T2a, PSA level of <20 ng/mL [20 μg/L], and Gleason score of 6 at biopsy). Models incorporating clinical, biopsy, and MR data performed significantly better (AUC, 0.80–0.85) than models incorporating only clinical and biopsy data (AUC, 0.57–0.73) (15). Zhang et al (4) evaluated 158 patients with clinical stage T1c (nonpalpable) tumors who underwent combined MR imaging and MR spectroscopic imaging before prostatectomy. Two readers achieved 80% accuracy in disease staging and AUCs of 0.62 and 0.71 in predicting clinically insignificant cancer (4). In two studies, one by Ploussard et al (28) and the other by Guzzo et al (29), the researchers reported on clinically low-risk patients who opted for surgery despite being deemed eligible for active surveillance on the basis of stringent clinical, biochemical, and biopsy criteria (including 21-core biopsy in the latter study). The investigators concluded that when pretreatment MR imaging findings were dichotomized (ie, as organ-confined vs non–organ-confined or tumor present vs tumor absent), they did not improve the prediction of unfavorable features at prostatectomy in the populations studied.
In our study population, the detection sensitivity of MR spectroscopic imaging was substantially lower than that of T2-weighted imaging, as interpreted by either of the two radiologists. The low sensitivity we found for MR spectroscopic imaging in our low-risk patient population (Gleason score of 6) is consistent with an earlier article from our group (25), which showed that the sensitivity of MR spectroscopic imaging was 56% for overall tumor detection, increasing from 44% in lesions with Gleason score 6 to 89% in lesions with Gleason score 8 or greater. Thus, it appears that MR spectroscopic imaging alone is not sufficient to reliably detect prostate cancer in low-risk patients. However, as noted earlier, when combined MR imaging and MR spectroscopic imaging data were interpreted at the per-patient level, nomograms incorporating the MR imaging and MR spectroscopic imaging data with clinical variables were shown to help predict clinically insignificant cancer better than the basic clinical nomogram (15,30).
When one assesses the diagnostic performance of any imaging technique, evaluation of interobserver agreement is of paramount importance. In a prospective multicenter trial conducted by the American College of Radiology Imaging Network, eight readers evaluated the MR imaging and MR spectroscopic imaging studies of 110 patients with clinically localized disease. Although the readers had similar AUCs for tumor localization according to sextant, ranging from 0.57 to 0.63 for MR imaging alone, interobserver variability was not directly assessed (31). In other studies of prostate MR imaging, interobserver variability has been reported as a κ value or a percentage of agreement. For example, in a retrospective analysis of MR imaging for prostate cancer staging, Schiebler et al (32) reported percentages of agreement among four independent readers ranging from 57% to 80%. In the late 1980s, the Radiological Diagnostic Oncology Group conducted a prospective study of 230 patients with clinically localized (but not necessarily clinically low-risk) prostate cancer; they found interobserver variability in MR imaging interpretation was considerable, with a κ value of only 0.35 (33). We found a higher level of interreader agreement (k = 0.73), which may relate to subsequent maturation of MR imaging training and MR imaging as a modality.
The results of our study need to be viewed in the context of the wide and growing array of management options available for patients with clinically low-risk prostate cancer. No definite consensus exists in regard to the optimal management of these patients. In carefully selected low-risk patients, active surveillance has proved extremely effective, with disease-specific survival rates reported at 97%–100% after 3–10 years (34–38). The biggest challenge in deciding on active surveillance is adequate patient selection and exclusion of patients with clinically insignificant disease. Clearly, biopsy findings alone cannot be used to distinguish such patients. In accordance with results of other studies, we found that 56% of patients had tumors with a Gleason score of 7 or higher at prostatectomy (16,39,40), even though all patients had Gleason scores of 6 or lower at biopsy. Our results show that T2-weighted imaging may play a role in the selection of candidates for active surveillance among patients with clinically determined low-risk prostate cancer, by either triggering intervention (eg, surgery or radiation therapy) in patients with larger and more aggressive tumors or improving the sensitivity for detecting such tumors at subsequent biopsies by using a targeted approach.
The emerging option of focal therapy offers a way to address the clinical dilemma of overtreatment by preserving healthy tissue while maintaining local cancer control (41). Optimal methods of selecting patients suitable for focal therapies have not been defined. Our results point to a potential role for MR imaging—as well as limitations of MR imaging—in identifying the locations of prostate cancer foci in patients with clinically low-risk prostate cancer and guiding focal therapies.
Our study had several limitations. The analysis of the detection of tumors 1 cm3 or greater was limited by small sample sizes and was likely underpowered. It is certainly possible that, with a larger sample size, the estimates would change, as suggested by the wide range of the CIs. For example, for reader 2, one would need 638 patients with tumors larger than 1 cm3 (85 with a Gleason score of 6 and 553 with a Gleason score of ≥7) for the difference in sensitivity observed between these groups (0.92 vs 1.0) to be significant. For reader 1, whose detection sensitivities for these two groups of tumors were almost identical (0.83 vs 0.82), the number of patients needed to show a significance difference would be much larger. However, even if the sample size were large enough to make the differences significant, we would probably still conclude that the differences were not clinically important if the detection sensitivities stayed the same. Also, all patients were imaged with 1.5-T systems by using conventional T1- and T2-weighted sequences. At present, MR imaging at 3 T is often considered state of the art. Furthermore, the current state-of-the-art approach to prostate MR imaging is multiparametric and involves the incorporation of advanced techniques, such as diffusion-weighted and dynamic contrast-enhanced imaging. Although these advanced techniques are now part of the standard prostate MR imaging protocol at our institution, at the time this prospective trial was designed and initiated (2005), such multiparametric imaging had not been widely introduced into clinical practice. According to the International Conference for Harmonisation Guidelines for Good Clinical Practice (42), adherence to the study protocol in prospective trials is essential. The need to maintain consistent inclusion criteria, regardless of changing trends in research and practice, is a limitation inherent to the prospective nature of clinical trials. Of note, not only are most MR imaging examinations still performed with 1.5-T systems, but 1.5-T systems continue to make up most of the newly installed MR imaging units in the United States (43). In addition, conventional T2-weighted sequences remain the cornerstone of the prostate imaging examination. Future clinical trials will be needed to assess the incremental value of multiparametric techniques to conventional MR imaging—something that has not yet been done in a large prospective trial.
We also wish to acknowledge that this prospective trial accrued patients over a 4-year period, and although no major changes in hardware occurred during that period, variations that could have resulted from minor improvements (eg, software or coil upgrades) have not been accounted for. Furthermore, although we used standard MR imaging equipment and imaging protocols, easily reproducible elsewhere, this trial was conducted at a single institution. Finally, both readers involved in this study had substantial experience interpreting prostate MR images, the accuracy of which has been shown to improve with reader training and experience (44). We anticipate that, with increasing acceptance of MR imaging in the evaluation of prostate cancer, both the quality of training and readers’ experience in prostate MR image interpretation will increase at other centers.
In summary, in men with clinically low-risk prostate cancer, detection of lesions of less than 1 cm3 with T2-weighted imaging is significantly dependent on lesion Gleason score, while detection of lesions of 1 cm3 or greater is significantly better than detection of smaller lesions and is not affected by lesion Gleason score. The role of MR spectroscopic imaging alone in this patient population is limited. Our findings have important implications for the use of MR imaging in treatment decision making in men with clinically low-risk disease, and especially for men considered potential candidates for active surveillance and emerging focal therapies.
Advances in Knowledge.
• In men with clinically determined low-risk prostate cancer, detection of lesions smaller than 1 cm3 with T2-weighted MR imaging is significantly dependent on lesion Gleason score (sensitivities of 0.44 [reader 1] and 0.61 [reader 2] for Gleason scores ≤6 vs 0.73 [reader 1] and 0.84 [reader 2] for Gleason scores ≥7; P ≤ .05); detection of lesions 1 cm3 or larger is not significantly affected by lesion Gleason score (sensitivities of 0.83 [reader 1] and 1.00 [reader 2] for lesions with Gleason scores ≤6 vs 0.82 [reader 1] and 0.92 [reader 2] for lesions with Gleason scores ≥7; P ≥ .07).
• In men with clinically determined low-risk prostate cancer, MR spectroscopic imaging sensitivity for lesion detection is low (0.40 at best) and is neither lesion volume nor lesion Gleason score dependent.
Implication for Patient Care.
• Tumors with volumes of less than 1 cm3 and Gleason scores of 6 or lower cannot be reliably detected at prostate T2-weighted MR imaging or MR spectroscopic imaging; however, prostate T2-weighted MR imaging can be used to guide the management of patients with lesions of 1 cm3 or larger and any Gleason score and patients with lesions of 0.5 cm3 or larger and a Gleason score of 7 or higher.
Disclosures of Conflicts of Interest: H.A.V. No relevant conflicts of interest to disclose. O.A. No relevant conflicts of interest to disclose. A.S. No relevant conflicts of interest to disclose. J. Zhang No relevant conflicts of interest to disclose. K.L.Z. No relevant conflicts of interest to disclose. J. Zheng No relevant conflicts of interest to disclose. K.K. No relevant conflicts of interest to disclose. D.A.G. No relevant conflicts of interest to disclose. C.S.M. No relevant conflicts of interest to disclose. V.E.R. Financial activities related to the present article: none to disclose. Financial activities not related to the present article: institution received a grant or has a grant pending from TCGA; author receives royalties for Diagnostic Surgical Pathology. Other relationships: none to disclose. J.A.E. No relevant conflicts of interest to disclose. P.T.S. Financial activities related to the present article: none to disclose. Financial activities not related to the present article: author received consultancy fees from Steba Biotech (focal therapy), institution received philanthropic funds from the Skirball Foundation for research on focal treatment of prostate cancer. Other relationships: none to disclose. H.H. No relevant conflicts of interest to disclose.
Acknowledgments
We are grateful to Ada Muellner, MS, for editing this manuscript.
Received January 6, 2012; revision requested February 13; final revision received May 2; accepted May 17; final version accepted May 24. H.A.V. supported by the Peter Michael Foundation.
Funding: This research was supported by the National Institutes of Health (grant R01 CA76423).
Abbreviations:
- AUC
- area under the receiver operating characteristic curve
- CI
- confidence interval
- PSA
- prostate-specific antigen
References
- 1.Polascik TJ, Oesterling JE, Partin AW. Prostate specific antigen: a decade of discovery—what we have learned and where we are going. J Urol 1999;162(2):293–306 [DOI] [PubMed] [Google Scholar]
- 2.Cooperberg MR, Lubeck DP, Meng MV, Mehta SS, Carroll PR. The changing face of low-risk prostate cancer: trends in clinical presentation and primary management. J Clin Oncol 2004;22(11):2141–2149 [DOI] [PMC free article] [PubMed] [Google Scholar]
- 3.Harnden P, Naylor B, Shelley MD, Clements H, Coles B, Mason MD. The clinical management of patients with a small volume of prostatic cancer on biopsy: what are the risks of progression? a systematic review and meta-analysis. Cancer 2008;112(5):971–981 [DOI] [PubMed] [Google Scholar]
- 4.Zhang J, Hricak H, Shukla-Dave A, et al. Clinical stage T1c prostate cancer: evaluation with endorectal MR imaging and MR spectroscopic imaging. Radiology 2009;253(2):425–434 [DOI] [PMC free article] [PubMed] [Google Scholar]
- 5.Epstein JI, Walsh PC, Carmichael M, Brendler CB. Pathologic and clinical findings to predict tumor extent of nonpalpable (stage T1c) prostate cancer. JAMA 1994;271(5):368–374 [PubMed] [Google Scholar]
- 6.Stamey TA, Caldwell M, McNeal JE, Nolley R, Hemenez M, Downs J. The prostate specific antigen era in the United States is over for prostate cancer: what happened in the last 20 years? J Urol 2004;172(4 pt 1):1297–1301 [DOI] [PubMed] [Google Scholar]
- 7.Shariat SF, Kattan MW, Vickers AJ, Karakiewicz PI, Scardino PT. Critical review of prostate cancer predictive tools. Future Oncol 2009;5(10):1555–1584 [DOI] [PMC free article] [PubMed] [Google Scholar]
- 8.Ahmed HU, Akin O, Coleman JA, et al. Transatlantic Consensus Group on active surveillance and focal therapy for prostate cancer. BJU Int 2012;109(11):1636–1647 [DOI] [PMC free article] [PubMed] [Google Scholar]
- 9.Wise AM, Stamey TA, McNeal JE, Clayton JL. Morphologic and clinical significance of multifocal prostate cancers in radical prostatectomy specimens. Urology 2002;60(2):264–269 [DOI] [PubMed] [Google Scholar]
- 10.Ahmed HU, Pendse D, Illing R, Allen C, van der Meulen JH, Emberton M. Will focal therapy become a standard of care for men with localized prostate cancer? Nat Clin Pract Oncol 2007;4(11):632–642 [DOI] [PubMed] [Google Scholar]
- 11.Akin O, Hricak H. Imaging of prostate cancer. Radiol Clin North Am 2007;45(1):207–222 [DOI] [PubMed] [Google Scholar]
- 12.Kirkham AP, Emberton M, Allen C. How good is MRI at detecting and characterising cancer within the prostate? Eur Urol 2006;50(6):1163–1174; discussion 1175 [DOI] [PubMed] [Google Scholar]
- 13.Nogueira L, Wang L, Fine SW, et al. Focal treatment or observation of prostate cancer: pretreatment accuracy of transrectal ultrasound biopsy and T2-weighted MRI. Urology 2010;75(2):472–477 [DOI] [PMC free article] [PubMed] [Google Scholar]
- 14.Raz O, Haider M, Trachtenberg J, Leibovici D, Lawrentschuk N. MRI for men undergoing active surveillance or with rising PSA and negative biopsies. Nat Rev Urol 2010;7(10):543–551 [DOI] [PubMed] [Google Scholar]
- 15.Shukla-Dave A, Hricak H, Kattan MW, et al. The utility of magnetic resonance imaging and spectroscopy for predicting insignificant prostate cancer: an initial analysis. BJU Int 2007;99(4):786–793 [DOI] [PubMed] [Google Scholar]
- 16.Vargas HA, Akin O, Franiel T, et al. Diffusion-weighted endorectal MR imaging at 3 T for prostate cancer: tumor detection and assessment of aggressiveness. Radiology 2011;259(3):775–784 [DOI] [PMC free article] [PubMed] [Google Scholar]
- 17.Wang L, Mullerad M, Chen HN, et al. Prostate cancer: incremental value of endorectal MR imaging findings for prediction of extracapsular extension. Radiology 2004;232(1):133–139 [DOI] [PubMed] [Google Scholar]
- 18.Wang L, Hricak H, Kattan MW, Chen HN, Scardino PT, Kuroiwa K. Prediction of organ-confined prostate cancer: incremental value of MR imaging and MR spectroscopic imaging to staging nomograms. Radiology 2006;238(2):597–603 [DOI] [PubMed] [Google Scholar]
- 19.Hricak H, Choyke PL, Eberhardt SC, Leibel SA, Scardino PT. Imaging prostate cancer: a multidisciplinary perspective. Radiology 2007;243(1):28–53 [DOI] [PubMed] [Google Scholar]
- 20.Akin O, Sala E, Moskowitz CS, et al. Transition zone prostate cancers: features, detection, localization, and staging at endorectal MR imaging. Radiology 2006;239(3):784–792 [DOI] [PubMed] [Google Scholar]
- 21.Landis JR, Koch GG. The measurement of observer agreement for categorical data. Biometrics 1977;33(1):159–174 [PubMed] [Google Scholar]
- 22.Fleiss JL, Cohen J, Everitt BS. Large-sample standard errors of kappa and weighted kappa. Psychol Bull 1969;72(5):323–327 [Google Scholar]
- 23.Cooperberg MR, Broering JM, Kantoff PW, Carroll PR. Contemporary trends in low risk prostate cancer: risk assessment and treatment. J Urol 2007;178(3 Pt 2):S14–S19 [DOI] [PMC free article] [PubMed] [Google Scholar]
- 24.Turkbey B, Shah VP, Pang Y, et al. Is apparent diffusion coefficient associated with clinical risk scores for prostate cancers that are visible on 3-T MR images? Radiology 2011;258(2):488–495 [DOI] [PMC free article] [PubMed] [Google Scholar]
- 25.Zakian KL, Sircar K, Hricak H, et al. Correlation of proton MR spectroscopic imaging with Gleason score based on step-section pathologic analysis after radical prostatectomy. Radiology 2005;234(3):804–814 [DOI] [PubMed] [Google Scholar]
- 26.Villers A, Puech P, Leroy X, Biserte J, Fantoni JC, Lemaitre L. Dynamic contrast-enhanced MRI for preoperative identification of localised prostate cancer. Eur Urol Suppl 2007;6(8):525–532 [Google Scholar]
- 27.Delongchamps NB, Beuvon F, Eiss D, et al. Multiparametric MRI is helpful to predict tumor focality, stage, and size in patients diagnosed with unilateral low-risk prostate cancer. Prostate Cancer Prostatic Dis 2011;14(3):232–237 [DOI] [PubMed] [Google Scholar]
- 28.Ploussard G, Xylinas E, Durand X, et al. Magnetic resonance imaging does not improve the prediction of misclassification of prostate cancer patients eligible for active surveillance when the most stringent selection criteria are based on the saturation biopsy scheme. BJU Int 2011;108(4):513–517 [DOI] [PubMed] [Google Scholar]
- 29.Guzzo TJ, Resnick MJ, Canter DJ, et al. Endorectal T2-weighted MRI does not differentiate between favorable and adverse pathologic features in men with prostate cancer who would qualify for active surveillance. Urol Oncol 2012;30(3):301–305 [DOI] [PubMed] [Google Scholar]
- 30.Shukla-Dave A, Hricak H, Akin O, et al. Preoperative nomograms incorporating magnetic resonance imaging and spectroscopy for prediction of insignificant prostate cancer. BJU Int 2012;109(9):1315–1322 [DOI] [PMC free article] [PubMed] [Google Scholar]
- 31.Weinreb JC, Blume JD, Coakley FV, et al. Prostate cancer: sextant localization at MR imaging and MR spectroscopic imaging before prostatectomy—results of ACRIN prospective multi-institutional clinicopathologic study. Radiology 2009;251(1):122–133 [DOI] [PMC free article] [PubMed] [Google Scholar]
- 32.Schiebler ML, Yankaskas BC, Tempany C, et al. MR imaging in adenocarcinoma of the prostate: interobserver variation and efficacy for determining stage C disease. AJR Am J Roentgenol 1992;158(3):559–562; discussion 563–564 [DOI] [PubMed] [Google Scholar]
- 33.Rifkin MD, Zerhouni EA, Gatsonis CA, et al. Comparison of magnetic resonance imaging and ultrasonography in staging early prostate cancer. Results of a multi-institutional cooperative trial. N Engl J Med 1990;323(10):621–626 [DOI] [PubMed] [Google Scholar]
- 34.Dall’Era MA, Konety BR, Cowan JE, et al. Active surveillance for the management of prostate cancer in a contemporary cohort. Cancer 2008;112(12):2664–2670 [DOI] [PubMed] [Google Scholar]
- 35.Klotz L, Zhang L, Lam A, Nam R, Mamedov A, Loblaw A. Clinical results of long-term follow-up of a large, active surveillance cohort with localized prostate cancer. J Clin Oncol 2010;28(1):126–131 [DOI] [PubMed] [Google Scholar]
- 36.Roemeling S, Roobol MJ, de Vries SH, et al. Active surveillance for prostate cancers detected in three subsequent rounds of a screening trial: characteristics, PSA doubling times, and outcome. Eur Urol 2007;51(5):1244–1250; discussion 1251 [DOI] [PubMed] [Google Scholar]
- 37.Soloway MS, Soloway CT, Eldefrawy A, Acosta K, Kava B, Manoharan M. Careful selection and close monitoring of low-risk prostate cancer patients on active surveillance minimizes the need for treatment. Eur Urol 2010;58(6):831–835 [DOI] [PubMed] [Google Scholar]
- 38.van den Bergh RC, Roemeling S, Roobol MJ, et al. Outcomes of men with screen-detected prostate cancer eligible for active surveillance who were managed expectantly. Eur Urol 2009;55(1):1–8 [DOI] [PubMed] [Google Scholar]
- 39.Cookson MS, Fleshner NE, Soloway SM, Fair WR. Correlation between Gleason score of needle biopsy and radical prostatectomy specimen: accuracy and clinical implications. J Urol 1997;157(2):559–562 [PubMed] [Google Scholar]
- 40.Steinberg DM, Sauvageot J, Piantadosi S, Epstein JI. Correlation of prostate needle biopsy and radical prostatectomy Gleason grade in academic and community settings. Am J Surg Pathol 1997;21(5):566–576 [DOI] [PubMed] [Google Scholar]
- 41.Lindner U, Lawrentschuk N, Schatloff O, Trachtenberg J, Lindner A. Evolution from active surveillance to focal therapy in the management of prostate cancer. Future Oncol 2011;7(6):775–787 [DOI] [PubMed] [Google Scholar]
- 42.International Conference on Harmonisation of Technical Requirements for Registration of Pharmaceuticals for Human Use (ICH) ICH Harmonised tripartite guideline. Guideline for good clinical practice E6(R1). Step 4 version, June 10, 1996. http://www.ich.org/products/guidelines/efficacy/article/efficacy-guidelines.html. Accessed March 20, 2012
- 43.IMV Medical Information Division 2010 MR Market Outlook Report; March 31, 2011. Des Plaines, Ill: IMV Medical Information Division, 2011 [Google Scholar]
- 44.Akin O, Riedl CC, Ishill NM, Moskowitz CS, Zhang J, Hricak H. Interactive dedicated training curriculum improves accuracy in the interpretation of MR imaging of prostate cancer. Eur Radiol 2010;20(4):995–1002 [DOI] [PMC free article] [PubMed] [Google Scholar]


