

Abstract
Molecular docking is widely used to obtain binding modes and binding affinities of a molecule to a given target protein. Despite considerable efforts, however, prediction of both properties by docking remains challenging mainly due to protein’s structural flexibility and inaccuracy of scoring functions. Here, an integrated approach has been developed to improve the accuracy of binding mode and affinity prediction, and tested for small molecule MDM2 and MDMX antagonists. In this approach, initial candidate models selected from docking are subjected to equilibration MD simulations to further filter the models. Free energy perturbation molecular dynamics (FEP/MD) simulations are then applied to the filtered ligand models to enhance the ability in predicting the near-native ligand conformation. The calculated binding free energies for MDM2 complexes are overestimated compared to experimental measurements mainly due to the difficulties in sampling highly flexible apo-MDM2. Nonetheless, the FEP/MD binding free energy calculations are more promising for discriminating binders from nonbinders than docking scores. In particular, the comparison between the MDM2 and MDMX results suggests that apo-MDMX has lower flexibility than apo-MDM2. In addition, the FEP/MD calculations provide detailed information on the different energetic contributions to ligand binding, leading to a better understanding of the sensitivity and specificity of protein-ligand interactions.
Keywords: Molecular dynamics simulation, free energy perturbation, protein-protein interaction, docking, computer-aided drug design
INTRODUCTION
Accurate characterization of ligand binding mode and affinity to a target receptor is essential for rational drug design with optimized sensitivity and specificity. A receptor-ligand complex structure provides atomic-level descriptions of molecular recognition between them. However, it is often elusive to make quantitative correlations between protein-ligand structures and their binding affinities. Therefore, various computational tools have become crucial components in drug discovery projects, although accurate prediction of ligand binding mode and affinity remains challenging mainly due to protein’s structural flexibility and inaccuracy of scoring functions.1,2
When a high-resolution structure of a protein target is available, molecular docking is a typical choice to predict the bound-conformation of a given small molecule in the target. In general, a ligand pose is finally selected in terms of a docking score that represents the binding affinity. There are a number of docking programs currently available (e.g., AutoDock,3 AutoDock Vina,4 DOCK,5 FlexX,6 GLIDE,7 GOLD,8 ICM,9 Surflex10) and new programs with advanced docking algorithms and scoring systems are constantly being developed.
Many studies have evaluated the available docking programs to assess their ability in reproducing a ligand pose close to that found in an X-ray structure. The docking programs are able to reproduce ligand poses when a ligand is re-docked into a ligand-binding site whose conformation was determined in the presence of the identical ligand (so-called cognate-receptor docking). The best performing docking programs such as ICM and GLIDE yielded the top scoring pose with root mean squared deviations (RMSDs) of less than 2.0 Å for 72.1% and 69.1% of the tested complexes for cognate-receptor docking.11 Noncognate-receptor docking, where a small molecule is docked into a receptor whose conformation was determined without ligands or with a structurally different ligand, is more practical, but the pose prediction accuracy is severely deteriorated. Widely-used programs typically show about 20% success rates in noncognate-receptor docking,12 which results from difficulties in incorporating receptor flexibility. The cognate- and noncognate-receptor docking results indicate that the pose selection algorithms adopted in current docking programs can be unsatisfactory in accurate prediction of near-native ligand poses, suggesting the need of alternative approaches.
Free energy perturbation molecular dynamics (FEP/MD) simulations can be a promising, alternative approach to quantitatively estimate absolute binding free energies of ligands with explicit treatments of solvent and natural handling of protein flexibility.13,14 Nonetheless, high computational costs of the FEP/MD method have impeded its wide application. In order to tackle the computational cost issue, intermediate approaches have been utilized, in which explicit solvent molecules are only considered in a small region of interest, and the influence of the surrounding solvent is represented with an effective solvent-boundary potential.15,16 In addition, to enhance the conformational sampling and to facilitate the calculation convergence, various restraint potentials are applied for orientational, translational, and conformational degrees of freedom of the ligand, and their biasing effects are removed rigorously at the end of simulations. Indeed, recent calculations for some benchmark sets have shown that the FEP/MD calculations based on crystal structures reliably reproduced the experimental ligand binding free energies at moderate computational costs.17–19 It is expected that the FEP/MD calculations could become a critical approach to accurately predict binding affinities in drug design projects.
In this study, we propose an integrated computational protocol combining docking, pose clustering, equilibration MD, and FEP/MD binding free energy calculations for accurate characterization of ligand binding mode and binding affinity. To illustrate its efficacy, the integrated approach is applied to the small-molecular-weight antagonists of MDM2 and MDMX that inhibit the protein-protein interactions (PPI) between the transactivation domain of p53 and MDM2/X (see MATERIALS AND METHODS for more information on p53-MDM2/X interactions). Applying advanced computational methodologies to PPI-inhibitor/receptor systems will be a valuable approach in PPI-based drug discovery fields that are recently gaining more attention as new drug targets.20–22 In the following, the computational methodologies and theory are first presented. Based on detailed comparisons of the calculated binding free energies with experimental measurements, the advantages and disadvantages of current FEP/MD calculations as well as inherent differences in MDM2 and MDMX protein dynamics are also discussed.
MATERIALS AND METHODS
Selection of test systems
The p53 protein acts as a transcription factor regulating a variety of genes involved in cell cycle arrest, DNA repair, senescence, and apoptosis.22,23 Because p53 is an essential mediator required for suppression of cancer development, its loss of function is involved in many human cancers. The p53 pathway is inactivated by MDM2 and its close homolog MDMX proteins through direct binding between the transactivation domain of p53 and MDM2 or MDMX.23 In addition, MDM2 induces p53 ubiquitination and thus promotes p53 degradation.24 It has been known that MDMX acts independently, but functions as an integral complex with MDM2 in p53 control.25 The crystal structures of MDM2 and MDMX in complex with a helical peptide from the transactivation domain of p5326,27 have revealed that MDM2 and MDMX possess a relatively deep hydrophobic pocket that is occupied primarily by three side chains from the p53 helix. Recently, low-molecular weight antagonists of MDM2 and MDMX with biologically potent activity have been reported along with their structures.28–31
All available crystal structures of MDM2 and MDMX in complex with small ligands were taken from the Protein Data Bank (PDB, http://www.rcsb.org/pdb). The collected set consists of five MDM2 structures and one MDMX structure, each containing structurally different ligands. We excluded MDM2 with MI-63-analog inhibitor (PDB entry: 3LBL) because a part of the ligand structure was not determined. The crystal structures of MDM2 and MDMX with the p53 transactivation domain peptide were also taken from the PDB for noncognate-receptor docking experiments. The final test set is listed in Table 1, and the ligand structures in the test set are shown in Figure 1.
Table 1.
Test set used in this study
| Protein | Small ligand-bound structure
|
Peptide-bound structure
|
RMSD (Å)b
|
||||
|---|---|---|---|---|---|---|---|
| System | PDB | Ligand | PDB | Ligand | Cα atoms | All atoms | |
| MDM2 | T-1 | 1RV1 | IMZ | 1YCR | p53 TDa | 0.87 | 1.56 |
| T-2 | 1T4E | DIZ | 0.78 | 1.35 | |||
| T-3 | 3JZK | YIN | 0.75 | 1.44 | |||
| T-4 | 3LBK | K23 | 0.74 | 1.42 | |||
|
| |||||||
| MDMX | X-1 | 3LBJ | WW8 | 3DAB | p53 TD | 0.59 | 1.41 |
| Avg. | 0.75 | 1.44 | |||||
Transactivation domain peptide.
RMSD of the binding-site residues in the small ligand-bound receptor to those in the peptide-bound receptor; the binding-site residues are defined by a distance cut of 4 Å from any atoms of the small ligand.
Figure 1.

Ligand structures used in this study (Table 1): IMZ in system T-1 (PDB:1RV1), DIZ in system T-2 (PDB:1T4E), YIN in system T-3 (PDB:3JZK), K23 in system T-4 (PDB:3LBK), and WW8 in system X-1 (PDB:3LBJ).
Molecular docking
AutoDock Vina4 was used for virtual ligand docking. Maestro32 was used to assign the bond orders of the ligands and to add hydrogen atoms. Preprocessing of ligand and receptor structures for the docking experiments was implemented using Raccoon.33 The cognate-receptor docking experiments were performed within a cubic box with a length of 20 Å centered at the geometric center of each ligand. For the noncognate-receptor docking experiments, the receptor structures with the p53 transactivation domain peptide were first superposed onto each protein-ligand structure, and the same box center as in the cognate docking experiments was used. The ligand conformations extracted from the PDB files were randomized to avoid the bias of ligand conformation sampling towards the experimental structure during docking. Twenty independent docking runs were implemented with different random seed numbers to obtain 400 pose decoys of each ligand docked into both its cognate receptor conformation (cognate-receptor docking) and the p53-bound conformation (noncognate-receptor docking).
Structure models and equilibration MD simulations
All MD simulations were carried out with the CHARMM program.34 The template input files for equilibration MD simulations were generated through Quick MD Simulator in CHARMM-GUI (http://www.charmm-gui.org/input/mdsetup).35
The CHARMM2236,37 and CHARMM General Force Field (CGenFF)38 were used for the proteins and the ligands, respectively. The TIP3P model was used for explicit water molecules. All bonds involving hydrogen atoms were fixed with the SHAKE algorithm.39 The integration time-step was 2 fs. The van der Waals interactions were smoothly switched off at 10–12 Å by a force-switching function, and the electrostatic interactions were calculated using the particle-mesh Ewald method40 with a sixth-order B-spline interpolation for a grid of 72 × 72 × 72. The initial structures were solvated in a 64 × 64 × 64 Å3 water box with 150 mM KCl, and were minimized for 1,000 steps using the steepest descent method followed by 1,000 steps using the adopted basis Newton-Raphson method. NVT (constant volume and temperature) dynamics at 300 K was carried out for 100 ps to relax the water molecules and ions with positional restraints on protein Cα atoms and ligand heavy atoms with a harmonic force constant of 1.0 kcal/(mol·Å2). Starting from the equilibrated structure, 300-ps CPT (constant pressure and temperature) dynamics at 300 K were carried out without any restraints. The pressure was kept constant at 1.0 atm using the Langevin piston method41 with a piston collision frequency of 20 ps−1. The temperature was held at 300 K with the Nose-Hoover thermostat.42 The average ligand structure of the last 100-ps was used as the reference conformation to apply translation and conformation restraints to the ligand for the FEP/MD calculations.
FEP/MD calculations
The FEP/MD calculations are based on the theory and protocol described previously.17–19 The current study is also based on input files generated by CHARMM-GUI Ligand Binder (http://www.charmm-gui.org/input/gbinding), which provides the standardized FEP/MD inputs for protein-ligand absolute binding free energy calculations. The theory and protocol for the FEP/MD calculations used in this study are briefly described in the Supporting Information.
To reduce the system size of the FEP/MD simulations, the generalized solvent boundary potential (GSBP)16 and the spherical solvent boundary potential (SSBP)15 were used for the FEP/MD calculations in the binding site and the bulk solution, respectively. The radius of the spherical inner region of GSBP and SSBP was set to 18 Å from the center of mass of each ligand, which was at least 10 Å larger than the extents of each ligand. In the current scheme, the FEP/MD calculations are divided into 137 independent simulations (see Supporting Information) and we carried out 10 cycles of each simulation for better convergence. Each cycle consisted of 10-ps equilibration and 100-ps production for repulsive, dispersive, and electrostatic contributions, 10-ps equilibration and 40-ps production for translational/rotational contributions, and 100-ps production for ligand conformational contribution. Each cycle was started using the last coordinates of the previous cycle with random initial velocities. The free energy values and the errors were presented using the average and the standard deviation of the last five cycles, respectively.
RESULTS AND DISCUSSION
Optimizing initial pose-selection method
Many docking programs use various clustering methods to reduce the number of similar decoy conformations generated from docking calculations. In this study, we examined four different clustering/pose-selection methods to obtain a minimal number of most probable docking models (poses) for subsequent equilibration MD simulations and the FEP/MD calculations.
Method 1
Top N poses are selected from decoy conformations sorted by their scores without clustering.
Method 2
Decoy conformations are clustered by the average linkage clustering algorithm43 using an RMSD tolerance value of 2 Å and then sorted by the best docking score of each cluster. Top N poses are selected from the best-scored pose in each of the top N clusters.
Method 3
Decoy conformations are clustered by the same algorithm as in Method 2 and then sorted by the cluster size. Top N poses are selected from the best-scored pose in each of the top N clusters.
Method 4
Decoy conformations are clustered by the same algorithm as in Method 2 and then sorted by the cluster size. Top N poses are selected from the centroid pose in each of the top N clusters.
The performance of each pose-selection method is summarized in Table 2. For N = 1, in the cognate-receptor docking experiments, Methods 1 and 2 based on the best-scored poses yielded native-like ligand conformations with RMSDnat below 2.0 Å except for ligand X-1 (see Table 1 for system names); RMSDnat represents the RMSD of a docked ligand from its native pose. For the noncognate-receptor docking, however, both methods failed to yield a pose with an RMSDnat below 2.0 Å for T-4 and X-1. This result indicates the difficulties in obtaining proper rank ordering based on the docking score, particularly when a noncognate-receptor conformation is used for docking experiments. While it has been documented that near-native poses can be well mimicked from the best-scored pose within the largest cluster of docking decoys (Method 3),44 our results show that for the MDM2/X complexes, the best-scored pose in the largest cluster did not present near-native poses. The average RMSDnat were 6.25 and 5.70 Å for cognate- and noncognate-receptor docking, respectively. Similarly, the centroid poses of the largest cluster (Method 4) did not correspond to any near-native poses.
Table 2.
Evaluation of four different pose-selection methods (for docking decoys) in terms of the RMSD (Å) of a docked ligand from its native posea
| Method
|
|||||||||
|---|---|---|---|---|---|---|---|---|---|
|
|
1
|
2
|
3
|
4
|
|||||
| Top N | Ligand | cog | ncog | cog | ncog | cog | ncog | cog | ncog |
| 1 | T-1 | 0.86 | 1.28 | 0.86 | 1.28 | 5.94 | 7.15 | 6.73 | 7.99 |
| T-2 | 0.81 | 1.90 | 0.81 | 1.90 | 4.63 | 4.83 | 4.54 | 4.83 | |
| T-3 | 0.19 | 1.20 | 0.19 | 1.20 | 6.84 | 5.61 | 7.25 | 6.08 | |
| T-4 | 0.58 | 5.49 | 0.58 | 5.49 | 5.75 | 5.49 | 5.68 | 5.49 | |
| X-1 | 8.09 | 7.08 | 8.09 | 7.08 | 8.09 | 5.43 | 8.11 | 6.08 | |
|
|
|
|
|
||||||
| Avg. | 2.11 | 3.39 | 2.11 | 3.39 | 6.25 | 5.70 | 6.46 | 6.09 | |
| 5 | T-1 | 0.85 | 1.27 | 0.86 | 1.28 | 0.86 | 1.28 | 0.85 | 1.28 |
| T-2 | 0.81 | 1.90 | 0.81 | 1.90 | 0.81 | 1.90 | 0.81 | 1.89 | |
| T-3 | 0.19 | 1.20 | 0.19 | 1.20 | 0.19 | 1.20 | 0.20 | 1.21 | |
| T-4 | 0.58 | 5.49 | 0.58 | 0.59 | 0.58 | 0.59 | 0.59 | 0.68 | |
| X-1 | 8.06 | 4.44 | 5.42 | 4.45 | 2.02 | 4.45 | 0.48 | 4.46 | |
|
|
|
|
|
||||||
| Avg. | 2.10 | 2.86 | 1.57 | 1.88 | 0.89 | 1.88 | 0.59 | 1.90 | |
| 20 | T-1 | 0.83 | 1.03 | 0.86 | 1.28 | 0.86 | 1.28 | 0.85 | 1.28 |
| T-2 | 0.80 | 1.87 | 0.81 | 1.90 | 0.81 | 1.90 | 0.81 | 1.89 | |
| T-3 | 0.17 | 1.18 | 0.19 | 1.20 | 0.19 | 1.20 | 0.20 | 1.21 | |
| T-4 | 0.58 | 5.45 | 0.58 | 0.59 | 0.58 | 0.59 | 0.59 | 0.68 | |
| X-1 | 8.02 | 4.44 | 2.02 | 4.45 | 2.02 | 4.45 | 0.48 | 4.46 | |
|
|
|
|
|
||||||
| Avg. | 2.08 | 2.80 | 0.89 | 1.88 | 0.89 | 1.88 | 0.59 | 1.90 | |
cog and ncog represent cognate-receptor docking and noncognate-receptor docking, respectively. The best RMSD was used for the values in top 5 and top 20 models.
When multiple top N models were used for the performance comparison, the best ligand RMSDnat from Methods 1 and 2 gradually decrease as the number of top N models increased. In contrast, when the cluster size was used for sorting (Methods 3 and 4), the ligand RMSDnat remain constant after selecting the top five poses. In addition, when the centroid conformations of the most populated clusters (Method 4) were used as a representative model, the average RMSDnat is the lowest for cognate-receptor docking and comparable to Methods 2 and 3 for noncognate-receptor docking. With the top five poses selected by Method 4, nine out of 10 targets were predicted with ligand RMSDnat below 2 Å. The only target whose near-native pose was not predicted was the X-1 ligand docked into the noncognate MDMX conformation. Among all 400 decoys from X-1 noncognate-receptor docking, the smallest RMSD was 4.11 Å, indicating a potential issue of the docking program in predicting a near-native ligand pose despite slight structural deviation from cognate-receptor45,46 (binding-site Ca RMSD = 0.59 Å between cognate- and noncognate-receptor structures). Explicit incorporation of receptor flexibility during the docking calculation is an approach to tackle this problem, although it is computationally very expensive. Another approach is to use the low-resolution model of ligand and receptor to tolerate the structural deviation. However, accounting for receptor flexibility during ligand docking remains challenging.47
Ligand stability as a descriptor for pose-selection
The top five models of each target obtained from the docking and clustering (Method 4) were further filtered in terms of the structural stability of the bound ligand during equilibration MD simulations. Two representative plots are shown in Figure 2A to illustrate the relationship between the ligand stability during the equilibration MD and the RMSDnat. For a model structure whose ligand has a near-native pose (RMSDnat = 0.20 Å), the ligand RMSD from the initial docked pose (RMSDMD) remained small during the equilibration MD. In contrast, an incorrectly docked pose (RMSDnat = 7.15 Å) immediately started to drift away from its initial position after the positional restraints on the ligand’s heavy atoms were removed at 100 ps. The results suggest that the smaller RMSDMD during short equilibration MD simulations can be a representative feature of stable receptor/ligand complexes. To quantify the ligand stability, we measured the average ligand RMSDMD from the last 100-ps equilibration MD trajectory. For the crystal structures, the average RMSDMD were below 2.0 Å with the minimum value of 0.89 Å and the maximum value of 1.93 Å (Figure 2B). Based on this observation, we have determined an RMSDMD of 2.0 Å as a cutoff value to filter the five models obtained from the docking and clustering (Method 4).
Figure 2.
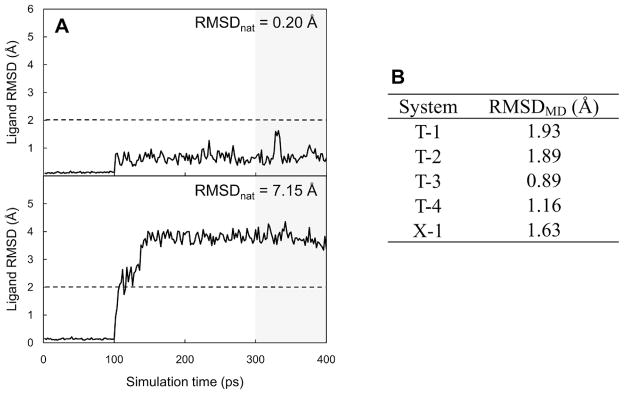
Structural stability of a ligand bound to a receptor during equilibration MD simulations. (A) Representative plots of ligand RMSD changes from an initial docked pose as a function of simulations time for near-native pose (RMSD from native pose, RMSDnat = 0.20 Å) and incorrectly docked pose (RMSDnat = 7.15 Å). These plots were prepared from the simulation results for T-3 cognate-receptor docking models. (B) Average ligand RMSDs from the native conformations during last 100-ps simulations (RMSDMD) for the crystal structures.
Filtering by the RMSDMD cutoff downsized the number of candidate ligand poses by 48% (Table 3). In particular, all near-native ligand poses of each system are included in the selected models, except the case of the noncognate receptor docking of ligand X-1 in which a ligand conformation of RMSDnat below 2.0 Å was not sampled from the docking calculations. The filtering performance by RMSDMD in selecting near-native poses among docking decoys was compared to that by the docking score (Figure 3). When a maximum docking score (−6.9 kcal/mol) was used as a cutoff value to encompass all the near-native poses, the number of selected poses was 33 out of 50 (66%). In contrast, when a maximum RMSDMD (1.69 Å) was used as the cutoff value (to be consistent with the maximum docking score cutoff of −6.9 kcal/mol), 18 poses (36%) were selected. This result indicates that docking poses filtered by RMSDMD is an efficient approach to improve the accuracy of near-native pose prediction.
Table 3.
Filtering by ligand stability during equilibration MD and FEP/MD calculations to predict ligand-binding modea
| System | Cognate docking
|
Noncognate docking
|
|||||||
|---|---|---|---|---|---|---|---|---|---|
| RMSDnat | docking score | RMSDMD |
|
RMSDnat | docking score | RMSDMD |
|
||
| T-1 | 6.73 | −5.5 | 4.27 | 7.99 | −6.2 | 1.95 | −11.53 ± 2.38 | ||
| 6.94 | −6.5 | 2.29 | 1.28 | −7.3 | 1.50 | −12.54 ± 1.88 | |||
| 6.41 | −6.3 | 3.27 | 6.18 | −7.3 | 2.46 | ||||
| 0.85 | −8.2 | 1.43 | −12.04 ± 2.13 | 2.31 | −6.7 | 1.76 | −7.95 ± 0.47 | ||
| 2.18 | −7.5 | 2.00 | −9.08 ± 3.99 | 6.69 | −5.1 | 4.80 | |||
|
|
|
|
|||||||
| T-2 | 4.54 | −7.5 | 2.51 | 4.83 | −7.4 | 1.75 | −15.43 ± 1.09 | ||
| 5.88 | −6.5 | 6.75 | 1.89 | −8.0 | 1.07 | −18.51 ± 1.40 | |||
| 6.10 | −6.9 | 1.35 | −20.30 ± 2.43 | 7.09 | −6.1 | 7.54 | |||
| 0.81 | −9.7 | 1.69 | −23.25 ± 1.35 | 5.73 | −6.5 | 6.94 | |||
| 5.86 | −8.1 | 2.69 | 6.19 | −7.3 | 1.26 | −12.73 ± 2.02 | |||
|
|
|
|
|||||||
| T-3 | 7.25 | −7.8 | 2.37 | 6.08 | −7.1 | 2.41 | |||
| 7.78 | −7.2 | 1.55 | −6.29 ± 1.89 | 5.35 | −7.2 | 2.79 | |||
| 7.15 | −7.2 | 3.76 | 1.21 | −8.9 | 0.91 | −14.19 ± 1.62 | |||
| 0.20 | −9.4 | 0.74 | −18.95 ± 1.60 | 5.95 | −7.9 | 1.13 | −10.38 ± 1.52 | ||
| 6.09 | −8.8 | 1.26 | −8.17 ± 3.09 | 4.93 | −7.6 | 1.66 | −4.82 ± 1.47 | ||
|
|
|
|
|||||||
| T-4 | 5.68 | −7.9 | 4.63 | 5.49 | −8.4 | 2.98 | |||
| 5.41 | −8.2 | 1.06 | −16.38 ± 2.23 | 6.89 | −7.0 | 1.62 | −3.72 ± 2.02 | ||
| 6.08 | −7.9 | 2.51 | 6.76 | −7.4 | 4.64 | ||||
| 0.59 | −8.6 | 0.89 | −15.88 ± 0.52 | 0.68 | −8.2 | 1.55 | −16.41 ± 1.97 | ||
| 5.14 | −7.9 | 1.45 | −9.57 ± 1.16 | 4.93 | −7.5 | 3.20 | |||
|
|
|
|
|||||||
| X-1 | 8.11 | −7.7 | 2.07 | 6.08 | −6.1 | 3.18 | |||
| 7.04 | −6.6 | 1.72 | −9.36 ± 2.48 | 7.05 | −6.6 | 3.75 | |||
| 0.48 | −6.9 | 1.33 | −9.78 ± 2.12 | 5.36 | −6.3 | 2.21 | |||
| 6.17 | −6.4 | 4.99 | 4.46 | −6.4 | 1.92 | −4.93 ± 2.77 | |||
| 7.55 | −7.0 | 3.05 | 6.95 | −6.4 | 4.48 | ||||
RMSDnat (Å): RMSD of a docked ligand from its native pose, docking score (kcal/mol): binding affinity predicted by AutoDock Vina. RMSDMD (Å): average ligand RMSD from the initial docked pose during the last 100-ps equilibration MD,
Figure 3.
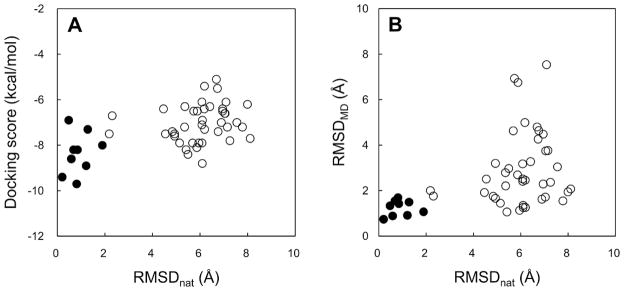
(A) Comparison of the AutoDock Vina docking score with RMSDs of docked ligands from the native structure (RMSDnat). (B) Comparison of average ligand RMSDs from the initial docked poses during last 100-ps equilibration MD (RMSDMD) with RMSDnat. The tested poses in Table 3 are classified into near-native poses (filled circles) and non-native poses (open circles).
Performance of FEP/MD calculations on binding mode prediction
The absolute ligand binding free energies calculated by FEP/MD were considered for final selection of the near-native poses from the model complexes obtained from RMSDMD filtering. The final near-native pose in each system was chosen as a pose with the most favorable binding free energy. The results in Table 3 indicate that the binding free energy is a useful descriptor to discriminate near-native poses from docking decoys. Among the nine docking systems, the near-native poses were successfully predicted for eight systems. In the cognate-receptor docking of ligand T-4, the binding free energy of the near-native pose was slightly more unfavorable than that of the incorrect docking pose with RMSDnat of 5.41 Å.
As shown in Figure 4, the conformations of the two poses are very similar except that their 4-chlorobenzyl and benzene rings have opposite orientations centered on 6-chloroindole. When the sum of the repulsive and dispersive contributions (ΔΔGrep+ ΔΔGdis) for each pose was compared, the difference was slight: −26.0 and −25.3 kcal/mol for the near-native and the non-native poses, respectively. This result illustrates that the two poses have similar contacts with the receptor and the unsuccessful prediction may arise mainly from the inaccurate assignment of the atomic partial charges of the ligand. In this study, we used the CGenFF partial charges without further optimization, but more accurate partial charges can be obtained from more expensive quantum calculations. Restricted sampling of ligand/receptor conformations in the current FEP/MD simulations may also be a cause of the inaccuracy (see the “Conformational flexibility of MDM2” section below). In addition, it should be noted that the standard deviations of the last five FEP/MD cycles are high and, therefore, the relative rankings between these two poses based on the free energy are not statistically significant.
Figure 4.
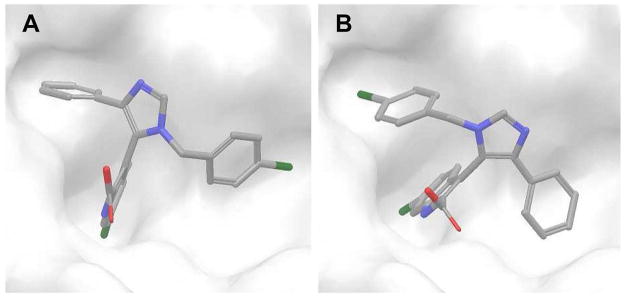
Ligand conformations in the two models selected by the calculated binding free energies for T-4 cognate-receptor docking: (A) non-native pose (RMSDnat = 5.41 Å) and (B) near-native pose (RMSDnat = 0.59 Å).
Overview of pose-selection approach used in this study
Based on the results described so far, we propose an integrated approach of MD simulation with docking to predict near-native ligand pose (Figure 5). First, a large number of pose decoys are generated by docking calculations. All ligand conformations are clustered using an RMSD tolerance value of 2 Å. The five largest clusters are selected and then each cluster’s centroid is subjected to short equilibration MD simulations in a fully solvated system (400 ps in this study). The average ligand RMSDMD is calculated using the MD trajectories (the last 100-ps trajectory in this study). Among the five models, the models showing the average ligand RMSDMD of ≤ 2 Å are used for absolute ligand binding free energy calculations using the FEP/MD method (in a reduced system using GSBP/SSBP in this study; see Supporting Information for details). The FEP/MD calculations are started from the last configuration of the equilibration MD simulation. The final ligand-binding mode is determined in terms of the calculated binding free energies.
Figure 5.
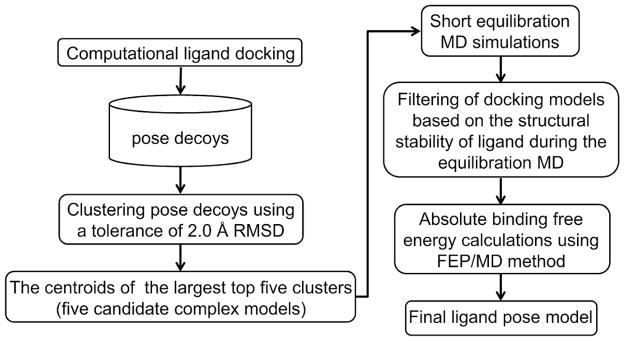
Overview of the proposed pose-selection approach.
Docking scores and ligand stability for binding mode prediction
In AutoDock Vina, the docking score is the predicted binding affinity in kcal/mol. Table 3 shows that the docking score without further filtering by RMSDMD appears not to be a good descriptor for discriminating near-native poses from decoys (see also Figure 3). The lowest docking scores corresponded to the lowest RMSDnat for only six out of 10 systems tested. However, the filtering by RMSDMD improved the ability of the docking score in prioritizing the near-native pose (nine out of 10), indicating that considering ligand stability during equilibration MD in combination with the docking score can be a potential descriptor for near-native pose-selection. For the T-4 cognate-receptor case, in which the FEP/MD calculations were not able to predict the near-native pose, a model having both smaller average ligand RMSDMD and docking score corresponded to the near-native pose. The results suggest that the integrated evaluation of RMSDMD and docking scores with ligand binding free energies by FEP/MD can improve the ability of pose selection.
Performance of FEP/MD calculations in discriminating binders from nonbinders
A goal of virtual screening experiments is to downsize the compound library through discrimination between molecules that bind to the target protein (binders) and molecules that do not bind to the target protein (nonbinders). Figure 6 shows a relationship between the docking score and the calculated absolute binding energy for near-native and non-native poses. Producing points close to the diagonal line indicates that the method is not able to discriminate near-native poses from non-native poses. The result shows that there are more targets far below the diagonal line, and the energy gaps between near-native and non-native poses are larger in the FEP/MD calculations than in docking calculations. This clearly demonstrates that the binding free energies calculated by FEP/MD are more sensitive to the structural differences of the ligands at the binding site than the AutoDock Vina score, implying a higher potential of the FEP/MD calculation for discriminating binders from nonbinders. Malmstrom and Watowich evaluated free energy rescoring by the FEP/MD calculations for a small T4 lysozyme L99A control set, showing that the screening set was highly enriched when the absolute binding free energies were used to rank the library compounds instead of the AutoDock docking scores.44 Their results are in good agreement with our analysis.
Figure 6.

Relationship between docking scores and FEP/MD binding free energies for near-native and non-native poses. Each data point in the plot represents a pair of docking scores (or free energy by FEP/MD) for near-native and non-native poses in a system. In the case of T-3 cognate-receptor docking (Table 3), for an example, two pairs can be generated from three docking poses (near-native pose + two non-native poses) selected by RMSDMD filtering.
Conformational flexibility of MDM2
To evaluate the prediction accuracy of binding affinity by the FEP/MD calculations, the binding free energies ( ) for the crystal structures and the docking models with a near-native ligand pose were compared with experimental measurements in Table 4. The calculated binding free energy for the MDMX/X-1 crystal structure was similar to the experimental value, but most calculated free energies for MDM2 systems were overestimated. It has been known that the FEP/MD calculations are largely affected by structural difference, and thus accurate starting structures are necessary to precisely calculate the binding free energies. In general, the binding free energy calculated for model structures poorly correlated with the experimental measurements, compared to those from crystal structures.18,44 Nevertheless, our results show that the absolute binding free energies calculated by FEP/MD are much more favorable than experimentally measured values particularly for the MDM2/ligand complexes.
Table 4.
The binding free energy (kcal/mol) and its decomposition for the test set
| System | Structurea | ΔΔGrep | ΔΔGdis | ΔΔGelec | ΔΔGt,r,c |
|
expt | |
|---|---|---|---|---|---|---|---|---|
| T-1 | Crystal | −13.74 ± 2.06 | −14.68 ± 0.79 | 3.02 ± 0.35 | 11.31 ± 0.70 | −14.10 ± 2.64 | −9.41b | |
| Docking (cog) | −19.67 ± 2.26 | −6.55 ± 0.23 | 4.75 ± 0.72 | 9.44 ± 0.42 | −12.04 ± 2.13 | |||
| Docking (ncog) | −15.60 ± 2.55 | −9.28 ± 0.71 | 3.75 ± 0.29 | 8.59 ± 0.29 | −12.54 ± 1.88 | |||
|
| ||||||||
| T-2 | Crystal | −15.87 ± 0.87 | −14.07 ± 0.22 | −4.42 ± 0.27 | 13.17 ± 0.21 | −21.20 ± 0.90 | −9.74c | |
| Docking (cog) | −15.99 ± 1.27 | −16.24 ± 0.27 | −2.66 ± 0.56 | 11.64 ± 0.13 | −23.25 ± 1.35 | |||
| Docking (ncog) | −13.00 ± 1.60 | −12.27 ± 0.41 | −2.61 ± 0.15 | 9.36 ± 0.12 | −18.51 ± 1.40 | |||
|
| ||||||||
| T-3 | Crystal | −13.80 ± 1.32 | −14.62 ± 0.47 | 0.35 ± 0.43 | 9.40 ± 0.03 | −18.66 ± 1.72 | −8.11b | |
| Docking (cog) | −14.75 ± 2.00 | −15.16 ± 0.31 | −0.46 ± 0.36 | 11.42 ± 0.17 | −18.95 ± 1.60 | |||
| Docking (ncog) | −12.70 ± 1.28 | −14.01 ± 0.31 | 2.58 ± 0.08 | 9.95 ± 0.19 | −14.19 ± 1.62 | |||
|
| ||||||||
| T-4 | Crystal | −12.71 ± 2.03 | −11.60 ± 0.55 | −1.41 ± 0.37 | 9.41 ± 0.25 | −16.31 ± 2.56 | −8.29d | |
| Docking (cog) | −12.98 ± 0.40 | −12.32 ± 0.25 | −1.87 ± 0.29 | 11.29 ± 0.46 | −15.88 ± 0.52 | |||
| Docking (ncog) | −11.90 ± 1.72 | −10.99 ± 0.53 | −2.00 ± 0.11 | 8.49 ± 0.16 | −16.41 ± 1.97 | |||
|
| ||||||||
| X-1 | Crystal | −14.00 ± 2.84 | −8.99 ± 0.55 | 4.01 ± 0.25 | 11.46 ± 0.93 | −7.52 ± 3.67 | −6.81d | |
| Docking (cog) | −16.15 ± 0.46 | −7.47 ± 0.36 | 3.50 ± 0.40 | 10.34 ± 2.00 | −9.78 ± 2.12 | |||
|
| ||||||||
| X-2e | MDMX/K23 Model | −11.03 ± 1.53 | −10.25 ± 0.54 | 2.69 ± 0.59 | 10.79 ± 0.20 | −7.80 ± 1.04 | −6.10d | |
Crystal: crystal structure, Docking (cog): Docking model with near-native ligand pose from cognate-receptor docking, Docking (ncog): Docking model with near-native ligand pose from noncognate-receptor docking.
ΔGexp calculated using IC50
ΔGexp calculated using Kb
ΔGexp calculated using Ki
System X-2 is a model structure of MDMX in complex with the ligand (K23 in Figure 1) in system T-4. The starting structure of system X-2 was generated by modifying the crystal structure of system X-1.
Uhrinova et al. determined the solution structure and dynamics of apo-MDM2 using nuclear magnetic resonance (NMR) techniques.48 Figure 7A is an overlaid structure of a holo-MDM2 with the ensemble of the apo-MDM2 structures, showing that the apo-form is conformationally mobile and has a narrower ligand-binding groove. The compact binding pocket of the apo-form can also be clearly observed from the surface structures between apo- and holo-form in Figure 7B. The apo-MDM2 structure reveals the nature of the conformational changes in MDM2, i.e., an expansion of the ligand-binding groove upon ligand binding. Two pseudo-symmetrically related sub-domains are rearranged, resulting in outward displacements of the secondary structural elements that comprise the walls and floor of the ligand-binding region. This structural change opens the binding site groove and exposes the deeper hydrophobic residues. MDM2 also becomes more rigid and stable upon ligand binding.48 The energy needed for such conformational changes and the entropy loss resulting from the rigidity upon ligand binding will make the ligand binding free energy unfavorable. This observation strongly implies that the overestimation of the absolute binding free energies by FEP/MD may mainly result from inefficacy in sampling highly flexible apo-MDM2 due to the restriction of receptor atom movements by GSBP and short simulation time for free energy calculations starting from holo-MDM2. A previous study by Deng and Roux had also observed the favorable free energy caused by structural differences between holo- and apo-form in the FEP/MD calculations of aromatic molecules in the T4 lysozyme L99A mutant.17
Figure 7.
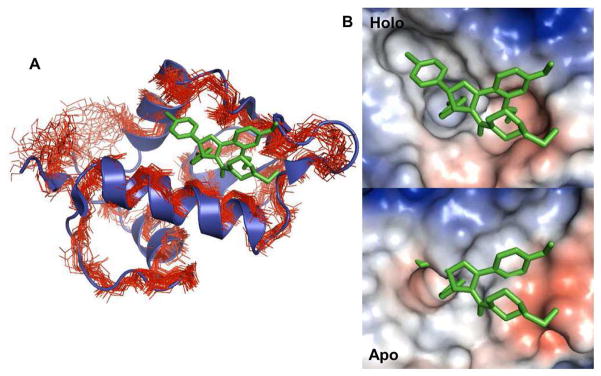
Structural difference between apo- and holo-form of MDM2. (A) An ensemble of the apo-MDM2 structures (PDB:1Z1M) are superposed onto a holo-MDM2 in complex with IMZ (PDB:1RV1). The apo-MDM2 and the holo-MDM2 structures are shown as line and cartoon representations, respectively. (B) Surface representations of holo- and apo-MDM2 conformations. For the apo-conformation, model 1 in the NMR ensemble structures was used.
To elucidate the origin of the overestimated free energies, we first evaluate the effect of binding pocket hydration. The current simulations do not reflect the changes in the hydration state of the binding pocket during the free energy calculation. This is due to the inability of the GSBP method to adjust the system volume and the number of water molecules during the FEP/MD calculations. To accurately account for the hydration state during the free energy calculations, we incorporated the grand canonical Monte Carlo (GCMC) algorithm49 into the FEP/MD calculation protocol for a MDM2 crystal structure in complex with ligand T-1. For the repulsive, dispersive, and electrostatic stages of every window, water molecules within the GSBP sphere were constructed by 5 cycles of a GCMC/MD run (10,000 MC steps followed by 4-ps MD). The MC steps include rigid body translation, rotation, and GCMC insertion/deletion of water molecules, allowing the number of water to fluctuate during the FEP calculations. The results are summarized in Table 5. The repulsive contribution in the binding site became less favorable when better hydration was achieved by GCMC, whereas the dispersive contribution became more favorable. The electrostatic contribution remained comparable to that without GCMC. The overall change in the final absolute binding free energy became less favorable because of the increased repulsive energy, but the magnitude is not large due to an offset by the dispersive energy. These results demonstrate that the changes in the hydration state of the binding pocket during the FEP calculations are not the main factor of the too-favorable free energies.
Table 5.
Comparison of binding free energy contributions (kcal/mol) with and without GCMC during the free energy calculation for the T-1 crystal structure
| System | Site solvation |
|
|
|
|
||||
|---|---|---|---|---|---|---|---|---|---|
| T-1 | w/o GCMC | 41.74 ± 2.39 | −70.18 ± 0.50 | −32.50 ± 0.43 | −14.10 ± 2.64 | ||||
| w GCMC | 45.63 ± 1.19 | −73.54 ± 0.43 | −32.01 ± 0.25 | −13.00 ± 1.96 |
A straightforward way to remove all the limitations caused by the reduced system (GSBP/SSBP) is to run the FEP/MD calculation with fully solvated protein using the traditional periodic boundary conditions (PBC), though this approach needs much more computational resources (~13 times more CPU time for our benchmark systems; each cycle took about 2.5 hours for each of 137 FEP/MD simulations in the reduced systems, but about 32 hours in the fully solvated systems on a single 2.33 GHz processor). The FEP/MD results from the MDM2/X crystal structures using the reduced system and the fully solvated system (PBC) are summarized in Table 6. Similar to the case in the reduced system, the calculated free energy for MDMX/X-1 using the fully solvated system was comparable to the experimental value. The free energy difference between calculated and measured values was 0.71 kcal/mol (GSBP/SSBP) and 1.63 kcal/mol (PBC, Run 6–10 column in Table 6). While the calculated free energies for the MDM2 systems were still more favorable than the experimental values, the FEP/MD simulations with PBC substantially ameliorated the problem with the too-favorable free energies from the reduced system. The average free energy difference of the MDM2 crystal structures (from T-1 to T-4) was 8.68 kcal/mol (GSBP/SSBP) and 2.56 kcal/mol (PBC, Run 6–10 column in Table 6). We performed longer simulations with PBC, i.e., 30 cycles FEP/MD calculations, aiming to obtain binding free energies closer to the experimental measurements, in particular for the MDM2 systems (Run 21–30 column in Table 6). However, significant improvement was not observed, indicating that the simulation protocol is still not enough for the efficient sampling of highly flexible receptor during free energy calculation. Accelerated MD simulation techniques can be an approach to improve conformational sampling.50 Taken together, these results show that the fully solvated system, which allows the receptor to be fully flexible, makes the calculated free energy unfavorable compared to the reduced system. It also demonstrates that the highly favorable free energies obtained from the FEP/MD calculations using the reduced system mainly results from the restricted dynamics of the receptors.
Table 6.
Comparison of binding free energies (kcal/mol) calculated with reduced systems (GSBP/SSBP) to those with fully solvated systems (periodic boundary condition, PBC) for the X-ray MDM2/X structuresa
| expt | GSBP/SSBP
|
PBC
|
|||
|---|---|---|---|---|---|
| Run 6–10 | Run 6–10 | Run 11–20 | Run 21–30 | ||
| T-1 | −9.41 | −14.10 ± 2.64 | −9.90 ± 2.45 | −11.45 ± 1.93 | −12.16 ± 1.71 |
| T-2 | −9.74 | −21.20 ± 0.90 | −11.04 ± 0.77 | −12.40 ± 2.63 | −12.04 ± 0.45 |
| T-3 | −8.11 | −18.66 ± 1.72 | −13.90 ± 0.56 | −13.92 ± 1.52 | −14.26 ± 0.80 |
| T-4 | −8.29 | −16.31 ± 2.56 | −10.95 ± 0.86 | −13.01 ± 0.72 | −13.02 ± 1.46 |
| X-1 | −6.81 | −7.52 ± 3.67 | −5.18 ± 1.37 | −4.61 ± 2.67 | −6.91 ± 2.51 |
The free energies and the errors are the averages and the standard deviations of the continuous FEP/MD cycles, respectively. For example, the free energies on the “Run 6-10” column are the average of five runs from cycle 6 to 10.
Conformational flexibility of MDMX
Currently, no experimental apo-structure of MDMX has been reported. Joseph et al. carried out MD simulations to differentiate binding of p53 and nutilin to MDM2 and MDMX.51 They showed that apo-MDMX has lower flexibility than apo-MDM2, based on the principle component analysis using MD trajectories. Their conclusion supports our FEP/MD results that in contrast to MDM2, structural and dynamic changes of MDMX upon ligand binding are minimal and the calculated ligand binding free energies in both reduced and fully solvated systems are not significantly different.
To further validate this observation, we calculated the absolute binding free energy of a model complex of T-4 ligand bound to MDMX. There is no experimental structure of the MDMX/T-4 complex. To generate the MDMX/T-4 complex model, we modified the ligand X-1 in the MDMX crystal structure by removing the N,N-dimethylaminopropyl pyrrolidine part of the ligand and adding an oxygen atom to form a carboxyl group at the end of the removed part (see Figure 1 for T-4 and X-1 ligand structures). The structure of the modified X-1 ligand is identical to that of ligand T-4. Therefore, assuming that ligand T-4 shares a similar binding mode as in MDMX/X-1, the prepared complex structure is MDMX in complex with ligand T-4, and named X-2. The calculated free energy of system X-2 (with MDMX) in Table 4 is much less favorable than that of system T-4 (with MDM2) and comparable to the experimental value. This result indicates that the solution dynamics of apo-MDM2 and apo-MDMX is different, and changes in structure and dynamics between apo- and holo-MDMX are not as large as in MDM2.
Free energy decomposition from FEP/MD calculations
The FEP/MD calculations are also useful in dissecting the total binding free energy with various contributions. The free energy decomposition in Table 4 shows that net contributions from the repulsive (ΔΔGrep) and dispersive (ΔΔGdis) interactions are dominant for all systems, whereas there is a small or unfavorable electrostatic free energy contribution (ΔΔGelec). This suggests that the free energy change upon ligand binding to MDM2/X arises mainly from hydrophobic interactions.
In addition, a comparison between systems T-4 crystal and X-2 model provides the different energetic contributions between MDM2 and MDMX. All the nonbonded energy contributions in X-2 were less favorable than those in T-4. The less favorable dispersive and repulsive contributions (ΔΔGX-2 − ΔΔGT-4 = 3.03 kcal/mol) indicate that K23 ligand has less shape complementarity within the MDMX binding site (system X-2) compared to the MDM2 site (system T-4). In addition, the difference in the electrostatic free energy contributions between X-2 and T-4 (ΔΔGX-2 − ΔΔGT-4 = 4.10 kcal/mol), which results from less electrostatic complementarity at the K23/MDMX interface, further aggravates the tight binding of the ligand to the protein. This may explain why most ligands with high affinity to MDM2 do not bind to MDMX, despite small differences in the overall structures between MDM2 and MDMX.31,52 It also should be mentioned that our decomposition analysis needs to be interpreted with care because the individual contributions to the overall free energy are dependent on the chosen integration path.53
CONCLUSIONS
In this study, we have evaluated the performance of the FEP/MD calculations, mainly focusing on its applications to obtain a near-native ligand pose and to predict binding affinity for the small-molecule antagonists of MDM2 and MDMX. An integrated computational protocol combining docking, pose clustering, equilibration MD simulations, and FEP/MD calculations is proposed to reliably predict near-native poses. Pose decoys obtained from docking, which is computationally least expensive, are subjected to clustering analysis, and then the centroid models of the most populated clusters are selected. The selected docking models are filtered in terms of the structural stability of a ligand bound to a receptor during equilibration MD simulations. Absolute ligand binding free energies of the remaining models are calculated by the FEP/MD calculation, which is computationally most expensive, for the selection of a final model. This approach enhances the ability in predicting the near-native ligand conformation from the docking decoys. In particular, the energy gaps between near-native and non-native poses are larger in the FEP/MD calculations than those in docking scores, illustrating high sensitivity in recognizing ligand structures fitting into the binding pocket. This implies the potential of the FEP/MD calculation in discriminating binders from nonbinders.
A comparison of the calculated binding free energies to the experimental measurements is described to illustrate the advantages and disadvantages of the current FEP/MD calculations for MDM2/X inhibitors. The absolute binding free energies calculated for the MDM2 complexes are too favorable. Based on (i) a comparison between apo- and holo-structure, (ii) simulation results from GCMC solvation and FEP/MD with PBC, and (iii) previous studies, we suggest that such too-favorable binding energies result from inefficacy of FEP/MD in sampling highly flexible MDM2 conformations. In contrast, the free energies calculated for MDMX are comparable to the experimental measurement. These results imply that changes in the structure and dynamics of apo-MDMX upon ligand binding are not as large as those of MDM2, indicating significantly different solution dynamics between apo-MDM2 and apo-MDMX.
The FEP/MD calculations with the reduced system using GBSP/SSBP boundary potentials introduce intrinsic (unpredictable) errors due to many approximations adopted in the system, and thus care in choosing several parameters is often required. Absolute ligand binding free energy calculations using PBC instead of GSBP/SSBP can naturally remove such ambiguous errors and thus improve the calculation accuracy. However, this approach is still computationally too expensive to apply to a large number of complex structures, and efficient conformation sampling of highly flexible receptor is still challenging. While the FEP/MD simulations with PBC will be a standard approach with increasing computing power and advanced sampling methods, a careful usage of GSBP/SSBP-based reduced system would increase the application of FEP/MD to a large number of protein-ligand complexes.
An important feature of the FEP/MD calculations is to provide detailed information on the energetic contributions of ligand binding, leading to better understanding on the origin of molecular recognition. The MDM2/X inhibitors bind to the receptor mainly by hydrophobic interactions. MDMX ligand has less shape complementary match with the MDM2 binding site, and in particular, the unfavorable electrostatic free energy significantly weakens the binding affinity in MDMX. This provides the molecular basis of why most MDM2 ligands are not effective to MDMX, despite the structural homology of these two proteins.
The computational methods presented here could be a promising approach to predict the binding modes of ligands that are experimentally verified to bind to a target protein in the absence of an experimental complex structure. It also could be useful for lead optimization. The application of the combined methods for virtual screening is also encouraging. For the virtual screening purposes, however, further optimization of the methods (e.g., the number of pose decoys from docking, the simulation time of equilibration MD, the number of cycles of FEP/MD calculation) is needed to minimize the computational cost. FEP with replica-exchange MD simulations can be performed to improve the sampling and thus reduce the number of cycles of the free energy calculations.54 Our methods may be still computationally demanding for the calculations of many compounds. One possible solution could be to improve efficacy in discriminating binders from a compound set downsized by conventional virtual screening procedures.
(kcal/mol): absolute ligand binding free energy by FEP/MD.
Supplementary Material
Acknowledgments
The authors are grateful to Alexander D. MacKerell, Jr. and Benoît Roux for helpful discussion. This work was supported in part by the University of Kansas General Research Fund allocation #2301388-003, Kansas-COBRE pilot project (NIH 5P20RR017708-10 and 8 P20 GM103420-10), NIH R01-GM092950, and TeraGrid resources provided by Purdue University (NSF OCI-0503992).
Footnotes
Supporting Information. The theory and protocol for the FEP/MD calculations used in this study are provided. The coupling parameters in the FEP/MD calculations are available in Table S1. This information is available free of charge via the Internet at http://pubs.acs.org/.
References
- 1.Kitchen DB, Decornez H, Furr JR, Bajorath J. Docking and scoring in virtual screening for drug discovery: methods and applications. Nat Rev Drug Discov. 2004;3:935–949. doi: 10.1038/nrd1549. [DOI] [PubMed] [Google Scholar]
- 2.Yuriev E, Agostino M, Ramsland PA. Challenges and advances in computational docking: 2009 in review. J Mol Recognit. 2011;24:149–164. doi: 10.1002/jmr.1077. [DOI] [PubMed] [Google Scholar]
- 3.Morris GM, Huey R, Lindstrom W, Sanner MF, Belew RK, Goodsell DS, Olson AJ. AutoDock4 and AutoDockTools4: Automated docking with selective receptor flexibility. J Comput Chem. 2009;30:2785–2791. doi: 10.1002/jcc.21256. [DOI] [PMC free article] [PubMed] [Google Scholar]
- 4.Trott O, Olson AJ. AutoDock Vina: improving the speed and accuracy of docking with a new scoring function, efficient optimization, and multithreading. J Comput Chem. 2010;31:455–461. doi: 10.1002/jcc.21334. [DOI] [PMC free article] [PubMed] [Google Scholar]
- 5.Lang PT, Brozell SR, Mukherjee S, Pettersen EF, Meng EC, Thomas V, Rizzo RC, Case DA, James TL, Kuntz ID. DOCK 6: combining techniques to model RNA-small molecule complexes. Rna. 2009;15:1219–1230. doi: 10.1261/rna.1563609. [DOI] [PMC free article] [PubMed] [Google Scholar]
- 6.Kramer B, Rarey M, Lengauer T. Evaluation of the FLEXX incremental construction algorithm for protein-ligand docking. Proteins. 1999;37:228–241. doi: 10.1002/(sici)1097-0134(19991101)37:2<228::aid-prot8>3.0.co;2-8. [DOI] [PubMed] [Google Scholar]
- 7.Friesner RA, Banks JL, Murphy RB, Halgren TA, Klicic JJ, Mainz DT, Repasky MP, Knoll EH, Shelley M, Perry JK, Shaw DE, Francis P, Shenkin PS. Glide: a new approach for rapid, accurate docking and scoring. 1. Method and assessment of docking accuracy. J Med Chem. 2004;47:1739–1749. doi: 10.1021/jm0306430. [DOI] [PubMed] [Google Scholar]
- 8.Verdonk ML, Cole JC, Hartshorn MJ, Murray CW, Taylor RD. Improved protein-ligand docking using GOLD. Proteins. 2003;52:609–623. doi: 10.1002/prot.10465. [DOI] [PubMed] [Google Scholar]
- 9.Totrov M, Abagyan R. Flexible protein-ligand docking by global energy optimization in internal coordinates. Proteins. 1997;(Suppl 1):215–220. doi: 10.1002/(sici)1097-0134(1997)1+<215::aid-prot29>3.3.co;2-i. [DOI] [PubMed] [Google Scholar]
- 10.Jain AN. Surflex: fully automatic flexible molecular docking using a molecular similarity-based search engine. J Med Chem. 2003;46:499–511. doi: 10.1021/jm020406h. [DOI] [PubMed] [Google Scholar]
- 11.Cross JB, Thompson DC, Rai BK, Baber JC, Fan KY, Hu Y, Humblet C. Comparison of several molecular docking programs: pose prediction and virtual screening accuracy. J Chem Inf Model. 2009;49:1455–1474. doi: 10.1021/ci900056c. [DOI] [PubMed] [Google Scholar]
- 12.Jain AN. Effects of protein conformation in docking: improved pose prediction through protein pocket adaptation. J Comput Aided Mol Des. 2009;23:355–374. doi: 10.1007/s10822-009-9266-3. [DOI] [PMC free article] [PubMed] [Google Scholar]
- 13.Deng Y, Roux B. Computations of standard binding free energies with molecular dynamics simulations. J Phys Chem B. 2009;113:2234–2246. doi: 10.1021/jp807701h. [DOI] [PMC free article] [PubMed] [Google Scholar]
- 14.Carlson HA, Masukawa KM, Rubins K, Bushman FD, Jorgensen WL, Lins RD, Briggs JM, McCammon JA. Developing a dynamic pharmacophore model for HIV-1 integrase. J Med Chem. 2000;43:2100–2114. doi: 10.1021/jm990322h. [DOI] [PubMed] [Google Scholar]
- 15.Beglov D, Roux B. Finite representation of an infinite bulk system: Solvent boundary potential for computer simulations. J Chem Phys. 1994;100:9050–9063. [Google Scholar]
- 16.Im W, Berneche S, Roux B. Generalized solvent boundary potential for computer simulations. J Chem Phys. 2000;114:2924–2937. [Google Scholar]
- 17.Deng Y, Roux B. Calculation of standard binding free energies: Aromatic molecules in the T4 Lysozyme L99A mutant. J Chem Theory Comput. 2006;2:1255–1273. doi: 10.1021/ct060037v. [DOI] [PubMed] [Google Scholar]
- 18.Wang J, Deng Y, Roux B. Absolute binding free energy calculations using molecular dynamics simulations with restraining potentials. Biophys J. 2006;91:2798–2814. doi: 10.1529/biophysj.106.084301. [DOI] [PMC free article] [PubMed] [Google Scholar]
- 19.Ge X, Roux B. Absolute binding free energy calculations of sparsomycin analogs to the bacterial ribosome. J Phys Chem B. 2010;114:9525–9539. doi: 10.1021/jp100579y. [DOI] [PubMed] [Google Scholar]
- 20.Berg T. Small-molecule inhibitors of protein-protein interactions. Curr Opin Drug Discov Devel. 2008;11:666–674. [PubMed] [Google Scholar]
- 21.Arkin MR, Whitty A. The road less traveled: modulating signal transduction enzymes by inhibiting their protein-protein interactions. Curr Opin Chem Biol. 2009;13:284–290. doi: 10.1016/j.cbpa.2009.05.125. [DOI] [PubMed] [Google Scholar]
- 22.Matthews MM, Weber DJ, Shapiro PS, Coop A, Mackerell AD., Jr Inhibition of protein-protein interactions with low molecular weight compounds. Curr Trends Med Chem. 2008;5:21–32. [PMC free article] [PubMed] [Google Scholar]
- 23.Joerger AC, Fersht AR. Structural biology of the tumor suppressor p53. Annu Rev Biochem. 2008;77:557–582. doi: 10.1146/annurev.biochem.77.060806.091238. [DOI] [PubMed] [Google Scholar]
- 24.Haupt Y, Maya R, Kazaz A, Oren M. Mdm2 promotes the rapid degradation of p53. Nature. 1997;387:296–299. doi: 10.1038/387296a0. [DOI] [PubMed] [Google Scholar]
- 25.Huang L, Yan Z, Liao X, Li Y, Yang J, Wang ZG, Zuo Y, Kawai H, Shadfan M, Ganapathy S, Yuan ZM. The p53 inhibitors MDM2/MDMX complex is required for control of p53 activity in vivo. Proc Natl Acad Sci USA. 2011;108:12001–12006. doi: 10.1073/pnas.1102309108. [DOI] [PMC free article] [PubMed] [Google Scholar]
- 26.Kussie PH, Gorina S, Marechal V, Elenbaas B, Moreau J, Levine AJ, Pavletich NP. Structure of the MDM2 oncoprotein bound to the p53 tumor suppressor transactivation domain. Science. 1996;274:948–953. doi: 10.1126/science.274.5289.948. [DOI] [PubMed] [Google Scholar]
- 27.Popowicz GM, Czarna A, Holak TA. Structure of the human Mdmx protein bound to the p53 tumor suppressor transactivation domain. Cell Cycle. 2008;7:2441–2443. doi: 10.4161/cc.6365. [DOI] [PubMed] [Google Scholar]
- 28.Vassilev LT, Vu BT, Graves B, Carvajal D, Podlaski F, Filipovic Z, Kong N, Kammlott U, Lukacs C, Klein C, Fotouhi N, Liu EA. In vivo activation of the p53 pathway by small-molecule antagonists of MDM2. Science. 2004;303:844–848. doi: 10.1126/science.1092472. [DOI] [PubMed] [Google Scholar]
- 29.Grasberger BL, Lu T, Schubert C, Parks DJ, Carver TE, Koblish HK, Cummings MD, LaFrance LV, Milkiewicz KL, Calvo RR, Maguire D, Lattanze J, Franks CF, Zhao S, Ramachandren K, Bylebyl GR, Zhang M, Manthey CL, Petrella EC, Pantoliano MW, Deckman IC, Spurlino JC, Maroney AC, Tomczuk BE, Molloy CJ, Bone RF. Discovery and cocrystal structure of benzodiazepinedione HDM2 antagonists that activate p53 in cells. J Med Chem. 2005;48:909–912. doi: 10.1021/jm049137g. [DOI] [PubMed] [Google Scholar]
- 30.Allen JG, Bourbeau MP, Wohlhieter GE, Bartberger MD, Michelsen K, Hungate R, Gadwood RC, Gaston RD, Evans B, Mann LW, Matison ME, Schneider S, Huang X, Yu D, Andrews PS, Reichelt A, Long AM, Yakowec P, Yang EY, Lee TA, Oliner JD. Discovery and optimization of chromenotriazolopyrimidines as potent inhibitors of the mouse double minute 2-tumor protein 53 protein-protein interaction. J Med Chem. 2009;52:7044–7053. doi: 10.1021/jm900681h. [DOI] [PubMed] [Google Scholar]
- 31.Popowicz GM, Czarna A, Wolf S, Wang K, Wang W, Domling A, Holak TA. Structures of low molecular weight inhibitors bound to MDMX and MDM2 reveal new approaches for p53-MDMX/MDM2 antagonist drug discovery. Cell Cycle. 2010;9:1104–1111. doi: 10.4161/cc.9.6.10956. [DOI] [PubMed] [Google Scholar]
- 32.Maestro v90. Schrödinger, LLC; Portland, OR: [Google Scholar]
- 33.Forli S. Raccoon|Autodock VS: an automated tool for preparing AutoDock virtual screenings. [Google Scholar]
- 34.Brooks BR, Brooks CL, 3rd, Mackerell AD, Jr, Nilsson L, Petrella RJ, Roux B, Won Y, Archontis G, Bartels C, Boresch S, Caflisch A, Caves L, Cui Q, Dinner AR, Feig M, Fischer S, Gao J, Hodoscek M, Im W, Kuczera K, Lazaridis T, Ma J, Ovchinnikov V, Paci E, Pastor RW, Post CB, Pu JZ, Schaefer M, Tidor B, Venable RM, Woodcock HL, Wu X, Yang W, York DM, Karplus M. CHARMM: the biomolecular simulation program. J Comput Chem. 2009;30:1545–1614. doi: 10.1002/jcc.21287. [DOI] [PMC free article] [PubMed] [Google Scholar]
- 35.Jo S, Kim T, Iyer VG, Im W. CHARMM-GUI: a web-based graphical user interface for CHARMM. J Comput Chem. 2008;29:1859–1865. doi: 10.1002/jcc.20945. [DOI] [PubMed] [Google Scholar]
- 36.MacKerell AD, Jr, Bashford D, Bellott M, Dunbrack RL, Jr, Evanseck J, Field MJ, Fischer S, Gao J, Guo H, Ha S, Joseph D, Kuchnir L, Kuczera K, Lau FTK, Mattos C, Michnick S, Ngo T, Nguyen DT, Prodhom B, Reiher IWE, Roux B, Schlenkrich M, Smith J, Stote R, Straub J, Watanabe M, Wiorkiewicz-Kuczera J, Yin D, Karplus M. All-atom empirical potential for molecular modeling and dynamics studies of protein. J Phys Chem B. 1998;102:3586–3616. doi: 10.1021/jp973084f. [DOI] [PubMed] [Google Scholar]
- 37.Buck M, Bouguet-Bonnet S, Pastor RW, MacKerell AD., Jr Importance of the CMAP correction to the CHARMM22 protein force field: dynamics of hen lysozyme. Biophys J. 2006;90:L36–L38. doi: 10.1529/biophysj.105.078154. [DOI] [PMC free article] [PubMed] [Google Scholar]
- 38.Vanommeslaeghe K, Hatcher E, Acharya C, Kundu S, Zhong S, Shim J, Darian E, Guvench O, Lopes P, Vorobyov I, Mackerell AD., Jr CHARMM general force field: A force field for drug-like molecules compatible with the CHARMM all-atom additive biological force fields. J Comput Chem. 2010;31:671–690. doi: 10.1002/jcc.21367. [DOI] [PMC free article] [PubMed] [Google Scholar]
- 39.Ryckaert JP, Ciccotti G, Berendsen HJC. Numerical integration of the cartesian equations of motion of a system with constraints: Molecular dynamics of n-alkans. J Comput Phys. 1977;23:327–341. [Google Scholar]
- 40.Darden T, York D, Pedersen L. Particle mesh Ewald: An N·log(N) method for Ewald sums in large systems. J Chem Phys. 1993;98:10089–10092. [Google Scholar]
- 41.Feller SE, Zhang Y, Paster RW, Brooks BR. Constant pressure molecular dynamics simulations: The Langevin piston method. J Chem Phys. 1995;103:4613–4621. [Google Scholar]
- 42.Hoover WG. Canonical dynamics: Equilibrium phase-space distributions. Phys Rev A. 1985;31:1695–1697. doi: 10.1103/physreva.31.1695. [DOI] [PubMed] [Google Scholar]
- 43.Kozakov D, Clodfelter KH, Vajda S, Camacho CJ. Optimal clustering for detecting near-native conformations in protein docking. Biophys J. 2005;89:867–875. doi: 10.1529/biophysj.104.058768. [DOI] [PMC free article] [PubMed] [Google Scholar]
- 44.Malmstrom RD, Watowich SJ. Using free energy of binding calculations to improve the accuracy of virtual screening predictions. J Chem Inf Model. 2011;51:1648–1655. doi: 10.1021/ci200126v. [DOI] [PMC free article] [PubMed] [Google Scholar]
- 45.Lee HS, Lee CS, Kim JS, Kim DH, Choe H. Improving virtual screening performance against conformational variations of receptors by shape matching with ligand binding pocket. J Chem Inf Model. 2009;49:2419–2428. doi: 10.1021/ci9002365. [DOI] [PubMed] [Google Scholar]
- 46.Lee HS, Zhang Y. BSP-SLIM: A blind low-resolution ligand-protein docking approach using predicted protein structures. Proteins. 2012;80:93–110. doi: 10.1002/prot.23165. [DOI] [PMC free article] [PubMed] [Google Scholar]
- 47.CBR, Subramanian J, Sharma SD. Managing protein flexibility in docking and its applications. Drug Discov Today. 2009;14:394–400. doi: 10.1016/j.drudis.2009.01.003. [DOI] [PubMed] [Google Scholar]
- 48.Uhrinova S, Uhrin D, Powers H, Watt K, Zheleva D, Fischer P, McInnes C, Barlow PN. Structure of free MDM2 N-terminal domain reveals conformational adjustments that accompany p53-binding. J Mol Biol. 2005;350:587–598. doi: 10.1016/j.jmb.2005.05.010. [DOI] [PubMed] [Google Scholar]
- 49.Deng Y, Roux B. Computation of binding free energy with molecular dynamics and grand canonical Monte Carlo simulations. J Chem Phys. 2008;128:115103. doi: 10.1063/1.2842080. [DOI] [PubMed] [Google Scholar]
- 50.Sinko W, de Oliveira CA, Pierce LC, McCammon JA. Protecting High Energy Barriers: A New Equation to Regulate Boost Energy in Accelerated Molecular Dynamics Simulations. J Chem Theory Comput. 2012;8:17–23. doi: 10.1021/ct200615k. [DOI] [PMC free article] [PubMed] [Google Scholar]
- 51.Joseph TL, Madhumalar A, Brown CJ, Lane DP, Verma CS. Differential binding of p53 and nutlin to MDM2 and MDMX: computational studies. Cell Cycle. 2010;9:1167–1181. doi: 10.4161/cc.9.6.11067. [DOI] [PubMed] [Google Scholar]
- 52.Czarna A, Popowicz GM, Pecak A, Wolf S, Dubin G, Holak TA. High affinity interaction of the p53 peptide-analogue with human Mdm2 and Mdmx. Cell Cycle. 2009;8:1176–1184. doi: 10.4161/cc.8.8.8185. [DOI] [PubMed] [Google Scholar]
- 53.Boresch S, Archontis G, Karplus M. Free energy simulations: the meaning of the individual contributions from a component analysis. Proteins. 1994;20:25–33. doi: 10.1002/prot.340200105. [DOI] [PubMed] [Google Scholar]
- 54.Jiang W, Hodoscek M, Roux B. Computation of Absolute Hydration and Binding Free Energy with Free Energy Perturbation Distributed Replica-Exchange Molecular Dynamics (FEP/REMD) J Chem Theory Comput. 2009;5:2583–2588. doi: 10.1021/ct900223z. [DOI] [PMC free article] [PubMed] [Google Scholar]
Associated Data
This section collects any data citations, data availability statements, or supplementary materials included in this article.