Abstract
Introduction
Little is known about when and how progressive spondylolisthesis occurs. In this report segmental motion related to age and disc degeneration at L4/5 disc was investigated.
Materials and methods
637 patients with low back and/or leg pain underwent radiologic and MRI examinations simultaneously. Because 190 patients with conditions which might impede accurate measurement were excluded, 447 patients, comprising 268 men and 179 women, were included; age range, was 10–86 (mean: 53) years. Three radiologic parameters slip in neutral position (mm), sagittal translation (mm), and segmental angulation (degrees) were examined at the L4/5 segment. On T2-weighted MRI, severity of disc degeneration at L4/5 was classified by Pfirrmann’s criteria, grade 1-5.
Results
Results showed stage of disc degeneration that progressed according to aging with significant differences except for between grades 4 and 5. Amount of anterior slip was small among grades 1 to 3; however, it greatly increased between grades 3 and 4 and between grades 4 and 5, suggesting that grade 3 disc degeneration has a potential risk of future progression of anterior slip. This finding may also suggest that once significant slip occurs, it will progress to the final grade. Furthermore, the grade 3 degeneration group exhibited large amounts of motion in both angulation and translation, suggesting it was the most unstable group.
Conclusion
Our results with radiography and MRI indicate that grade 3 disc degeneration is a critical stage for the progression of lumbar spondylolisthesis at L4/5 segment.
Keywords: Lumbar spine, Disc degeneration, Instability, Spondylolisthesis, MRI
Introduction
Lumbar degenerative spondylolisthesis is thought to be related to low back pain (LBP) and instability, leading to the development of spinal canal stenosis, which often needs surgical treatment in elderly patients [8]. The causes of spondylolisthesis are multifactorial and include an older age, female gender, facet orientation and tropism, spinal alignment, weakness of trunk muscles, and disc degeneration. Above all, intervertebral disc degeneration is the potential key contributor to spondylolisthesis [10, 13]. Although cross-sectional studies have been carried out across the generations, the relationship between disc degeneration and lumbar symptoms remains controversial. Some studies have reported an intimate relation [4, 19], while others have contradicted this finding [15, 17]. Kirkaldy-Willis and Farfan [11] reported that the stages of spondylolisthesis were related to treatment selection, and the unstable stage possibly changed to the re-stabilization stage with the progression of disc degeneration and age as a result of a decrease in disc height and the development of osteophytes around the segment. In fact, it is frequently observed that a disc that is severely degenerated on MRI shows the lowest disc height and/or spur formation with reduced instability [1, 13].
Many researchers agree with Kirkaldy-Willis’s proposal; however, few cohorts exist with continuous radiological study of each patient enabling the examination of the progression of spondylolisthesis. Causative factors of spondylolisthesis are well studied [10, 13, 14]; however, little is known about when and how progressive slip occurs. If evidence of when and how slip occurs could be found, appropriate intervention might prevent or postpone the unstable stage and the accompanying increased narrowing of the spinal canal. For this purpose, the authors examined the progression of spondylolisthesis by comparing the degree of anterior slip at L4/5 with the two study aspects of age and degenerative MRI grade of the disc in a large study population clearing an attempt to clarify the relationship between progressive slip and age and disc degeneration grade.
Clinical materials and methods
Six hundred and thirty-seven outpatients with LBP and/or leg pain underwent radiologic and MRI examinations simultaneously within a 2-month interval. Anteroposterior and three lateral view radiographs in flexion, neutral, and extension, with patients in standing position were taken in each patient. For lateral views, patients were asked to move their trunk maximally without special apparatus or with handrail if necessary [7]. MRI scans were obtained using a 1.5 T clinical magnet (Magnetron Vision, Siemens, Germany) with a sagittal T2-weighted imaging sequence (TR 3,400 ms, TE 120 ms, FOV 280 mm, sliced with 5 mm). Patients were scanned in supine position with flexed knee position.
In order to ensure the precise measurement of segmental motion at L4/5 disc, 190 patients with conditions, which might impede accurate measurement, were excluded from the study. The exclusion criteria were infection, tumors, trauma, previous surgery, spondylolysis, spondylolisthesis at other segments, scoliosis of more than 10°, osteoporosis with compression fracture, and unsuitable radiographs (no parallel-beam projection into the disc) [8]. The remaining 447 patients, 268 men and 179 women, were included in this study with an age range of 10–86 years (mean ± SD 53.0 ± 19.8).
Evaluation of segmental motion
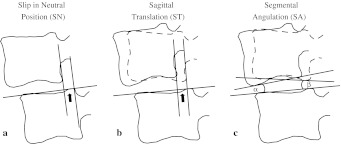
Segmental motion at L4/5 discs was assessed by three variables: anterior slip in neutral position (SN), sagittal translation (ST), and segmental angulation (SA). Measurement of each slip was performed using the method described previously [6], which requires only three landmarks to determine the extent of slippage: the anterior edge and the posterior edge of the upper endplate at L5, and the inferior posterior edge at L4 (Fig. 1). A more reliable result can be expected using this system compared with other methods using more than four landmarks [21]. Briefly, a base line is drawn passing the two landmarks at the superior endplate of L5. The distance between the two lines perpendicular to the base line and passing the two landmarks at the posterior inferior edge of L4 and posterior superior edge of L5 vertebra is obtained on each film. The amount of sagittal translation is obtained as the difference of the displacement between flexion and extension. Segmental angulation was also measured as the difference of intervertebral angles from extension to flexion; β- (-α) with positive angle of anterior opening (Fig. 1). A detailed method was described previously elsewhere [6, 7].
Fig. 1.
Measurement of segmental motion. A base line is drawn passing the two landmarks at the superior endplate of L5. The distance between the two lines perpendicular to the base line and passing the two landmarks at the posterior inferior edge of L4 and posterior superior edge of L5 vertebra on the lateral view film in neutral position is defined as slip in neutral position (a). The amount of sagittal translation is obtained as the difference of displacement between flexion and extension (b). Segmental angulation [β- (-α); positive angle of anterior opening] is also measured as the difference of intervertebral angles from extension to flexion (c)
Radiologic evaluations were performed by three examiners blinded to patient data independently. Measurement validation was also performed by the same method described in the previous paper [6]. Correlation coefficient in the study of angulation was more than 0.89 and average differences were less than 1.7° in intra-observer examination. Correlation coefficient was more than 0.93 and average differences were less than 1.5° in inter-observer examination. In the studies of translation, correlation coefficient was more than 0.84 and average differences were less than 0.5 mm in intra and inter-observer examinations. Furthermore in the study of slip-in-neutral-position, correlation coefficient was more than 0.92 and average differences were less than 0.5 mm in both intra and inter-observer examinations demonstrated higher quality of measurements.
MRI evaluation of disc degeneration
Evaluation of disc degeneration by MRI was performed according to a criterion proposed by Pfirrmann et al. [20] grade 1–5, almost normal to severe degeneration. MRI examinations were performed by three examiners blinded to patient condition. Pfirrmann’s classification was determined by each observer at the same place and the distinction was corrected by discussion.
Statistical analysis
Statistical examination was performed using one-way ANOVA (Fisher’s PLSD) and p values less than 0.05 were regarded as significant.
Results
There were 29 patients in grade 1, 37 patients in grade 2, 127 patients in grade 3, 171 patients in grade 4, and 83 patients in grade 5 (Table 1). The mean age of the grade 1 group was the youngest, and the mean age of the other groups increased according to disc degeneration. There were significant statistical differences among the groups except in comparison between the grade 4 and 5 groups, showing a clear relationship between age and disc degeneration.
Table 1.
Distribution of patient age and gender with the grades of disc degeneration
| Disc degenerationa | Men | Women | Mean age ± SD* |
|---|---|---|---|
| Grade 1 | 16 | 13 | 23.0 ± 8.6 |
| Grade 2 | 25 | 12 | 33.0 ± 12.5 |
| Grade 3 | 87 | 40 | 49.6 ± 18.1 |
| Grade 4 | 88 | 83 | 60.6 ± 15.9 |
| Grade 5 | 52 | 31 | 61.1 ± 17.5 |
| Total | 268 | 179 | 52.8 ± 19.8 |
SD standard deviation
* Significant statistical difference was observed among the groups except for between grades 4 and 5
aPfirrmann’s classification grades
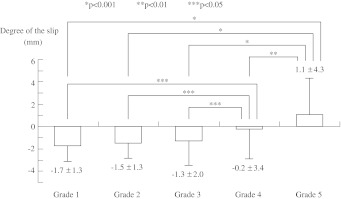
The measured mean amount of SN in each degenerative disc group was −1.7 ± 1.3 mm in grade 1, −1.5 ± 1.3 mm in grade 2, −1.3 ± 2.0 mm in grade 3, −0.2 ± 3.4 mm in grade 4, and 1.1 ± 4.3 mm in grade 5 group (Fig. 2). Negative value of SN indicated the posterior inferior edge of L4 vertebra was located more posterior than the posterior superior edge of L5 vertebra in this measuring method (Fig. 1). Retrolisthesis at L4/5 segment existed in the normal or less degenerated disc groups (grade 1, 2, and 3), and the L4 vertebra significantly slipped anteriorly according to further progression of disc degeneration (p < 0.05). Progression of the anterior slip in the less degenerated disc groups was small (0.2 mm); however, its length increased to 1.1 mm between the grade 3 and 4 groups, and to 1.3 mm between grades 4 and 5. Thus significant development of anterior slip between grades 3 and 4 indicates that the grade 3 disc has a potential risk of future progression of anterior slip.
Fig. 2.
Slip in neutral position (SN) with the grades of disc degeneration. Amount of slip in each degeneration group from grades 1 to 4 showed retrolisthesis in these measuring methods indicating the posterior inferior edge of L4 was located posterior to the posterior superior edge of L5 and anterolisthesis, in the grade 5 degeneration group. Along with progression of disc degeneration, L4 slips anterior on L5 vertebra. Anterior slippage between groups grades 1–3 and grade 4, and between groups grade 4 and 5 was significantly greater
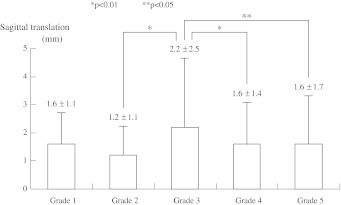
The measured mean amount of ST was 1.6 ± 1.1 mm in grade 1, 1.2 ± 1.1 mm in grade 2, 2.2 ± 2.5 mm in grade 3, 1.6 ± 1.4 mm in grade 4, and 1.6 ± 1.7 mm in grade 5 (Fig. 3). The ST of the grade 3 group was the largest among the groups and was significantly different from other groups except for grade 1. This result indicates that the grade 3 disc is the most unstable in the assessment of L4 translation between the flexed and extended positions.
Fig. 3.
Sagittal translation (ST) with the grades of disc degeneration. The grade 3 group of Pfirrmann’s disc degeneration demonstrated the largest amount of sagittal translation among the groups except for the grade 1 group
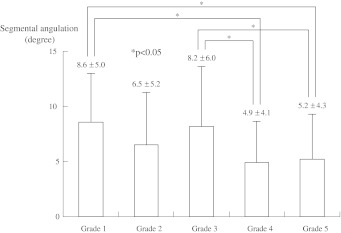
Measured mean degree of SA was 8.6 ± 5.0° in grade 1, 6.5 ± 5.2° in grade 2, 8.2 ± 6.0° in grade 3, 4.9 ± 4.1° in grade 4, and 5.2 ± 4.3° in grade 5 (Fig. 4). Segmental angulations of grade 1 and grade 3 demonstrated significant larger angulations than grade 4 and 5 groups. These results indicate that both grade 1 with no disc degeneration and grade 3 with moderate disc degeneration have statistically larger degrees of angulation than the more degenerated groups of grade 4 and 5. Thus, the grade 3 disc also exhibits significant unstable motion in the assessment of L4 angulation between the flexed and extended positions. On the other hand, the grade 2 group showed the lowest translation and reduced angulation. This might suggest this group is the most stable stage of the less degenerated disc groups. Our results with radiography and MRI all indicated that grade 3 disc degeneration is a critical stage for the progression of lumbar spondylolisthesis at L4/5 segment.
Fig. 4.
Segmental angulation (SA) with grades of disc degeneration. Segmental angulations of grade 1 and 3 groups with Pfirrmann’s classification were significantly larger than the other groups with severe disc degeneration
Discussion
A few papers have reported about the relationship between disc degeneration and age [2, 6, 16], but no paper, to the best of the authors’ knowledge, has reported the considerable age distribution of each degeneration grade. The mean age of each degeneration grade at L4/5 disc progressed along with the progress of degeneration. Differences of the mean age between grade 1 and 2 as well as grade 3 and 4 were about 10 years, and almost no difference was observed between grades 4 (60.6 years) and 5 (61.1 years). Age difference between grades 2 and 3 was about 16 years, the longest interval, and the standard deviation of grade 3 was also the largest among the groups.
This study showed that the grade 2 degeneration group had the least translation among all groups and had the least angulation among the less degenerated groups of grades 1–3. Therefore, it is considered that the grade 2 groups seemed to be the most stable and lasts the longest stretching from the twenties to the forties in age. Grade 3 degeneration is also characterized as the most unstable stage but with less anterior slip because of the large translation and angulation among the groups. Kong et al. [12] reported that the prevalence of ≥3 mm translational motion is significantly observed in patients with grade 4 (Pfirrmann) degenerated discs and grade 3 (Fujiwara) arthritic facet joints using kinematic MRI. Brown et al. [3] also reported a similar result showing grade 3 disc degeneration on MRI had the least stiffness of 655 motion segments in 298 surgically treated patients. In our study, the amount of anterior slip was larger between grade 3 and 4 and between grade 4 and 5 (Fig. 2). This phenomenon may indicate that once a significant slip occurs, it will progress to the final grade. Therefore, the authors conclude that grade 3 degeneration is a critical stage for spondylolisthesis, just before the stage of progressed slip with instability [8]. As to the questions of “when anterior slip occur”, “during or end of the grade 3 degeneration, the slip occur” is answered. About “how”, no answer was obtained from this study. Many factors such as gravity, spinal alignment, weakness of trunk muscles, damage of ligaments, and soft tissues related to genetic abnormality were considered as the authors speculated in the previous paper [7]. Intimate relationship between grade 3 degeneration and progression of anterior slip has become apparent by this study. More detailed study is necessary to examine what kinds of factors promote the slip progression in the grade 3 population.
An interesting finding was observed in the assessment of degeneration grade and segmental angulation. Both groups grade 1 and 3 showed more angulation than the others. Furthermore, grade 1 group showed more angulation and translation than grade 2. These findings are counterintuitive because it seems more natural that more instability occurs with the progression of disc degeneration. However, the mean age of each degeneration grade is increasing along with disc degeneration (Table 1) and excessive motion of the segmental angulation has been previously reported as common in patients in their late teens and early twenties [6, 18]. The reason of this phenomenon is unknown. Considering the mean age of the grade 1 group is the youngest, immaturity of skeletal and soft tissue structures may result in hypermobility around the disc segment. Further investigation needs to be conducted into disc degeneration in the younger population.
Could the progression of spondylolisthesis possibly be decelerated or stopped and the next unstable stage postponed by appropriate interventions? Recent reports suggested that physical exercises to increase trunk muscle strength and/or stretching exercises [5, 22] and appropriate body weight control [9, 23] were effective for chronic LBP and for improving quality of life. There is no evidence that these interventions are able to stabilize segmental instability and to prevent further aggressive spondylolisthesis, and it will take long time to prove this hypothesis. The authors believe this paper provides better understanding of the disc degeneration related to the lumbar anterior spondylolisthesis.
As mentioned in the introduction, to prove that grade 3 degeneration is critical for the development of lumbar spondylolisthesis, sequential intra-individual radiological examination of the patient is necessary. Because this is a cross sectional study of a cohort across the generations, this examination has not been conducted in this paper. A more sophisticated study protocol and longitudinal investigation of a cohort will be indispensable. However, the epidemiological information from a large number of subjects about the progression of spondylolisthesis that was obtained in this study might prove useful in understanding the potential risks of grade 3 disc degeneration in the lumbar spine and help determine the indications of various conservative treatments.
Acknowledgments
The authors thank Ms. Janina Tubby for help in preparing the manuscript. No funds were received in support of this study.
Conflict of interest
None.
References
- 1.Axelsson P, Karlsson BS. Intervertebral mobility in the progressive degenerative process. A radiostereometric analysis. Eur Spine J. 2004;13:567–572. doi: 10.1007/s00586-004-0713-5. [DOI] [PMC free article] [PubMed] [Google Scholar]
- 2.Boos N, Weissbach S, Rohrbach H, et al. Classification of age-related changes in lumbar intervertebral discs. Spine. 2002;27:2631–2644. doi: 10.1097/00007632-200212010-00002. [DOI] [PubMed] [Google Scholar]
- 3.Brown MD, Holmes DC, Heiner AD, et al. Intraoperative measurement of lumbar spine motion segment stiffness. Spine. 2002;27:954–958. doi: 10.1097/00007632-200205010-00014. [DOI] [PubMed] [Google Scholar]
- 4.Eifering A, Semmer N, Birkhofer D, et al. Young investigator award 2001 winner: risk factors for lumbar disc degeneration. Spine. 2002;27:125–134. doi: 10.1097/00007632-200201150-00002. [DOI] [PubMed] [Google Scholar]
- 5.Henchoz Y, Goumoëns PD, Norberg M, et al. Role of physical exercise in low back pain rehabilitation. Spine. 2010;35:1192–1199. doi: 10.1097/BRS.0b013e3181bf1de9. [DOI] [PubMed] [Google Scholar]
- 6.Iguchi T, Kanemura A, Kasahara K, et al. Age distribution of three radiological factors for lumbar instability: probable aging process of the instability with disc degeneration. Spine. 2003;28:2628–2633. doi: 10.1097/01.BRS.0000097162.80495.66. [DOI] [PubMed] [Google Scholar]
- 7.Iguchi T, Ozaki T, Chin T, et al. Intimate relationship between instability and degenerative signs at L4/5 segment examined by flexion–extension radiography. Eur Spine J. 2011;20:1349–1354. doi: 10.1007/s00586-011-1793-7. [DOI] [PMC free article] [PubMed] [Google Scholar]
- 8.Kanemura A, Doita M, Kasahara K, et al. The influence of sagittal instability factors on clinical lumbar spinal symptoms. J Spinal Disord Tech. 2009;22:479–485. doi: 10.1097/BSD.0b013e31818d1b18. [DOI] [PubMed] [Google Scholar]
- 9.Khoueir P, Black MH, Crookes PF, et al. Prospective assessment of axial back pain symptoms before and after bariatric weight reduction surgery. Spine J. 2009;9:454–463. doi: 10.1016/j.spinee.2009.02.003. [DOI] [PubMed] [Google Scholar]
- 10.Kim NH, Lee JW. The relationship between isthmic and degenerative spondylolisthesis and the configuration of the lamina and facet joints. Eur Spine J. 1995;4:139–144. doi: 10.1007/BF00298237. [DOI] [PubMed] [Google Scholar]
- 11.Kirkaldy-Willis WH, Farfan HF. Instability of the lumbar spine. Clin Orthop. 1982;165:110–123. [PubMed] [Google Scholar]
- 12.Kong MH, Hymanson HJ, Song KY, et al. Kinetic magnetic resonance imaging analysis of abnormal segmental motion of the functional spine unit. J Neurosurg Spine. 2009;10:357–365. doi: 10.3171/2008.12.SPINE08321. [DOI] [PubMed] [Google Scholar]
- 13.Leone A, Guglielmi G, Cassar-Pullicino VN, et al. Lumbar intervertebral instability: a review. Radiology. 2007;245:62–77. doi: 10.1148/radiol.2451051359. [DOI] [PubMed] [Google Scholar]
- 14.Love TW, Fagan AB, Fraser RD. Degenerative spondylolisthesis, developmental or acquired? J Bone Joint Surg B. 1999;81:670–674. doi: 10.1302/0301-620X.81B4.9682. [DOI] [PubMed] [Google Scholar]
- 15.Luoma K, Riihimäki H, Luukkonen R, et al. Low back pain in relation to lumbar disc degeneration. Spine. 2000;25:487–492. doi: 10.1097/00007632-200002150-00016. [DOI] [PubMed] [Google Scholar]
- 16.Murata M, Morio Y, Kuranobu K. Lumbar disc degeneration and segmental instability: a comparison of magnetic resonance images and plain radiographs of patients with low back pain. Arch Orthop Trauma Surg. 1994;113:297–301. doi: 10.1007/BF00426175. [DOI] [PubMed] [Google Scholar]
- 17.Ochia RS, Inoue N, Takatori R, et al. In vivo measurements of lumbar segmental motion during axial rotation in asymptomatic and chronic low back pain male subjects. Spine. 2007;32:1394–1399. doi: 10.1097/BRS.0b013e318060122b. [DOI] [PubMed] [Google Scholar]
- 18.Paajanen H, Erkintalo M, Dahlström S, et al. Disc degeneration and lumbar instability. Acta Orthop Scand. 1989;60:375–378. doi: 10.3109/17453678909149300. [DOI] [PubMed] [Google Scholar]
- 19.Peterson CK, Bolton JE, Wood AR. A cross-sectional study correlating lumbar spine degeneration with disability and pain. Spine. 2000;25:218–223. doi: 10.1097/00007632-200001150-00013. [DOI] [PubMed] [Google Scholar]
- 20.Pfirrmann CWA, Metzdorf A, Zanetti M, et al. Magnetic resonance classification of lumbar intervertebral disc degeneration. Spine. 2001;26:1873–1878. doi: 10.1097/00007632-200109010-00011. [DOI] [PubMed] [Google Scholar]
- 21.Shaffer WO, Spratt KF, Weinstein J, et al. The consistency and accuracy of roentgenograms for measuring sagittal translation in the lumbar vertebral motion segment: an experimental model. Spine. 1990;15:741–750. [PubMed] [Google Scholar]
- 22.Shirado O, Doi T, Akai M, et al. Multicenter randomized controlled trial to evaluate the effect of home-based exercise on patients with chronic low back pain. Spine. 2010;35:E811–E819. doi: 10.1097/BRS.0b013e3181d7a4d2. [DOI] [PubMed] [Google Scholar]
- 23.Urquhart DM, Berry P, Wluka AE, et al. Increased fat mass is associated with high levels of low back pain intensity and disability. Spine. 2011;36:1320–1325. doi: 10.1097/BRS.0b013e3181f9fb66. [DOI] [PubMed] [Google Scholar]


