Abstract
Purpose
The diagnosis of low back pain pathology is generally based upon invasive image-based assessment of structural pathology, but is limited in methods to evaluate function. The accurate and robust measurement of dynamic function may assist in the diagnosis and monitoring of therapy success. Epionics SPINE is an advanced strain-gauge measurement technology, based on the two sensor strips SpineDMS system, which allows the non-invasive assessment of lumbar and thoraco-lumbar motion for periods of up to 24 h. The aim of this study was to examine the reliability of Epionics SPINE and to collect and compare normative data for the characterisation of spinal motion in healthy subjects. Furthermore, the identification of parameters that influence lumbar range of motion (RoM) was targeted.
Methods
Spinal shape was measured using Epionics SPINE in 30 asymptomatic volunteers during upright standing, as well as maximum flexion and extension, to check intra-rater reliability. Furthermore, back shape was assessed throughout repeated maximum flexion and extension movements in 429 asymptomatic volunteers in order to collect normative data of the lordosis angle and RoM in different gender and age classes.
Results
The lordosis angle during standing in the healthy collective measured with Epionics SPINE was 32.4° ± 9.7°. Relative to this standing position, the average maximum flexion angle was 50.8° ± 10.9° and the average extension angle 25.0° ± 11.5°. Comparisons with X-ray and Spinal Mouse data demonstrated good agreement in static positions. Age played a larger role than gender in influencing lumbar posture and RoM.
Conclusions
The Epionics SPINE system allows the practical and reliable dynamic assessment of lumbar spine shape and RoM, and may therefore provide a clinical solution for the evaluation of lower back pain as well as therapy monitoring.
Keywords: Spine, Back shape, Range of motion, Dynamic functional assessment
Introduction
Low back pain is one of the most common medical complaints [1, 2]. In addition to the use of image-based structural analysis, examination of motion and activity is gaining credibility for supporting clinical diagnosis using non-invasive and objective measures of function [3, 4]. The reason for this could be that besides the reduction of pain, the maintenance or recovery of function is one of the major aims of therapy.
While a number of non-invasive, mostly explorative technologies exist to examine upper body posture and range of motion (RoM), there is currently no established measurement tool in clinical daily routine to assess lumbar spine motion during normal activities of daily living. Instead, the assessment of functional parameters has gained importance in the medical diagnosis of lower back pain, with additional use for therapy monitoring.
Measurement techniques such as Vicon [5], Zebris [6] and Formetric 4D [7] are able to determine posture and RoM, including their temporal changes, but are restricted by the requirement for stationary laboratory infrastructure (Table 1). Other tools such as the Spinal Mouse [8] are less elaborate but are only able to collect spinal posture in static normal or maximum positions. More novel devices are now often portable and thus offer the possibility to collect dynamic changes in upper body movements. Here, the collection of data using the 3D-SpineMoveGuard [9] and inertial measurement units [10], which are based on single sensors attached to the skin, are practicable but do not allow conclusions to be drawn on spinal shape. Other measurement tools such as the CA-6000 [11], fiber-optic sensors [12] and the lumbar motion monitor [13] are not suitable for assessing the conditions during normal activities of daily living due to their bulky construction or not being portable. Furthermore, until now, comprehensive normative data only is available using the CA-6000 [11, 14].
Table 1.
Comparison of non-invasive back measurement devices
| Vicon | Zebris | Spinal Mouse | DIERS formetric 4D | 3D-SpineMoveGuard | CA-6000 | Lumbar Motion Monitor | Epionics SPINE | |
|---|---|---|---|---|---|---|---|---|
| Laboratory | ✓ | ✓ | ✓ | ✓ | ✓ | ✓ | ✓ | ✓ |
| Measurement of daily life | – | – | – | – | ✓ | – | ✓ | ✓ |
| Measurements up to 10 h | – | – | – | – | ✓ | – | ✓ | ✓ |
| Measurements up to 24 h | – | – | – | – | – | – | – | ✓ |
| Weight (g) | ns | ns | ns | ns | 150 | ns | 3,000 | 120 |
| Angles | ✓ | ✓ | ✓ | ✓ | – | ✓ | ✓ | ✓ |
| Angular speed | ✓ | ✓ | – | ✓ | – | ✓ | ✓ | ✓ |
| Dynamic | ✓ | ✓ | – | ✓ | ✓ | ✓ | ✓ | ✓ |
ns not specified
The novel measurement tool Epionics SPINE is an advancement of the former SpineDMS sensor strips [15], and allows the assessment of back shape using strain-gauge technology. Inbuilt accelerometers allow the additional detection of orientation of the upper body relative to the earth’s gravitational field. The system is portable and lightweight, therefore offering the unhindered measurement of upper body posture during activities of daily living over a period of 24 h. Characterisation of normal spinal motion using such an approach could provide normative data for comparing spinal kinematics in patients suffering from, e.g., lower back pain.
The aim of this study was to investigate intra-rater reliability in the measurement of back shape, as well as to collect and compare normative data in healthy subjects using the novel measurement tool Epionics SPINE. In addition, we aimed to identify parameters that influence RoM in the lumbar spine.
Materials and methods
Measuring system
Epionics SPINE (Epionics Medical GmbH, Potsdam, Germany) is a measurement system for the assessment of lumbar and thoraco-lumbar spinal posture and motion. The device is a development of the former SpineDMS system, for which the validity and reliability has already been investigated [15].
The measurement system consists of two sensor strips based on strain-gauge technology that allows the collection of relative segment angles at a frequency of 50 Hz. Each sensor strip measures angles in 12 pre-determined 25-mm-long segments that are fixed onto the surface of the back via special hollow plasters. The position of the sensors is standardized paravertebrally, with each sensor positioned approximately 5 cm from the spinal column (Fig. 1). Two sensor strips are used to allow the longer term goal of identifying movements and rotations outside of the sagittal plane. In the vertical direction, the device is positioned in a standardized manner by fixing the caudal sensor segment to the spina iliaca posterior superior. The sensors strips are then able to slide within the flexible plaster relative to this reference position according the to the subject’s movements. A three-dimensional accelerometer is located at the lower end of each sensor strip, which allows the detection of the sensor’s orientation in relation to the earth’s gravitational field. The sensors are connected by cables to a storage unit, which is able to either transmit the data in real-time via Bluetooth to a local PC or to save the collected data on its internal memory. Once correctly fitted, the device allows the objective detection of spinal motion during normal daily living without supervision.
Fig. 1.
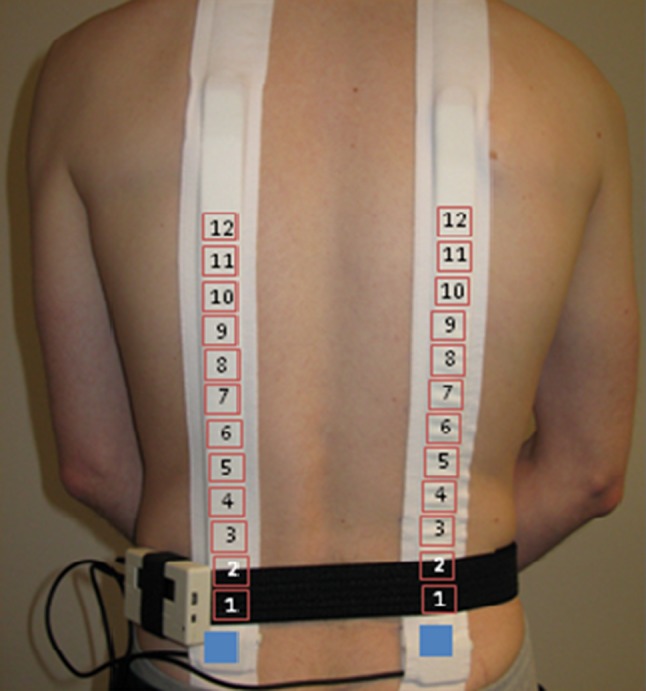
Epionics SPINE system with sensor segments and acceleration sensors
Subjects
In order to investigate the reliability of the device, 30 asymptomatic volunteers were measured using Epionics SPINE (14 females, 16 males, age 35.1 ± 12.8 years, weight 73.7 ± 12.6 kg, height 176.5 ± 7.8 cm, BMI 23.6 ± 3.2 kg/m2).
After the reliability study, 429 volunteers participated in the main study, and were divided into categories of age, gender, body height, weight and BMI (Table 2). The female’s body height was 167.1 ± 7.0 cm and the male’s 180.0 ± 8.0 cm. Only subjects who had not suffered from back pain within the last 6 months and who had never undergone spine surgery were included in this study. The study was approved by the local Ethics Committee, and each volunteer provided written informed consent to participate.
Table 2.
Categorized classes and number of volunteers; mean, standard deviation (SD), minimum and maximum of individual factors
| Classes (n) | Mean ± SD | Minimum | Maximum | ||||
|---|---|---|---|---|---|---|---|
| Age (years) | 20–35 (189) | 36–50 (146) | 51–75 (94) | – | 39.8 ± 14.0 | 20 | 74 |
| Gender | Female (231) | Male (198) | – | – | – | – | – |
| Height (cm) | <160 (28) | 160–175 (229) | 176–190 (153) | >190 (19) | 173.3 ± 9.8 | 148 | 206 |
| Weight (kg) | <61 (97) | 61–70 (120) | 71–80 (110) | >80 (102) | 72.3 ± 13.7 | 45 | 130 |
| BMI (kg/m²) | <18.5 (12) | 18.5–24.9 (279) | 25–30 (108) | >30 (30) | 24.1 ± 3.6 | 16.7 | 38 |
Measurement protocol
To measure the maximum RoM, the volunteers were equipped with Epionics Spine and asked to conduct upper body maximum flexion and extension exercises with extended knees. Prior to carrying out the exercises, each volunteer was shown video clips of a person performing the individual exercises, in order to standardize the respective movements. Additional verbal instructions were provided to ensure the correct execution of the individual choreographies. Each exercise (maximum flexion and extension) was performed five times, with upright standing recorded several times between the exercises, as a reference position.
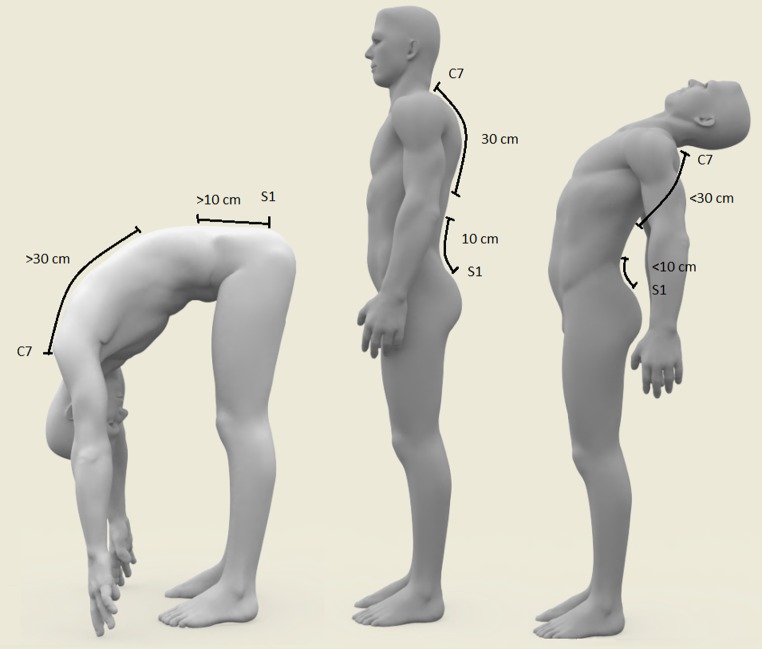
Common functional tests, such as the measurement of the fingertip-to-floor distance at maximum flexion and the Schober and Ott sign [16], were captured for each volunteer. For the Schober test, a tag is made from the spinous process of the sacral vertebra S1, 10 cm cranially and for the Ott test, from the level of the spinous process of the cervical vertebra, C7, in a caudal direction. Then the elongation and compression of distances between these tags to the processes of S1 and C7, respectively, were measured during maximum flexion and extension activities [16] (Fig. 2). Measurement of each parameter was undertaken in the reliability test by the same observer and repeated on three different days (within five days) each at a similar time of day.
Fig. 2.
Measurements taken for determining Schober and Ott signs [16]. The changes of the distance during flexion and extension relative to standing measured in the lumbar region represent the Schober sign and the changes in the thoracic region represent the Ott sign
Data analysis
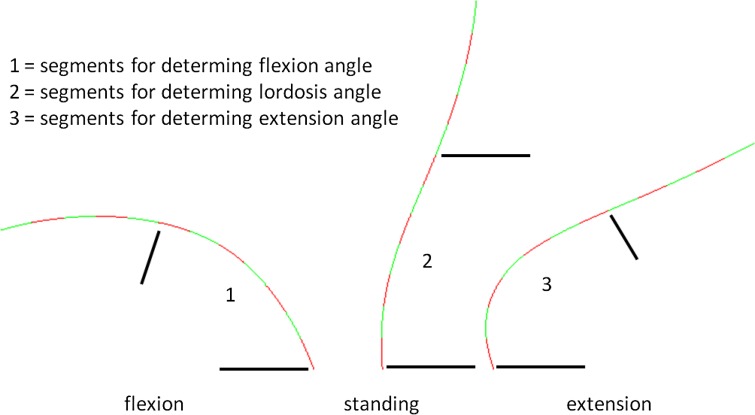
The sensors’ segmental angles were evaluated for the activities of upright standing, maximum flexion and extension. Here, the transition from lordosis (negative values) to kyphosis (positive values) was defined for each subject at the most cranial segment with a positive value during upright standing (Fig. 3). The lordosis angle was then computed as the sum of all segments below this point with negative values when standing upright. For each volunteer, the sum of the same segments of lordosis during upright standing formed the flexion and extension angle for the activities of flexion and extension. The range of flexion (RoF) and range of extension (RoE) were then determined as the maximum angles relative to the lordosis when standing upright. The range of flexion–extension (RoFE) was defined by the sum of the RoF and RoE.
Fig. 3.
Lateral view of one sensor strip at maximum flexion (left), upright standing (middle) and maximum extension (right) for an exemplary volunteer. The transition from lordosis to kyphosis is, for this example, marked at segment 7. The flexion, lordosis and extension angles were in this case calculated by the sum of the angles in segments 1–7
Statistics
To identify which of the individual factors (age, gender, BMI, body height and weight) had a major influence on posture and sagittal lumbar RoM, an analysis of covariance (ANCOVA) derived from the variables of lordosis angle, RoF and RoE was performed. One-way analyses of variance (ANOVA) were used to examine the statistical variation between groups, with significance set at 0.01. Correlations were computed by the intraclass correlation coefficient (ICC) for the reliability analysis and according to Pearson (paired product-moment correlation coefficient). All statistical analyses were performed using Matlab (The Mathworks Inc., Natick, MA, USA) and SPSS 19 (IBM, Armonk, NY, USA).
Results
None of the volunteers showed any signs of plaster allergy during or after the testing period. The Pearson correlation analysis showed a good to excellent correlation between the left and right sensors for all angles in the sagittal plane (average r = 0.81). The correlation for upright standing was r = 0.85, r = 0.70 for maximum flexion, and r = 0.87 for maximum extension. As a result, all following results describe the mean of both sensor strips.
Reliability
The correlation for the repeated measurements on three different days was very good for segmental results during upright standing (ICC = 0.87), flexion (ICC = 0.86) and extension (ICC = 0.84), with similar results for lordosis (ICC = 0.85), flexion (ICC = 0.83) and extension (ICC = 0.79) angles. The average correlation coefficient was 0.84.
Upright standing
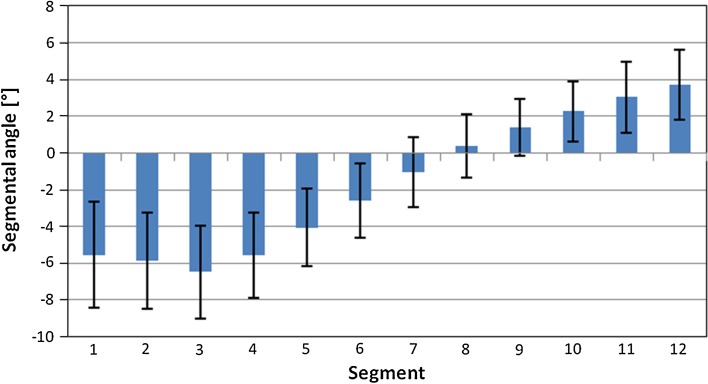
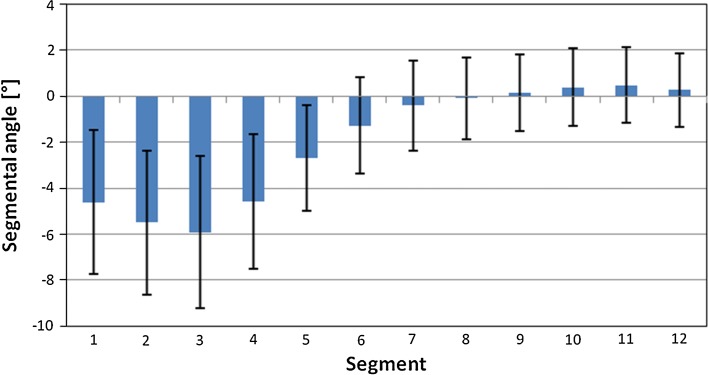
The mean segmental angles during upright standing showed a steady curvature (Fig. 4), in which the first seven segments were negative (lordosis). The largest lordosis angle of approximately −6.5° occurred at segment 3. From there, the segmental angles increased steadily up to segment 12. The transition from lordosis to kyphosis was generally observed between segments 7 and 8.
Fig. 4.
Averaged segmental results during upright standing
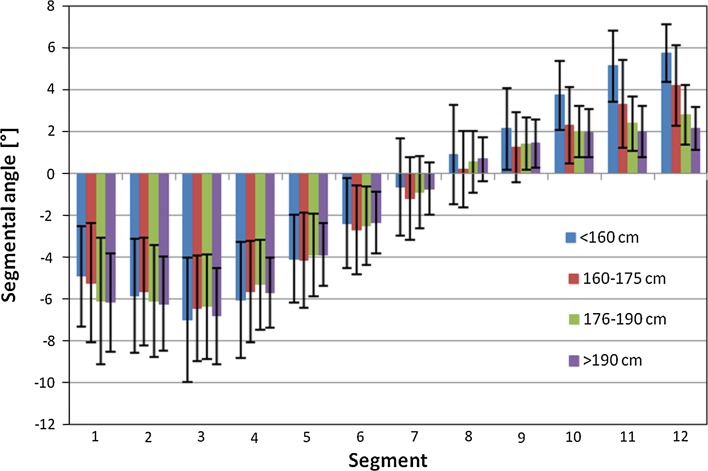
The segmental result for height classes showed a similar trend for upright standing, where significant differences were visible for the upper segments 10–12 (Fig. 5). The transition from lordosis to kyphosis occurred between segment 7 and 8 for all height classes. The average first positive sensor segment was 8.3 (height < 160 cm: 8.2 ± 1.3, 160–175: 8.4 ± 1.6, 176–190: 8.1 ± 1.4, > 190 cm: 8.4 ± 1.6).
Fig. 5.
Segmental results during upright standing for different height classes
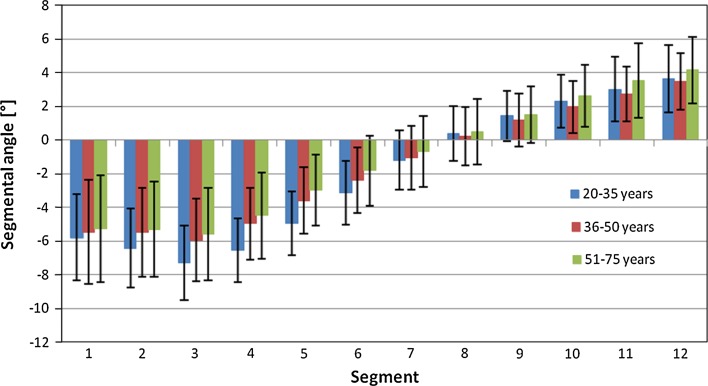
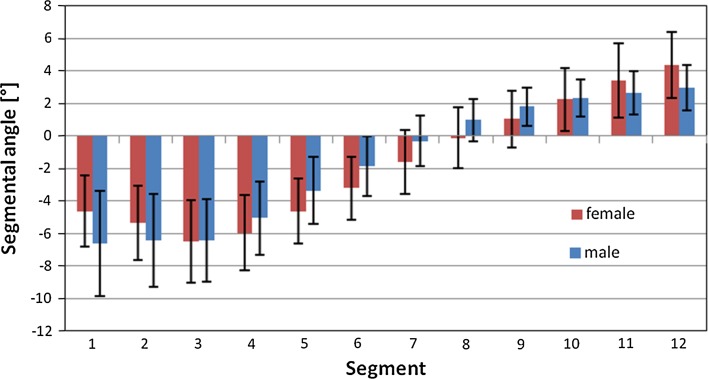
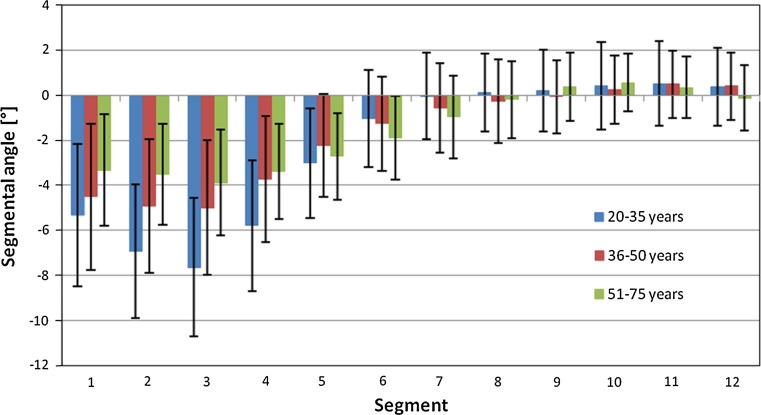
The mean segmental angle during static standing varied with both age and gender (Figs. 6, 7). The mean transition from lordosis to kyphosis occurred at segment 8.7 ± 1.5 for women and at segment 7.7 ± 1.5 for men. The ANCOVA analysis showed that age was the only individual factor that played a considerable role on the lordosis angle (20–35 years: 36.3° ± 8.0°, 36–50 years: 30.3° ± 9.2°, 51–75 years: 27.7° ± 10.4°), and significantly for the group of 20–35 years (p < 0.01) (Table 3). The factors of gender, body height, weight and BMI had only a nominal influence, but males did exhibit higher mean segmental angles in the lower lumbar spine while women had higher values in the upper lumbar spine (Fig. 7). However, the total lordosis angles for women (33.3° ± 9.5°) did not differ significantly (p = 0.022) to men (31.1° ± 10.1°).
Fig. 6.
Segmental results during upright standing for three different age classes
Fig. 7.
Segmental results during upright standing for males and females
Table 3.
Results of ANCOVA analysis referring to lordosis, flexion and extension angle for different classes
| F | p | Eta-squared | |
|---|---|---|---|
| Lordosis | |||
| Age | 45.26 | <0.01 | 0.097 |
| Gender | 4.98 | 0.026 | 0.012 |
| Height | 5.86 | 0.016 | 0.014 |
| Weight | 5.41 | 0.020 | 0.013 |
| BMI | 0.19 | 0.063 | 0.000 |
| RoF | |||
| Age | 30.92 | <0.01 | 0.068 |
| Gender | 0.78 | 0.379 | 0.002 |
| Height | 0.81 | 0.368 | 0.002 |
| Weight | 0.45 | 0.502 | 0.001 |
| BMI | 0.19 | 0.663 | 0.000 |
| RoE | |||
| Age | 60.99 | <0.01 | 0.126 |
| Gender | 9.07 | <0.01 | 0.021 |
| Height | 1.39 | 0.239 | 0.003 |
| Weight | 1.08 | 0.298 | 0.003 |
| BMI | 1.20 | 0.274 | 0.003 |
Bold values indicate statistical significance at less than the 1% level
Flexion
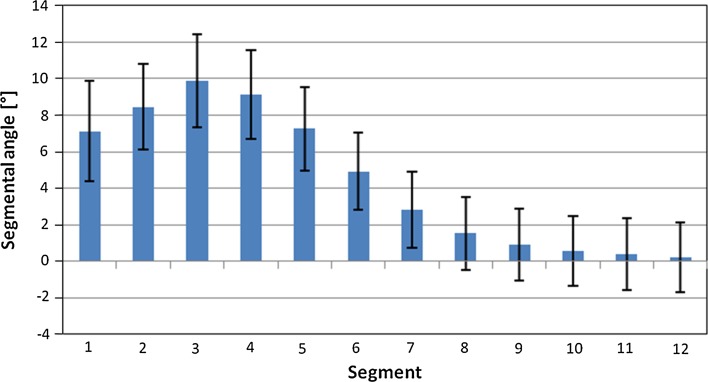
The mean changes of segmental angles at maximum flexion compared to the angles during upright standing showed only positive values (Fig. 8). Here, the angles increased from segment 1 to a maximum of 9.9° in segment 3, before decreasing and becoming consistently lower than 2° in segments 8–12.
Fig. 8.
Changes of segmental angles at maximum flexion relative to upright standing
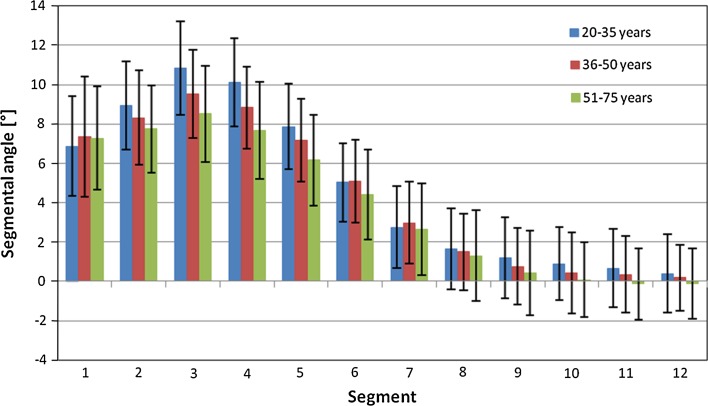
The ANCOVA analysis determined age as the only individual factor with a significant influence to the RoF (Table 3). These differences were largest in the measurement segments with highest deflection (Fig. 9). The factors of gender, body height, weight and BMI played only a secondary role.
Fig. 9.
Changes of segmental angles at maximum flexion relative to upright standing for 3 different age classes
The RoF measured in women were 53.4° ± 9.2° (20–35 years), 52.1° ± 10.0° (36–50 years) and 44.6° ± 13.6° (51–75 years) while the RoFs in males were 54.8° ± 9.4° (20–35 years), 48.4° ± 9.8° (36–50 years) and 45.7° ± 11.4° (51–75 years).
Extension
The mean segmental changes compared to upright standing at maximum extension (lordosis angle at maximum backward bending) were smaller than 6° in all segments (Fig. 10), with the largest angles in segment 3.
Fig. 10.
Changes of segmental angles at maximum extension relative to upright standing
For RoE, the ANCOVA analysis identified age and gender as factors with a significant influence (Table 3). Body height, weight and BMI play only non-significant roles. Here, the extension angles were −33.2° ± 10.8° (20–35 years), −24.2° ± 11.3° (36–50 years) and −19.7° ± 10.0° (51–75 years) for women, while angles of −25.6° ± 9.8° (20–35 years), −20.4° ± 10.9° (36–50 years) and −19.3° ± 8.4° (51–75 years) were observed for men (Fig. 11).
Fig. 11.
Changes of segmental angles at maximum extension relative to upright standing for 3 different age groups
Fingertip-to-floor distance, Schober and Ott signs
The results of the conducted functional tests also showed a decreasing spinal function with increasing age (Table 4). This dependence was most obvious for the fingertip-to-floor distance, but this value also displayed the largest variance. Besides the fingertip-to-floor distance, all tests were conducted at maximum flexion and extension.
Table 4.
Averaged results of functional tests
| Age (years) | |||
|---|---|---|---|
| 20–35 | 36–50 | 51–75 | |
| Fingertip-to-floor distance (cm) | −1.6 ± 11.7 | 0.3 ± 11.9 | 2.8 ± 12.0 |
| Schober sign (flexion) (cm) | 14.4 ± 1.5 | 14.5 ± 1.2 | 14.0 ± 1.2 |
| Schober sign (extension) (cm) | 8.0 ± 0.9 | 8.2 ± 1.2 | 8.6 ± 0.9 |
| Ott sign (flexion) (cm) | 31.9 ± 2.7 | 31.6 ± 1.5 | 31.2 ± 1.3 |
| Ott sign (extension) (cm) | 27.8 ± 2.9 | 28.1 ± 2.7 | 28.4 ± 1.1 |
Discussion
The subject-specific quantification of motion and functionality in the spine is difficult to assess, but could provide objective support in clinical decision-making, as well as a method for monitoring and differentiating between therapy outcomes. To address this deficit, this study has investigated the reliability of assessing spinal flexion and extension angles using a novel measurement system that is both lightweight and portable. In the additional characterisation of maximum flexion and extension angles in healthy subjects, the importance of age in governing the lordosis angle during flexion, as well as age and gender on the range of extension has been demonstrated.
The segmental results during upright standing and maximum flexion and extension demonstrate a distributed spinal curvature, as could be expected. Here, the use of Epionics SPINE has allowed the shape and magnitude of lordosis, as well as the measurable regions of kyphosis, to become clearly visible in different positions. The highest mobility in the sagittal plane was seen in segment 3, the same segment that displayed highest lordosis during upright standing, located approximately at the height of L4. The major flexion and extension occurred in the lumbar region, a result that is in line with previous studies [8, 12] (Table 5).
Table 5.
Comparison of mean results with Epionics SPINE to Spinal Mouse and X-ray at asymptomatic volunteers
| System | Number of subjects | Lordosis (°) | RoF (°) | RoE (°) | RoFE (°) | Study |
|---|---|---|---|---|---|---|
| Epionics SPINE | 429 | 32 | 50 | 25 | 75 | Actual |
| Spinal Mouse | 20 | 32 | 65 | 14 | 79 | Mannion [8] |
| Spinal Mouse | 163 | 25–40a | 51–67a | 12–23a | 63–92a | Steinbeis [17] |
| Radiography | 31 | – | 51 | 16 | 67 | Pearcy [24] |
aMean minimum and maximum of female and male age classes
Unexpected was that the same segment of transition between lordosis and kyphosis was observed when comparing different body heights. Since the same sensor sizes were used for all height classes, the sensor overlays a larger part of the spine for shorter subjects than for taller individuals. It was therefore expected that the transition would occur in lower sensor segments for shorter volunteers. The reason could be that on average, 7 sensor segments covered the lordotic region, corresponding to a sensor length of 17.5 cm, or about 10 % of body height. Thus, a body-height difference of approximately 25 cm would be necessary to cause a distinction of one sensor segment. However, the transition from lordosis to kyphosis was, on average, one sensor segment higher for females than for males, despite females being on average 12.9 cm shorter. Since no significant differences in lordosis angle between women and men could be observed during standing, we conclude that the region of curvature within the spine is distributed differently between genders, with lordosis occurring at lower spinal segments in males than in females. Such differences in spinal shape between female and male volunteers have been observed previously [17–19]. Janssen and co-workers [20] noted that the upper lumbar spine is more dorsally inclined in females, as observed in this study.
The RoM between males and females is discussed controversially in the literature [20–22], although not all studies distinguish between RoF and RoE. In the current paper, gender only played a significant role on the RoE—a finding that is contrary to the results of Troke et al. [14]. Although the reasons for this difference are unclear, the wider range of volunteer age (16–90 years) in that study could have hidden this finding.
The calculation of common postural parameters such as lordosis, flexion and extension angles is helpful for understanding the obtained segmental sensor results using Epionics SPINE. These primary assessment parameters measured in the current study agree well with data from the literature (Table 5). Although smaller RoFs and larger RoEs were generally observed using Epionics SPINE, these results could be due to the small shift of the sensor relative to the back during flexion and extension movements. Here, since the sensors are located at a distance from the neutral axis of the spine, a certain degree of slippage between the spine and the sensor is present, with the sensor segments overlaying a smaller length of the spine at maximum flexion, and a larger length during extension, than compared to standing. Any possible bias in the determination of curvature based on the height of the subject (and therefore the amount of back covered by the sensors) is therefore unavoidable. Compensation for this sensor shifting might be possible within the segment angular calculation, but any such approach would need to be validated against specific in vivo data, and is therefore subject to further investigation.
Changes in posture and RoM have been shown to be dependent on age. The lordosis angle during standing, as well as the flexion and extension RoMs, were all reduced with increasing age. While age and to a lesser degree gender have been shown to play a role on lumbar RoM [11], a larger age effect in men, as observed previously [21] is not visible in the current study. The functional tests (fingertip-to-floor distance, Schober and Ott signs), which are considered to be reliable and objective [23], also show a dependency on age, but not as clearly as the results obtained using Epionics SPINE. Here, the high correlations for the three measurements showed good reliability of Epionics SPINE. Despite a number of individual factors that can influence the measurements, these tests demonstrate that it is possible to generate reproducible results using this segment-based approach to assessing spinal curvature.
It must be noted that the sensors of the Epionics SPINE device measure the shape of the back and not directly the spine. Depending upon the subject’s BMI, it could be that these two measurements differ considerably, and in vivo testing under different BMI conditions would be required before the suitability of Epionics SPINE for testing in patients with a very high BMI is known. Furthermore, although the sensor strips move within the plasters during flexion and extension, no correction for sensor position relative to the spine is currently performed. Further study will be needed before any correction factors here can be fully understood. Here, the evaluation of dynamic parameters and of long-term measurements for determining motion patterns during activities of daily living is underway. Furthermore, it seems possible that the device is able to detect movements out of the sagittal plane, where motions such as rotation and lateral flexion may be detectable by comparing asymmetrical deflections of the right and left sensor strip.
This study demonstrated that Epionics SPINE is a potent non-invasive tool for valid and reliable assessment of spinal motion. Characterisation of the normal posture and range of motions in young and old males and females now lays the foundations for further investigations into detection and monitoring of specific pathological movement patterns.
Acknowledgments
The authors would like to thank the volunteers for their contribution to this study. This study was partially supported by the EU (VPHOP ICT-2-5.3) and Epionics Medical, Potsdam, Germany.
Conflict of interest
T. Consmüller and D. Weinland are employees of Epionics Medical. A. Rohlmann is a consultant of Epionics Medical.
References
- 1.Frymoyer J, Cats-Baril W. An overview of the incidence and costs of low back pain. Orthop Clin North Am. 1991;22:263–271. [PubMed] [Google Scholar]
- 2.Dagenais S, Caro J, Haldeman S. A systematic review of low back pain cost of illness studies in the United States and internationally. Spine J. 2008;8:8–20. doi: 10.1016/j.spinee.2007.10.005. [DOI] [PubMed] [Google Scholar]
- 3.D’Osualdo F, Schierano S, Cisotti C. The evaluation of the spine through the surface. Europa Medicophysica. 2002;38:147–152. [Google Scholar]
- 4.Lin C-WC, McAuley JH, Macedo L, Barnett DC, Smeets RJ, Verbunt JA. Relationship between physical activity and disability in low back pain: a systematic review and meta-analysis. Pain. 2011;152:607–613. doi: 10.1016/j.pain.2010.11.034. [DOI] [PubMed] [Google Scholar]
- 5.Levine D, Colston MA, Whittle MW, Pharo EC, Marcellin-Little DJ. Sagittal lumbar spine position during standing, walking, and running at various gradients. J Athl Train. 2007;42:29–34. [PMC free article] [PubMed] [Google Scholar]
- 6.Vogt L, Pfeifer K, Portscher M, Banzer W. Lumbar corsets: their effect on three-dimensional kinematics of the pelvis. J Rehabil Res Dev. 2000;37:495–499. [PubMed] [Google Scholar]
- 7.Drerup B, Ellger B, zu Bentrup FM, Hierholzer E. Rasterstereographische Funktionsaufnahmen—Eine neue Methode zur biomechanischen Analyse der Skelettgeometrie . Orthopäde. 2001;30:242–250. doi: 10.1007/s001320050603. [DOI] [PubMed] [Google Scholar]
- 8.Mannion AF, Knecht K, Balaban G, Dvorak J, Grob D. A new skin-surface device for measuring the curvature and global and segmental ranges of motion of the spine: reliability of measurements and comparison with data reviewed from the literature. Eur Spine J. 2004;13:122–136. doi: 10.1007/s00586-003-0618-8. [DOI] [PMC free article] [PubMed] [Google Scholar]
- 9.Wunderlich M, Rüther T, Essfeld D, Erren TC, Piekarski C, and Leyk D (2011) A new approach to assess movements and isometric postures of spine and trunk at the workplace. Eur Spine J. doi:10.1007/s00586-011-1777-7 [DOI] [PMC free article] [PubMed]
- 10.Goodvin C, Park EJ, Huang K, Sakaki K. Development of a real-time three-dimensional spinal motion measurement system for clinical practice. Med Biol Eng Comput. 2006;44:1061–1075. doi: 10.1007/s11517-006-0132-3. [DOI] [PubMed] [Google Scholar]
- 11.Dvorák J, Vajda EG, Grob D, Panjabi MM. Normal motion of the lumbar spine as related to age and gender. Eur Spine J. 1995;4:18–23. doi: 10.1007/BF00298413. [DOI] [PubMed] [Google Scholar]
- 12.Williams JM, Haq I, Lee RY. Dynamic measurement of lumbar curvature using fibre-optic sensors. Med Eng Phys. 2010;32:1043–1049. doi: 10.1016/j.medengphy.2010.07.005. [DOI] [PubMed] [Google Scholar]
- 13.Ferguson SA, Marras WS. Revised protocol for the kinematic assessment of impairment. Spine J. 2004;4:163–169. doi: 10.1016/j.spinee.2003.05.002. [DOI] [PubMed] [Google Scholar]
- 14.Troke M, Moore AP, Maillardet FJ, Cheek E. A normative database of lumbar spine ranges of motion. Man Ther. 2005;10:198–206. doi: 10.1016/j.math.2004.10.004. [DOI] [PubMed] [Google Scholar]
- 15.Taylor WR, Consmüller T, Rohlmann A. A novel system for the dynamic assessment of back shape. Med Eng Phys. 2010;32:1080–1083. doi: 10.1016/j.medengphy.2010.07.011. [DOI] [PubMed] [Google Scholar]
- 16.Buckup K (2008) Clinical tests for the musculoskeletal system: examination, sings, phenomena. Thieme, Stuttgart
- 17.Steinbeis S (1999) Alters- und geschlechtsspezifische Normwerte von Rückenform und-beweglichkeit gemessen mit der Rückenmaus. Thesis, Ludwig-Maximilian-University, Munich, Germany
- 18.Cheng XG, Sun Y, Boonen S, Nicholson PH, Brys P, Dequeker J, Felsenberg D. Measurements of vertebral shape by radiographic morphometry: sex differences and relationships with vertebral level and lumbar lordosis. Skelet Radiol. 1998;27:380–384. doi: 10.1007/s002560050402. [DOI] [PubMed] [Google Scholar]
- 19.Vialle R, Levassor N, Rillardon L, Templier A, Skalli W, Guigui P. Radiographic analysis of the sagittal alignment and balance of the spine in asymptomatic subjects. J Bone Joint Surg Am. 2005;87:260–267. doi: 10.2106/JBJS.D.02043. [DOI] [PubMed] [Google Scholar]
- 20.Janssen MM, Drevelle X, Humbert L, Skalli W, Castelein RM. Differences in male and female spino-pelvic alignment in asymptomatic young adults: a three-dimensional analysis using upright low-dose digital biplanar X-rays. Spine J. 2009;34:E826–E832. doi: 10.1097/BRS.0b013e3181a9fd85. [DOI] [PubMed] [Google Scholar]
- 21.Batti′e MC, Bigos SJ, Sheehy A, Wortley MD. Spinal flexibility and individual factors that influence it. Phys Ther. 1987;67:653–658. doi: 10.1093/ptj/67.5.653. [DOI] [PubMed] [Google Scholar]
- 22.Lee S, Wong KWN, Chan MK, Yeung HM, Chiu JLF, Leong JCY. Development and validation of a new technique for assessing lumbar spine motion. Spine J. 2002;27:215–220. doi: 10.1097/00007632-200201150-00022. [DOI] [PubMed] [Google Scholar]
- 23.Fitzgerald GK, Wynveen KJ, Rheault W, Rothschild B. Objective assessment with establishment of normal values for lumbar spinal range of motion. Phys Ther. 1983;63:1776–1781. doi: 10.1093/ptj/63.11.1776. [DOI] [PubMed] [Google Scholar]
- 24.Pearcy MJ. Stereo radiography of lumbar spine motion. Acta Orthop Scand. 1985;56:1–45. doi: 10.3109/17453678509154154. [DOI] [PubMed] [Google Scholar]


