

Abstract
Purpose
Modic changes (MCs) have been suggested to be a diagnostic subgroup of low back pain (LBP). However, the clinical implications of MCs remain unclear. For this reason, the aims of this study were to investigate how MCs developed over a 14-month period and if changes in the size and/or the pathological type of MCs were associated with changes in clinical symptoms in a cohort of patients with persistent LBP and MCs.
Methods
Information on LBP intensity and detailed information from MRI on the presence, type and size of MCs was collected at baseline and follow-up. Changes in type (Type I, II, III and mixed types) and size of MCs were quantified at both time points according to a standardised evaluation protocol. The associations between change in type, change in size and change in LBP intensity were calculated using odds ratios (ORs).
Results
Approximately 40 % of the MCs followed the expected developmental path from Type I (here Type I or I/II) to Type II (here Type II or II/III) or Type I to Type I/II. In general, the bigger the size of the MC at baseline, the more likely it was that it remained unchanged in size after 14 months. Patients who had MC Type I at both baseline and 14-month follow-up were less likely to experience an improvement in their LBP intensity as compared to patients who did not have Type I changes at both time points (OR 7.2, CI 1.3–37). There was no association between change in size of MCs Type I and change in LBP intensity.
Conclusions
The presence of MCs Type I at both baseline and follow-up is associated with a poor outcome in patients with persistent LBP and MCs.
Keywords: Low back pain, Modic changes, Magnetic resonance imaging, Association
Background
Modic changes (MCs) have been suggested to be a specific cause of low back pain (LBP) [14] and have therefore been given increasing attention in recent years. MCs are only seen with Magnetic Resonance Imaging (MRI) and were first described by Modic et al. [24, 26] who identified three types (Type I, II and III). Based on the histological studies [26] Type I was characterised by fissured endplates and vascular granulation tissue adjacent to the endplate, whereas Type II was characterised as disruption of the endplates as well as fatty degeneration of the adjacent bone marrow. Type III appeared to involve sclerosis of the bone marrow as seen on radiographs [24]. MCs are considered to be a stage of the disc degeneration process [8] and it seems to be generally accepted that there exists a ‘developmental pathway’ for the specific types of MCs where Type I develops into mixed Type I/II or into Type II [3, 23, 25, 26].
A review from 2008 [10] investigating the prevalence of MCs and the association with LBP found that the median prevalence of MCs was 43 % in the included clinical populations and 6 % in the non-clinical populations. Positive associations between MCs and LBP were found with odds ratios (ORs) ranging from 2 to 20. More recently, three additional studies [20, 27, 32] reported similar findings, in which ORs for this association were 5, 9 and 28.
One of these studies [32] reported a higher positive predictive value for pain generation with discography for MCs Type I (0.81) than for MCs Type II or III (0.64 and 0.57, respectively). In a non-clinical population, Kjaer et al. [15] found that analysing MCs Type I separately from the other types increased the strength of the association between MCs and LBP. Othori et al. [28] hypothesised that inflammation in the vertebra in MCs Type I was the cause of pain via irritation of sensory nerve fibres. They investigated the level of pro-inflammatory cytokines, which are known mediators of the peripheral inflammatory response, and found that the number of TNF-immunoreactive cells (TNF, tumour necrosis factor) was significantly higher in patients with MCs Type I than in patients with Type II changes [28]. This implies that different types of MCs could have different associations with LBP and different clinical importance.
Furthermore, the size and location of MCs could be of clinical importance. In asymptomatic people, MCs have been reported as being mainly small and located in the anterior parts of the vertebrae at the upper lumbar levels [7]; whereas in people with LBP, MCs are larger, located at the lower lumbar levels [19] and more likely to involve more than just the anterior part of the endplate [9]. Although MCs are known to change from one type to another [26], only 23 % of the persons with MCs in a non-clinical population did not have MCs 4 years later [9].
In summary, MCs are highly prevalent in clinical populations associated with LBP and are known to be fairly consistent over time. However, their clinical implications over time remain unclear. For this reason, the aim of this study was to study how MCs developed over a 14-month period and if change in the type of MCs was associated with change in clinical symptoms.
The specific objectives of this study were to investigate in a group of conservatively treated patients with persistent LBP and MCs (1) how MCs are distributed at each vertebral endplate level at two time points, (2) how the type and size of MCs develop over time, (3) if the development of MCs Type I is associated with increased LBP intensity, and (4) if change in size of MCs Type I is associated with increased LBP intensity.
Method
Study design
Data for this study originated from a (two-group) randomised controlled trial but as there was no treatment effect difference between the intervention groups, this secondary analysis considered the data as being from a (single-group) longitudinal cohort study. Full details of the trial can be found in the article by Jensen et al. [11].
Study sample
Participants in the study were patients from an outpatients clinic with LBP and a minimum of one MC (Type I, II or III) that extended beyond the endplate into the vertebral body (category 2, 3 and 4 in Fig. 1). They had all received conservative treatment while participating in a trial from which information is summarised in Table 1.
Fig. 1.
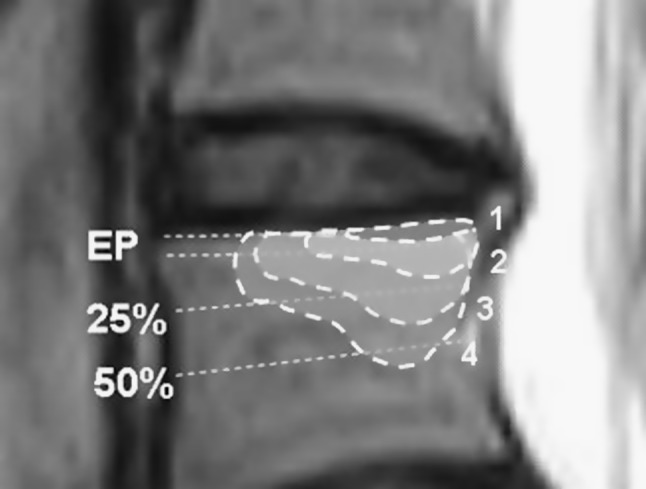
Classification of the size of an MC is related to its relative depth of extension of the vertebral body height: 1 Endplate only, 2 <25 %, 3 25–50 %, and 4 >50 %
Table 1.
Description of the clinical trial
| Participants |
| Recruitment Patients were recruited from a specialised outpatient spine clinic in Denmark after referral from the primary care sector. |
| Selection From August 2007 to December 2008, MRI was routinely performed on all patients meeting the following criteria: (1) no contraindications for MRI, (2) LBP or leg pain of at least 3 on an 11-point Numerical Rating Scale, (3) duration of current symptoms from 2 to 20 months, and (4) age above 18 years. Patients with an MRI showing MCs (Type I, II or III) with an extension beyond the endplate of the vertebra (category 1 in Fig. 1) underwent a clinical examination. |
| Inclusion Patient inclusion criteria were (1) LBP of at least 3 on an 11-point Numerical Rating Scale, (2) LBP greater than any leg pain present, (3) duration of current symptoms from 2 to 12 months, (4) age from 18 to 60 years, (5) ability to read and speak Danish, and (6) a willingness to endplate into the vertebral body. |
| Exclusion Patients were excluded if they (1) were unable to participate in the project because of other physical or mental disorders, (2) had a competing LBP aetiology such as disc herniation with symptomatic root compression, or (3) had undergone previous spinal surgery with no pain relief after the operation. |
| Randomisation By means of computerised minimisation software, patients were allocated into one of the two intervention groups: the new treatment approach (rest groups) and a comparison treatment (exercise group). |
| Intervention |
| Intervention groups The rest group was instructed to avoid hard physical activity and to rest twice daily for 1 h, by lying down and the exercise group received exercises for the stabilising muscles in the low back and abdomen together with dynamic exercises, exercises for postural instability and light physical fitness training. |
| Duration The duration of the interventions was 10 weeks. |
| Follow-up Data were obtained at 10 weeks (post-treatment) and at 62 weeks after baseline (14-months). |
| Ethics The study was approved by the Ethics Committee for the Region of Southern Denmark, approval #S-VF-20060111 and registered in ClinicalTrials.gov Identifier #NCT00454792. |
Data collection and variables of interest
MRIs were obtained at baseline and 14 months later. At both time points, a booklet with questionnaires was distributed to the patients to complete in their own time before the MRI was conducted.
The MRI system was a 0.2 T (Magnetom Open Viva; Siemens AG, Erlangen, Germany) and a body spine surface coil was used with the patient in the supine position. The imaging protocol consisted of sagittal and axial T1- and T2-weighted sequences.
The MRI of the 11 endplates (upper L1 to upper S1), at both baseline and 14-month follow-up, was evaluated by a musculoskeletal radiologist with extensive MRI experience who was blinded to patient information other than the patient’s name, sex and age. MCs were evaluated according to the standardised evaluation protocol ‘Nordic Modic Consensus Group classification’ [12]. Previous evaluation of the protocol by the same radiologist using the same MRI procedure protocol has shown substantial to almost perfect reproducibility with Kappa values for intra-observer reproducibility (κ = 0.77–1.0) and inter-observer reproducibility (κ = 0.73–0.91) [12].
The type of MCs was graded Type I, Type II or Type III as described by Modic et al. [24, 26]. If more than one type was present within the same endplate, that endplate was graded as a mixed Type I/II, mixed Type I/III or mixed Type II/III. The size of the MC was defined as the maximum cranio-caudal extension (0–4) evaluated on the sagittal images as demonstrated in Fig. 1.
Background variables collected at baseline are shown in Table 2. At baseline and follow-up, the outcome measure of current LBP intensity was scored on an 11-point Numeric Rating Scale that ranged from 0 (no pain) to 10 (worst pain) [6, 33].
Table 2.
Baseline characteristics of the participants
| Characteristics | |
|---|---|
| Number enrolled | 96 |
| Sex [female N (%)] | 66 (69) |
| Age [mean (±SD)] | 46 (±9.2) |
| BMI [median (IQR)] | 25 (23–28) |
| BMI distribution [N (%)] | |
| Underweight <18.5 | 0 (0) |
| Normal range 18.5–24.9 | 46 (48) |
| Overweight 25–30 | 32 (33) |
| Obese >30 | 18 (19) |
| Smoking [Yes (%)] | 38 (40) |
| Employed [Yes (%)] | 71 (74) |
| Sick leave [Yes (%)] | 37 (39) |
| Type of occupation [N (%)] | |
| Sitting | 18 (19) |
| Mostly walking | 38 (40) |
| Walking and some lifting | 21 (22) |
| Heavy work | 19 (20) |
| Education [N (%)] | |
| Basic school 8–10 grade | 29 (30) |
| High school | 4 (4) |
| Vocational education | 40 (42) |
| Academic, max. 4 years | 21 (22) |
| Academic, >4 years | 2 (2) |
| Current LBP intensity (0–10) [mean (±SD)] | 5.3 (±1.9) |
| Activity limitation (RMQ) [29] [mean (±SD)] | 13 (±4.3) |
| Quality of life (EQ-5D) [5, 30, 31] [median (IQR)] | 0.7 (0.6–0.8) |
IQR interquartile range, SD standard deviation, BMI Body Mass Index, LBP low back pain, RMQ Roland Morris Questionnaire, EQ-5D EuroQol
Data management and analysis
Description of cohort
Comparisons were made of baseline data between compliers and non-compliers (drop-outs) using t tests or a non-parametric equivalent for continuous variables and Fisher’s Exact Test for categorical variables. Linear regression was used on baseline data to study the baseline association between the presence of Type I, size of Type I and LBP intensity.
Objective 1 and 2
The type and size of MCs were described by frequency tables for each endplate. The development in type and size of MCs for each endplate level was analysed by cross-tabulations of the same variables obtained at the two time points. Linear regression was used on baseline data to assess the relationship between the number of endplates affected with MCs and the age of the patient.
Objective 3 and 4
Association between the development of MCs Type I, the change in size of Type I and the change in LBP intensity over time was analysed using multivariate logistic regression adjusted for age and sex.
The definition of an MC Type I patient was a person with one or more of the 11 endplates containing MCs Type I independent of the presence of other types of MCs. Development of MC Type I was based on the presence of Type I changes present at baseline (yes/no) and at follow-up (yes/no).
A change score of the development of the size of Type I was calculated by subtracting the follow-up score from the baseline score for the largest MC Type I for each patient. The score was dichotomised into decrease in size (a change score >0), or no change/increase in size (a change score ≤0).
Change in LBP intensity was calculated by subtracting the follow-up score from the baseline score giving a raw change score. That score was dichotomised into ‘improvement’ (decrease in LBP intensity as measured by a change score >0), or ‘no improvement’ (no change or increase in LBP intensity as measured by a change score ≤0) and used as the outcome (dependent) variable in these regression analyses.
Significance was set at the 5 % level and all analyses were performed using the Stata version 11 statistical software (StataCorp LP, College Station, Texas, USA).
Results
At baseline, 557 patients were screened with MRI and of those, 244 (44 %) had MCs with a ‘maximum height’ extending beyond the endplate of the vertebral body. Of the 244 potential participants, 110 did not meet the inclusion criteria, 29 declined to participate, four went into another study and one needed acute attention. The remaining 100 patients were included in the study and 96 of those received an MRI at follow-up. Four patients dropped out, one because of contraindication for MRI (pregnancy), one because of personal problems and two because they could not find the time to participate. There were no statistically significant differences in the baseline variables listed in Table 2 between the four patients who dropped out and those who stayed in the study (data not shown).
In all, 96 patients (1,056 endplates) were available and were used for the final analysis. Details of the baseline characteristics are displayed in Table 2. The mean age of the 96 patients was 46 years (range 21–60), 69 % were women and the average pain intensity was 5.3 (SD ± 1.9). The number of patients who had an MC Type I at baseline was 74 (77 %) and of those 18 (24 %) had a size <25 % (category 2), 26 (35 %) had a size between 25 and 50 % (category 3) and 30 (41 %) had a size >50 % (category 4). At baseline, there was no association found between the presence of Type I and LBP intensity (coefficient −0.7, CI −1.7–0.3) or between the size of the MC Type I and LBP intensity (coefficient −0.1, CI −0.4–0.1).
How are MCs distributed at each endplate level at the two time points?
Of the 1,056 endplates, 262 (24.8 %) showed MCs at baseline compared with 269 (25.5 %) at follow-up. On average, patients had 2.7 (range 1–6) endplates with MCs at baseline and 2.8 (range 0–9) at follow-up. The number of endplates affected with MCs per patient at baseline increased significantly with the patient’s age (coefficient 0.03, CI 0.01–0.06, p = 0.005).
The distribution of type and size of MCs obtained at baseline is shown in Table 3 and for the 14-month follow-up in Table 4. When considering only MC-affected endplates, the most common type was Type I (41 %) followed by Type II (34 %) and mixed types (25 %). At follow-up, Type II (42 %) was the most common type followed by Type I (36 %), mixed types (22 %) and Type III (0.4 %). At both time points the size categories 2 and 3 (<25 % and 25–50 %) were the most common. About three-quarters of the MCs were located at the four lowest endplate levels (two lowest disc levels L4/L5 and L5/S1).
Table 3.
Baseline characteristics of MCs
| Vertebral endplate | No MC | Type of MC (n) | Size of MC (n) | ||||||||
|---|---|---|---|---|---|---|---|---|---|---|---|
| Type I | Type II | Type III | Mixed I/II |
Mixed II/III |
Mixed I/III |
EP only | <25 % | 25–50 % | >50 % | ||
| L1 sup. | 95 | 1 | 0 | 0 | 0 | 0 | 0 | 1 | 0 | 0 | 0 |
| L1 inf. | 94 | 0 | 0 | 0 | 1 | 0 | 1 | 0 | 1 | 0 | 1 |
| L2 sup. | 88 | 2 | 4 | 0 | 1 | 0 | 1 | 1 | 5 | 0 | 2 |
| L2 inf. | 87 | 4 | 4 | 0 | 0 | 0 | 1 | 2 | 4 | 1 | 2 |
| L3 sup. | 85 | 4 | 6 | 0 | 0 | 0 | 1 | 3 | 2 | 3 | 3 |
| L3 inf. | 82 | 6 | 5 | 0 | 1 | 1 | 1 | 3 | 7 | 1 | 3 |
| L4 sup. | 78 | 8 | 6 | 0 | 2 | 1 | 1 | 4 | 9 | 4 | 1 |
| L4 inf. | 64 | 10 | 18 | 0 | 4 | 0 | 0 | 7 | 6 | 9 | 10 |
| L5 sup. | 62 | 13 | 18 | 0 | 3 | 0 | 0 | 10 | 12 | 9 | 3 |
| L5 inf. | 27 | 28 | 16 | 0 | 16 | 7 | 2 | 2 | 23 | 26 | 18 |
| S1 sup. | 32 | 29 | 15 | 0 | 13 | 5 | 2 | 12 | 26 | 22 | 4 |
| Total | 794 | 105 | 92 | 0 | 41 | 14 | 10 | 45 | 95 | 75 | 47 |
Baseline distribution of the type and size of MCs allocated on 11 endplate levels from a total of 1,056 endplates from 96 patients with LBP and MCs
sup. superior, inf. inferior, EP endplate
Table 4.
Characteristics of MCs at 14-month follow-up
| Vertebral endplate | No MC | Type of MC (n) | Size of MC (n) | ||||||||
|---|---|---|---|---|---|---|---|---|---|---|---|
| Type I | Type II | Type III | Mixed I/II |
Mixed II/III |
Mixed I/III |
EP only | <25 % | 25–50 % | >50 % | ||
| L1 sup. | 94 | 1 | 1 | 0 | 0 | 0 | 0 | 1 | 1 | 0 | 0 |
| L1 inf. | 90 | 2 | 4 | 0 | 0 | 0 | 0 | 1 | 3 | 1 | 1 |
| L2 sup. | 90 | 3 | 3 | 0 | 0 | 0 | 0 | 2 | 2 | 1 | 1 |
| L2 inf. | 84 | 7 | 3 | 0 | 1 | 0 | 1 | 4 | 5 | 2 | 1 |
| L3 sup. | 79 | 9 | 5 | 0 | 2 | 0 | 1 | 8 | 6 | 0 | 3 |
| L3 inf. | 82 | 5 | 6 | 0 | 1 | 0 | 2 | 3 | 5 | 3 | 3 |
| L4 sup. | 78 | 8 | 6 | 0 | 1 | 0 | 3 | 9 | 5 | 1 | 3 |
| L4 inf. | 64 | 10 | 14 | 0 | 4 | 2 | 2 | 5 | 9 | 10 | 8 |
| L5 sup. | 62 | 14 | 14 | 1 | 2 | 2 | 1 | 10 | 12 | 9 | 3 |
| L5 inf. | 28 | 17 | 30 | 0 | 13 | 6 | 2 | 0 | 9 | 35 | 24 |
| S1 sup. | 36 | 20 | 26 | 0 | 10 | 3 | 1 | 3 | 27 | 26 | 4 |
| Total | 787 | 96 | 112 | 1 | 34 | 13 | 13 | 46 | 84 | 88 | 51 |
Follow-up distribution of the type and size of MCs allocated on 11 endplate levels from a total of 1,056 endplates from 96 patients with LBP and MCs
sup. superior, inf. inferior, EP endplate
How do type and size of MCs develop over time?
Type
Figure 2 shows the development of MC type from baseline to 14-month follow-up. In 49 of the 794 endplates without MC at baseline, new MCs appeared, while in 38 of the 260 endplates with MCs at baseline, the MCs disappeared. In all, 40 % of the endplates with MCs at baseline followed the ‘developmental pathway’ where MCs are expected to change from Type I to mixed Type I/II, Type II or Type II/III and where mixed Type I/II change to Type II or Type II/III. Of the 24 endplates with a Type III component, 7 stayed the same and 17 changed into another type without a Type III component.
Fig. 2.

The development of MCs in relation to type in 1,056 endplates from 96 patients with persistent LBP. The arrows indicate the change of MCs (%) from baseline to 14-month follow-up
Size
Figure 3 shows the development of MC size from baseline to 14-month follow-up. In general, the bigger the size of the MC at baseline, the more likely it was that it remained unchanged in size after 14 months. Small MCs were more likely to have disappeared at follow-up than the larger ones as none of the largest MCs (category 4) had disappeared at follow-up compared with 45 % of the smallest MCs (category 1).
Fig. 3.

The development of MCs in relation to size in 1,056 endplates from 96 patients with persistent LBP. The arrows indicate the change of MCs (%) from baseline to 14-month follow-up
Is development of MCs Type I associated with change in LBP intensity?
Patients who had Type I at both baseline and 14-month follow-up were less likely to have an improvement in their LBP intensity as compared to patients who had some other type of MCs at both time points (OR 9.4, CI 1.8–49) (Table 5).
Table 5.
Association between the presence of MCs Type I and lack of improvement in LBP intensity
| Presence of MCs Type I | Worsening of LBP intensity n (%) | Association | |||
|---|---|---|---|---|---|
| Baseline | 14-months | No | Yes | OR (CI) | p |
| No | No | 10 (83) | 2 (17) | 1 | |
| No | Yes | 8 (80) | 2 (20) | 1.3 (0.1–11) | 0.8 |
| Yes | No | 10 (53) | 9 (47) | 5.3 (0.9–32) | 0.07 |
| Yes | Yes | 21 (38) | 34 (62) | 9.4 (1.8–48) | 0.008 |
The association between the presence of MCs Type I at baseline and 14-month follow-up and the lack of improvement in LBP intensity. No MC Type I present at both time points is used as reference and a positive odds ratio (OR) represents the odds of no improvement
Is change in size of MCs Type I associated with change in LBP intensity?
There was no association between the change in size of MCs Type I and change in LBP intensity (OR 1.0, CI 0.4 to 2.4).
Discussion
The main results of this study are that after 14 months (1) 40 % of the endplates with MCs had followed the ‘developmental pathway’, (2) patients with MCs Type I both at baseline and follow-up had a poor prognosis, and (3) change in the size of MC Type I from baseline to follow-up was not associated with change in pain intensity.
Prevalence of type and size
In the current study, the prevalence of MCs Type I at baseline was 41 and 36 % at follow-up. From other studies we found the prevalence of Type I in clinical populations ranged from 0 to 52 % [1, 2, 4, 13, 16, 18, 21, 22, 26]. This high variation in prevalence is probably due to methodological differences between the studies.
The prevalence of size of MCs in our population cannot be compared with the results from other studies of clinical populations [2, 18]. As described in the “Method” above, we only included patients with a minimum of one MC that extended beyond the endplate into the vertebral body (category 2, 3 and 4 in Fig. 1) and as a result, report an artificially low prevalence (17 %) of MCs located at the endplate only (category 1).
Development in type and size
In the current study, approximately 20 % of both Type I and Type II changes had disappeared completely at follow-up indicating that the presence of MCs is not necessarily permanent. However, our finding that all types of MCs observed could change into almost any other type is inconsistent with the ‘developmental pathway’ which suggests that MCs progress from Type I to mixed Type I/II or to Type II and that all types represent different stages of the same pathological process [3, 23, 25, 26]. Less than half of the endplates that displayed MCs Type I or Type I/II followed the suggested pattern of change over the 14-month follow-up period. Further, the sizes of the large MCs were likely to remain unchanged at the 14-month follow-up which supports a finding reported by others [9].
Of the 24 endplates with a Type III component (mixed Type I/III and II/III), 71 % changed into another type without a Type III component. This is surprising because Type III has been described as advanced sclerosis of the bone marrow [24, 25] and therefore considered irreversible. One possible explanation is that the Type III component is still present but ‘masked’ by the other type present in the mixed type. Supporting this explanation, Kuisma et al. [17] found that all types of MCs could show sclerotic changes when examined by computed tomography (CT), and that especially the mixed types and Type II were associated with sclerosis on CT.
The large MCs were unlikely to have changed size at the 14-month follow-up which supports a finding, previously reported by others [9]. Therefore, the large MCs could seem to indicate a poor prognosis because they do not get smaller or disappear. However, we did not find a cross-sectional association between large MCs and pain intensity at baseline and there was also no association between the change in size of MCs Type I and the change in LBP intensity from baseline to 14-month follow-up and therefore this finding may be clinically irrelevant.
Is development of MCs Type I associated with change in LBP intensity?
We found no cross-sectional association between the presence of MCs Type I and LBP intensity at baseline. However, when investigating the prospective aspect from baseline to 14-month follow-up, we found an association between persistent Type I changes (i.e. Type I at both baseline and follow-up) and lack of improvement in LBP intensity. Approximately three out of four patients with MCs Type I at baseline continued to have Type I after 14 months and the clinical implication is that these patients have a poor prognosis compared with patients without Type I changes at both time points. In contrast to this finding, 80 % (n = 8) of patients who had no MCs Type I at baseline but had developed Type I at the 14-month follow-up had improvement in pain at follow-up. However, the finding is not considered reliable as it was not statistically significant (p = 0.8).
Strengths and weaknesses
The current study is based on the assumption that MCs could be the single cause of pain in some LBP patients. However, MCs are often found along with other MRI findings (i.e. degeneration, bulges, herniations, etc.) that could also cause LBP. Although patients in this study were excluded if they had a competing somatic disease such as disc herniation with symptomatic root compression, it is still very likely that their pain could arise from another pathological finding, or a combination of pathological findings. However, a study from the general population showed that the clinical profile of people with both disc degeneration and MCs was more pronounced than those with only disc degeneration suggesting that MCs are the crucial element in relation to LBP and clinical findings [14]. Also, the pain perception could be affected by psychosocial aspects that are not investigated in this study.
From a positive perspective, the patient cohort used in the current study is very homogeneous according to the inclusion criteria. Also, the MRI evaluation protocol that was used has been reported to be highly reproducible making the results trustworthy. Finally, the drop-out rate was very low (4 %) which has helped minimise bias in relation to the longitudinal analyses.
Further research should involve a greater number of participants to be able to include other MRI findings as well as bio-psychosocial variables. However, longitudinal cohort studies (such as RCTs) are very costly. Therefore, a compromise could be that further research in this area focus on large patient databases systematically collecting data in clinical practice to be able to achieve a sufficient number of patients to do analyses like this.
Conclusions
About 40 % of the endplates with MCs had followed the ‘developmental pathway’ after 14 months, patients with MCs Type I both at baseline and follow-up had a poor prognosis compared to those without MCs Type I at the two time points, and change in the size of MC Type I from baseline to follow-up was not associated with change in pain intensity.
Acknowledgments
Supported by grants from the Danish Foundation of Chiropractic Research and Postgraduate Education and from the VELUX Foundation.
Conflict of interest
None.
References
- 1.Albert HB, Manniche C. Modic changes following lumbar disc herniation. Eur Spine J. 2007;16:977–982. doi: 10.1007/s00586-007-0336-8. [DOI] [PMC free article] [PubMed] [Google Scholar]
- 2.Arana E, Kovacs FM, Royuela A, Estremera A, Asenjo B, Sarasibar H, et al. Modic changes and associated features in Southern European chronic low back pain patients. Spine J. 2011;11:402–411. doi: 10.1016/j.spinee.2011.03.019. [DOI] [PubMed] [Google Scholar]
- 3.Braithwaite I, White J, Saifuddin A, Renton P, Taylor BA. Vertebral end-plate (Modic) changes on lumbar spine MRI: correlation with pain reproduction at lumbar discography. Eur Spine J. 1998;7:363–368. doi: 10.1007/s005860050091. [DOI] [PMC free article] [PubMed] [Google Scholar]
- 4.Bram J, Zanetti M, Min K, Hodler J. MR abnormalities of the intervertebral disks and adjacent bone marrow as predictors of segmental instability of the lumbar spine. Acta Radiol. 1998;39:18–23. doi: 10.1080/02841859809172143. [DOI] [PubMed] [Google Scholar]
- 5.Brooks R. EuroQol: the current state of play. Health Policy. 1996;37:53–72. doi: 10.1016/0168-8510(96)00822-6. [DOI] [PubMed] [Google Scholar]
- 6.Childs JD, Piva SR, Fritz JM. Responsiveness of the numeric pain rating scale in patients with low back pain. Spine (Phila Pa 1976) 2005;30:1331–1334. doi: 10.1097/01.brs.0000164099.92112.29. [DOI] [PubMed] [Google Scholar]
- 7.Chung CB, Vande Berg BC, Tavernier T, Cotten A, Laredo JD, Vallee C, et al. End plate marrow changes in the asymptomatic lumbosacral spine: frequency, distribution and correlation with age and degenerative changes. Skeletal Radiol. 2004;33:399–404. doi: 10.1007/s00256-004-0780-z. [DOI] [PubMed] [Google Scholar]
- 8.Roos A, Kressel H, Spritzer C, Dalinka M. MR imaging of marrow changes adjacent to end plates in degenerative lumbar disk disease. AJR Am J Roentgenol. 1987;149:531–534. doi: 10.2214/ajr.149.3.531. [DOI] [PubMed] [Google Scholar]
- 9.Jensen TS, Bendix T, Sorensen JS, Manniche C, Korsholm L, Kjaer P. Characteristics and natural course of vertebral endplate signal (Modic) changes in the Danish general population. BMC Musculoskelet Disord. 2009;10:81. doi: 10.1186/1471-2474-10-81. [DOI] [PMC free article] [PubMed] [Google Scholar]
- 10.Jensen TS, Karppinen J, Sorensen JS, Niinimaki J, Leboeuf-Yde C. Vertebral endplate signal changes (Modic change): a systematic literature review of prevalence and association with non-specific low back pain. Eur Spine J. 2008;17:1407–1422. doi: 10.1007/s00586-008-0770-2. [DOI] [PMC free article] [PubMed] [Google Scholar]
- 11.Jensen RK, Leboeuf-Yde C, Wedderkopp N, Sorensen JS, Manniche C (2012) Rest versus exercise as treatment for patients with low back pain and Modic changes. A randomised controlled clinical trial. BMC Med 10(1):22 [DOI] [PMC free article] [PubMed]
- 12.Jensen TS, Sorensen JS, Kjaer P. Intra- and interobserver reproducibility of vertebral endplate signal (modic) changes in the lumbar spine: the Nordic Modic Consensus Group classification. Acta Radiol. 2007;48:748–754. doi: 10.1080/02841850701422112. [DOI] [PubMed] [Google Scholar]
- 13.Karchevsky M, Schweitzer ME, Carrino JA, Zoga A, Montgomery D, Parker L. Reactive endplate marrow changes: a systematic morphologic and epidemiologic evaluation. Skeletal Radiol. 2005;34:125–129. doi: 10.1007/s00256-004-0886-3. [DOI] [PubMed] [Google Scholar]
- 14.Kjaer P, Korsholm L, Bendix T, Sorensen JS, Leboeuf-Yde C. Modic changes and their associations with clinical findings. Eur Spine J. 2006;15:1312–1319. doi: 10.1007/s00586-006-0185-x. [DOI] [PMC free article] [PubMed] [Google Scholar]
- 15.Kjaer P, Leboeuf-Yde C, Korsholm L, Sorensen JS, Bendix T. Magnetic resonance imaging and low back pain in adults: a diagnostic imaging study of 40-year-old men and women. Spine (Phila Pa 1976) 2005;30:1173–1180. doi: 10.1097/01.brs.0000162396.97739.76. [DOI] [PubMed] [Google Scholar]
- 16.Kleinstuck F, Dvorak J, Mannion AF. Are “structural abnormalities” on magnetic resonance imaging a contraindication to the successful conservative treatment of chronic nonspecific low back pain? Spine. 2006;31:2250–2257. doi: 10.1097/01.brs.0000232802.95773.89. [DOI] [PubMed] [Google Scholar]
- 17.Kuisma M, Karppinen J, Haapea M, Lammentausta E, Niinimaki J, Tervonen O. Modic changes in vertebral endplates: a comparison of MR imaging and multislice CT. Skeletal Radiol. 2009;38:141–147. doi: 10.1007/s00256-008-0590-9. [DOI] [PubMed] [Google Scholar]
- 18.Kuisma M, Karppinen J, Niinimaki J, Kurunlahti M, Haapea M, Vanharanta H, et al. A three-year follow-up of lumbar spine endplate (Modic) changes. Spine (Phila Pa 1976) 2006;31:1714–1718. doi: 10.1097/01.brs.0000224167.18483.14. [DOI] [PubMed] [Google Scholar]
- 19.Kuisma M, Karppinen J, Niinimaki J, Ojala R, Haapea M, Heliovaara M. Modic changes in endplates of lumbar vertebral bodies: prevalence and association with low back and sciatic pain among middle-aged male workers. Spine (Phila Pa 1976) 2007;32:1116–1122. doi: 10.1097/01.brs.0000261561.12944.ff. [DOI] [PubMed] [Google Scholar]
- 20.Lei D, Rege A, Koti M, Smith FW, Wardlaw D. Painful disc lesion: can modern biplanar magnetic resonance imaging replace discography? J Spinal Disord Tech. 2008;21:430–435. doi: 10.1097/BSD.0b013e318153f7e4. [DOI] [PubMed] [Google Scholar]
- 21.Lim CH, Jee WH, Son BC, Kim DH, Ha KY, Park CK. Discogenic lumbar pain: association with MR imaging and CT discography. Eur J Radiol. 2005;54:431–437. doi: 10.1016/j.ejrad.2004.05.014. [DOI] [PubMed] [Google Scholar]
- 22.Luoma K, Vehmas T, Gronblad M, Kerttula L, Kaapa E. MRI follow-up of subchondral signal abnormalities in a selected group of chronic low back pain patients. Eur Spine J. 2008;17:1300–1308. doi: 10.1007/s00586-008-0716-8. [DOI] [PMC free article] [PubMed] [Google Scholar]
- 23.Mitra D, Cassar-Pullicino VN, McCall IW. Longitudinal study of vertebral type-1 end-plate changes on MR of the lumbar spine. Eur Radiol. 2004;14:1574–1581. doi: 10.1007/s00330-004-2314-4. [DOI] [PubMed] [Google Scholar]
- 24.Modic MT, Masaryk TJ, Ross JS, Carter JR. Imaging of degenerative disk disease. Radiology. 1988;168:177–186. doi: 10.1148/radiology.168.1.3289089. [DOI] [PubMed] [Google Scholar]
- 25.Modic MT, Ross JS. Lumbar degenerative disk disease. Radiology. 2007;245:43–61. doi: 10.1148/radiol.2451051706. [DOI] [PubMed] [Google Scholar]
- 26.Modic MT, Steinberg PM, Ross JS, Masaryk TJ, Carter JR. Degenerative disk disease: assessment of changes in vertebral body marrow with MR imaging. Radiology. 1988;166:193–199. doi: 10.1148/radiology.166.1.3336678. [DOI] [PubMed] [Google Scholar]
- 27.O’Neill C, Kurgansky M, Kaiser J, Lau W. Accuracy of MRI for diagnosis of discogenic pain. Pain Physician. 2008;11:311–326. [PubMed] [Google Scholar]
- 28.Ohtori S, Inoue G, Ito T, Koshi T, Ozawa T, Doya H, et al. Tumor necrosis factor-immunoreactive cells and PGP 9.5-immunoreactive nerve fibers in vertebral endplates of patients with discogenic low back Pain and Modic Type 1 or Type 2 changes on MRI. Spine (Phila Pa 1976) 2006;31:1026–1031. doi: 10.1097/01.brs.0000215027.87102.7c. [DOI] [PubMed] [Google Scholar]
- 29.Patrick DL, Deyo RA, Atlas SJ, Singer DE, Chapin A, Keller RB. Assessing health-related quality of life in patients with sciatica. Spine (Phila Pa 1976) 1995;20:1899–1908. doi: 10.1097/00007632-199509000-00011. [DOI] [PubMed] [Google Scholar]
- 30.Rabin R, CF EQ-5D: a measure of health status from the EuroQol Group. Ann Med. 2001;33:337–343. doi: 10.3109/07853890109002087. [DOI] [PubMed] [Google Scholar]
- 31.The EuroQol Group EuroQol—a new facility for the measurement of health-related quality of life. Health Policy. 1990;16:199–208. doi: 10.1016/0168-8510(90)90421-9. [DOI] [PubMed] [Google Scholar]
- 32.Thompson KJ, Dagher AP, Eckel TS, Clark M, Reinig JW. Modic changes on MR images as studied with provocative diskography: clinical relevance–a retrospective study of 2457 disks. Radiology. 2009;250:849–855. doi: 10.1148/radiol.2503080474. [DOI] [PubMed] [Google Scholar]
- 33.Williamson A, Hoggart B. Pain: a review of three commonly used pain rating scales. J Clin Nurs. 2005;14:798–804. doi: 10.1111/j.1365-2702.2005.01121.x. [DOI] [PubMed] [Google Scholar]