Abstract
Non-reactive, thermoplastic prepolymers (poly- methyl, ethyl and butyl methacrylate) were added to a model homopolymer matrix composed of triethylene glycol dimethacrylate (TEGDMA) to form heterogeneous networks via polymerization induced phase separation (PIPS). PIPS creates networks with distinct phase structure that can partially compensate for volumetric shrinkage during polymerization through localized internal volume expansion. This investigation utilizes purely photo-initiated, free-radical systems, broadening the scope of applications for PIPS since these processing conditions have not been studied previously.
The introduction of prepolymer into TEGDMA monomer resulted in stable, homogeneous monomer formulations, most of which underwent PIPS upon photo-irradiation, creating heterogeneous networks. During polymerization the presence of prepolymer enhanced autoacceleration, allowing for a more extensive ambient cure of the material. Phase separation, as characterized by dynamic changes in sample turbidity, was monitored simultaneously with monomer conversion and either preceded or was coincident with network gelation. Dynamic mechanical analysis shows a broadening of the tan delta peak and secondary peak formation, characteristic of phase-separated materials, indicating one phase rich in prepolymer and another depleted form upon phase separation. In certain cases, PIPS leads to an enhanced physical reduction of volumetric shrinkage, which is attractive for many applications including dental composite materials.
1. Introduction
Photopolymerized materials have been researched extensively because of the advantages they offer during cure, mainly spatial and temporal control along with rapid, on demand curing. This enhanced control is advantageous for applications in the stereo-lithography, coatings, and biomedical fields. Another advantage of photo-initiation is the ability to cure at ambient conditions, which is especially important when studying photopolymerizable dimethacrylate resins utilized as dental materials. These resins are chosen since they can form glassy, densely cross-linked networks upon polymerization and the majority have good biocompatibility and can withstand the challenging oral environment[1-4]. Dimethacrylate photopolymerizations, however, do not avoid the inherent shrinkage and associated stress upon cure that is typical of polymerizations[1-9]. This shrinkage is caused by a reduction in associated free volume as monomer is converted to polymer, and in methacrylic systems leads to a volume reduction ~23 cm3 per mol of converted reactive group[3-5].
When dimethacrylates are utilized in dental composites the associated stress can lead to internal defects as well as separation of the interface from the substrate to which it is bonded[2]. These failures may lead to staining and secondary caries formation. To avoid this, studies have explored methods to compensate for, and potentially eliminate polymerization shrinkage and the associated stress in methacrylic systems, including heterogeneous network formation[1, 3-10].
The Gibbs Free Energy of Mixing thermodynamically dictates phase separation in a multi-component mixture:
| (1) |
A value of ΔGmix> 0 indicates thermodynamic instability, and if diffusion is allowed, will induce phase separation[10-12]. During a polymerization the entropic contribution (Δ Smix) is constantly negative as monomer converts to polymer and the number of molecules in the system decreases; favoring phase separation[10, 13]. The enthalpic contribution (Δ Hmix) is more difficult to generalize; the conversion of π-bonds in monomers to σ-bonds in polymers is an exothermic (Δ Hmix <0) process[14]. However the energetic interactions between neighboring molecules also contribute to Δ Hmix, so it can be negative or positive depending on the system[15].
There are two mechanisms of phase separation: Nucleation and Growth (N&G) and Spinodal Decomposition (SD)[6, 16]. N&G is initiated by a system that is in a metastable state and has phase structure characterized by small, dispersed droplets in a continuous matrix. Assuming diffusion is possible, the dispersed phase increases in size through coalescence while maintaining the same overall shape.[6, 16]. In SD, phase separation is initiated by a system in a highly unstable state, characterized by a spinodal, where the following holds true[6, 16, 17]:
| (2) |
This mechanism yields a co-continuous phase structure that is inter-connected[6, 16-18]. If phase separation persists long enough, coalescence will occur and the phase structure will approach that achieved with N&G. Prior work has cited SD as a more appropriate mechanism for overall shrinkage control[6].
Equally as important as thermodynamics to phase separation process is the kinetics of network development [10, 11, 18]. One critical aspect is the gel point, which is defined as either the first time during the polymerization where one macromolecule spans the entire vessel of reaction, or when the material develops a significant loss of fluidity[14]. It is related directly to the kinetics of the reaction, so the point in conversion at which gelation occurs can shift if there is change in the rate of reaction. Since there is a large reduction in fluidity of the material past the gel point, if its occurs early in conversion, which is known to be the case in dimethacrylate polymerizations, diffusion of incompatible phases may be prohibited thus preventing phase separation despite any thermodynamic instability[12, 19, 20].
Previous work with polymerization-induced phase separation has typically looked at approaches that are inappropriate for the application of dental and other biomaterials. For instance, thermally initiated polymerization-induced phase separation has been shown to yield phase structure typical of N&G as well as SD mechanisms[16]. There has also been significant interest in orthogonal dual-cure systems that result in interpenetrating polymer networks; one example is the combination of methacrylate and epoxy components that are cured by photo or thermal initiation, respectively[10, 11, 18]. Changing the order of cure, as well as the ratio of methacrylate to epoxy components can alter the phase structure in these materials. Allowing the epoxy component, which in this case had the higher modulus, to cure first leads to less heterogeneous materials due to a lack of mobility in the system. However if the cure order is reversed, a more heterogeneous material (indicated by a broader peak in the tan delta profile) is formed resulting in residual unreacted epoxy components residing in the pre-formed methacrylate phase[10, 11, 18]. Unfortunately, this approach is inappropriate for in-situ formed biomaterials since it requires thermal initiation and much longer polymerization times associated with cure of the epoxy components. Additionally, whether applied to IPN systems or single mechanism curing processes, the use of thermal initiation potentially creates greater internal stresses due to post-polymerization thermal contraction effects that can lead to poorly controlled micro/macro void formation in phase-separated polymers.
In this work we modify a bulk homopolymer matrix with non-reactive prepolymer to investigate polymerization-induced phase separation (PIPS) in a purely photo-initiated system. Both the chemical structures of the prepolymers, as well as the amounts added to the bulk homopolymer are varied to explore the impact on the phase-separation process and the final phase composition. The physical mechanism of shrinkage control in materials undergoing PIPS has been explored and discussed to a limited extent; therefore it is our aim to use a relatively simple model system where changes in the material during polymerization are related directly to a single reactive component.
2. Experimental
2.1 Materials
Triethylene glycol dimethacrylate (TEGDMA, Esstech) was utilized in all studies as the bulk homo-polymer matrix, which was modified by the addition of commercially obtained (Aldrich): poly(methyl methacrylate), poly(ethyl methacrylate), and poly(butyl methacrylate) (PMMA, PBMA, and PMMA, respectively). The three prepolymers have different molecular weights and glass transition temperatures (measured using a dynamic mechanical analyzer equipped with powder pockets), as indicated in Table 1, where:
Mw= weight average molecular weight
Tg = glass transition temperature
= refractive index measured at temperature x (OC)
The photo-initiator in all samples was 2,2-dimethoxy-2-phenylacetophenone (DMPA). It is soluble in TEGDMA, and absorbs in the UV region. All experiments utilized 365 (±10) nm light unless otherwise noted.
Table 1.
Pre-Polymer Properties
| Poly(butyl methacrylate) (PBMA) | Poly(ethyl methacrylate) (PEMA) | Poly(methyl methacrylate) (PMMA) |
|---|---|---|
| MW~337,000 Da | MW~515,000 Da | MW~120,000 Da |
| Tg~22.4(±2.5) °C | Tg~72.5(±1.1) °C | Tg~117(±6.0) °C |
| ρ =1.07 g/mL | ρ =1.11 g/mL | ρ =1.19 g/mL |
2.2 Methods
2.2.1 Sample Preparation
For samples with low prepolymer content (up to 10 wt%), the appropriate mass of initiator and volume of TEGDMA were placed in a sample vial and allowed to stir for approximately 10 min until all of the initiator was incorporated. The appropriate mass of prepolymer was then added to the vial and allowed to stir vigorously overnight.
For samples with higher prepolymer contents (greater than 10 wt%) the same procedure was followed as above, except that the monomer was diluted with an equal volume of acetone. Once the prepolymer was completely incorporated into the TEGDMA/DMPA/acetone solution, the solvent was removed under reduced pressure with complete removal verified gravimetrically.
2.2.2 Cloud Point Determination
A polarizing light microscope (Leica DMRXP) equipped with a thermal stage (Linkam LTS 350) and temperature controller (Linkam CI 94) was used to determine the de-mixing temperature in monomer/prepolymer samples. A disc-shaped sample (240 μm thick × 10 mm diameter) sandwiched between a glass slide and a microscope coverslip was placed on the thermal stage. The temperature of the stage was brought to 25 °C and allowed to equilibrate for 1 min. The stage was then cooled to -75 °C at 3 °C/min. Low intensity polarized light was transmitted through the sample throughout the entire temperature profile and the intensity of transmitted light was measured in real time. The de-mixing (cloud point) temperature was determined as the temperature at which a dramatic reduction in the light transmitted through the monomer/prepolymer sample was observed during the cooling cycle[17, 21, 22]. The analogous heating cycle was also observed to validate the cloud point temperature measured.
2.2.3 Viscosity
A parallel-plate rheometer (TA Ares) was employed to measure the initial viscosities of TEGDMA/prepolymer syrups. To accomplish this constant strain (100 s-1) runs of approximately 1.5 min in duration were analyzed for each sample.
2.2.4 Photo-rheometry
The rheometer was also equipped with a UV light source (λ =365±10 nm) that was coupled to an in-house designed optical attachment that provides measurement of the gel point (assigned as the G’/G” crossover point) and methacrylate conversion simultaneously. The methacrylate conversion was monitored using a Fourier transform infrared spectrometer (Thermo Scientific, Nicolet 6700) equipped with near-IR fiber optic cables. The optical attachment, constructed specifically for this set-up facilitated both the uniform irradiance of the UV curing light and the near-infrared source to be directed through the sample, which was sandwiched between two quartz plates (22 mm diameter). Sample thickness was maintained at 300 μm in all experiments. The change in the methacrylate (=CH2) peak area (first overtone at 6165 cm-1) was used to calculate conversion in real time. A chamber was constructed to allow for nitrogen purging of all samples. Each sample underwent one hour of N2 purge before analysis, with the plates separated to approximately 1.5 mm to remove dissolved oxygen and avoid oxygen-inhibited edge effects that otherwise confound the rheologic data. Incident UV light irradiance (Io) was 300 μW/cm2 in all experiments.
2.2.5 Optical density during polymerization
To measure optical properties during polymerization a UV/vis portable spectrometer (Ocean Optics, USB2000) was used. A disc-shaped sample (thickness=240 μm, diameter=10 mm) was secured so that a near-IR source, visible light source, and UV curing light source could transmit simultaneously through the material. The near-IR source was employed to monitor conversion under the same conditions as described above. To follow the changes in optical clarity of the polymerizing sample, the UV/vis spectrometer was employed. A visible light source that emits 400-800 nm wavelength light as a photo probe independent of the photo-initiator was used to transmit visible light through the sample. The intensity of the 600 nm light transmitted was monitored in real time.
2.2.6 Dynamic Mechanical Analysis
A dynamic mechanical analyzer (DMA, Perkin Elmer 8000) configured with thin aluminum pockets, each containing 10 mg of bulk polymer, was used to determine the Tg of the different prepolymers. A single cantilever cyclic displacement of 50 μm at 1 Hz in air was applied as the specimens (n=3) were heated to 180 °C with tan δ data collected as the sample was cooled to 25 °C at 2 °C/min. A separate DMA(TA Q800) was used to characterize polymer structure post-cure. Samples had approximate dimensions of 9.0×3.6×1.0 mm (length × width × thickness) and were analyzed using a temperature sweep under 0.01 % strain. After allowing the sample to equilibrate for 5 min at -50 °C, samples were brought to a temperature of 200 °C at a rate of 3 °C/min, and then cooled to -50 °C at the same rate. All results reported are from the initial scan (ramp up in temperature), and were compared with the secondary scan to ensure no additional thermal cure during analysis. All samples were photopolymerized and then thermally post-cured to ensure conversion greater than 90 % before thermal analysis.
2.2.7 Volumetric Shrinkage
TEGDMA/prepolymer samples were measured before and after polymerization using a helium-purged gas pycnometer (Micrometrics AccuPyc II 1340, Serial No. 841). Polymer densities were measured after TEGDMA/prepolymer samples were exposed to 10 min of UV irradiation (Io=5 mW/cm2). The cell used in all tests was cylindrical and had a total volume of 1 cm3. The experimental volumetric shrinkage was calculated using measured monomer and polymer densities as shown in Equation 3:
| (3) |
3. Results and Discussion
3.1 Monomer/Prepolymer Formulations
3.1.1 Viscosity
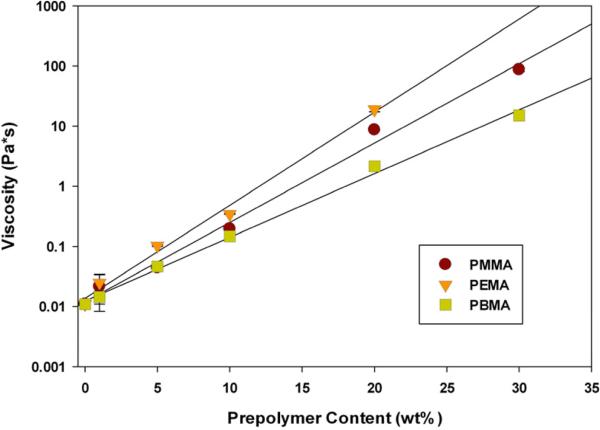
The viscosity of all monomer/prepolymer syrups increases exponentially with increasing prepolymer content (Figure 1). This is attributed to an increase in entanglements between prepolymer and monomer chains. The difference in viscosities between the various prepolymers is primarily due to differences in molecular weight (Table 1). PEMA, with the highest molecular weight, also has the highest viscosity. However, following this logic, PBMA should have the intermediate viscosity, and PMMA the lowest. For this latter pair, the opposite is observed. Since PBMA has the longest side chain group on the repeat unit, it allows for more chain mobility and space between chains, which reduces the entanglement interactions, producing a lower solution viscosity. Sample viscosity imposes a practical limit on prepolymer content when considering an ambient temperature photocurable material. The large increase in viscosity made application as well as analysis of certain samples impractical (TEGDMA/30 wt% PEMA, TEGDMA/30 wt% PMMA).
Figure 1.
Viscosity of TEGDMA/Prepolymer Syrups (n=3). Materials were analyzed under constant strain (100 s-1) for 1.5 min.
3.1.2 De-mixing Temperature
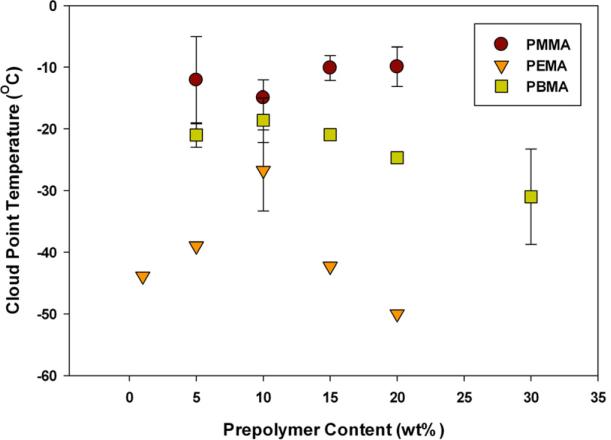
Thermal de-mixing (or cloud point) temperatures as a function of prepolymer content are shown in Figure 2. All samples displayed upper critical solution temperature (UCST) behavior, although over the range covered here, the phase boundary for TEGDMA/PMMA was essentially flat. For all samples the UCST was below 0 °C. This indicates that all samples are stable homogeneous mixtures under ambient conditions. This is advantageous for the system at hand, since the desire is to induce phase separation during polymerization, not prior to initiation. Two samples, 1 wt% PBMA and 1 wt% PMMA displayed no cloud point behavior within limitations of the test. It should be noted, TEGDMA transitions from a liquid to an amorphous glass at -81 °C (monomeric Tg) and no cloud point below this temperature would be expected[23].
Figure 2.
Cloud Point Temperatures (TEGDMA/Prepolymer, n=3). Taken as the onset of turbidity when materials were cooled from 25 °C to -75 °C at a rate of 3 °C/min.
3.2 Polymerization Characterization
3.2.1 Kinetics
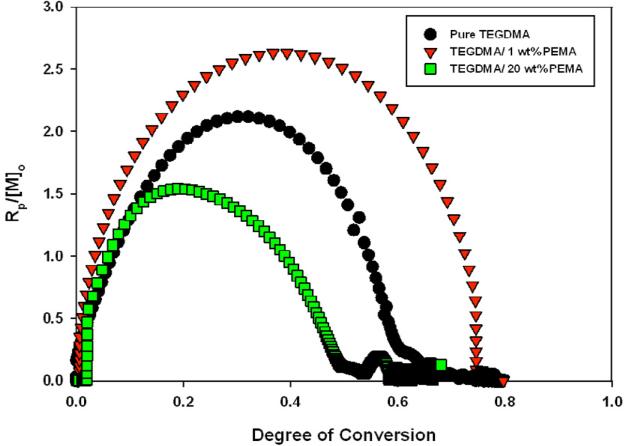
To begin analyzing the PIPS process, the effect of prepolymer on polymerization kinetics was investigated. A representative plot of the normalized (by initial monomer concentration) rate of polymerization, as a function of conversion for different PEMA contents is displayed in Figure 3 (averaged kinetic data with associated error is reported in Tables 3-5). Since the amount of prepolymer loading directly impacts the monomer concentration (and thus, the polymerization rate), all calculations were normalized by the initial monomer concentration to account for behavior due to reduced double bond concentration.
Figure 3.
Kinetic Impact of Prepolymer in TEGDMA/PEMA materials. (mol*ml-1*min-1). Real-time monomer concentration calculated by monitoring methacrylate (=CH2) peak area (first overtone at 6165 cm-1). Io=5 mW/cm2 λ cure=365 nm
Table 3.
TEGDMA/PEMA Kinetics
| Prepolymer Content (wt %) | Rpmax (mol/L/min) | Conversion @ Rpmax | Final Conversion |
|---|---|---|---|
| 0 | 13.1 (±1.2) | 0.30 (±0.04) | 0.76 (±0.03) |
| 1 | 21.4 (±0.5) | 0.39 (±0.01) | 0.80 (±0.01) |
| 5 | 19.1 (±2.7) | 0.36 (±0.02) | 0.80 (±0.01) |
| 10 | 11.6 (±0.9) | 0.32 (±0.02) | 0.85 (±0.01) |
| 15 | 11.0 (±0.4) | 0.35 (±0.01) | 0.80 (±0.01) |
| 20 | 11.8 (±0.3) | 0.37 (±0.02) | 0.84 (±0.01) |
As can be seen, the prepolymer-modified syrup with 1 wt% PEMA has a dramatically enhanced reactivity compared to pure TEGDMA. This is attributed to the increased viscosity that favors early autoacceleration with the high reaction rate leading to a delay in the polymerization rate maximum to approximately 50 % conversion. At this loading, the increase in viscosity selectively restricts diffusion of long chain radical species in the material and, presumably to a lesser extent, diffusion of the inert prepolymers as well. This leads to higher overall conversion in 1 wt% PEMA samples (80 ± 1 %) compared to pure TEGDMA (76 ± 3 %). PEMA also has a Tg lower than that of ambient cured TEGDMA, therefore higher conversion is expected, but the reaction kinetics also affect the ultimate conversion. It should be noted that this increase in initial viscosity does not limit diffusion of prepolymer in the low conversion, pre-gel regime as will be discussed shortly.
There exists a threshold where continued increase in prepolymer loading and initial viscosity actually inhibits the polymerization rate (indicated by the 20 wt% PEMA trend in Figure 3) compared to the control. Depending on the prepolymer additive, this threshold occurs at different loading levels. Beyond the threshold, the viscosity increase is so high that diffusion of all species is restricted and the polymerization rate is decreased. To further show this trend, Table 3 displays the maximum rate of polymerization (Rpmax), as well as the conversion at which it is observed for all modified materials. In all cases n=3, Io=5 mW/cm2.
3.2.2 Phase Separation Characterization
To better understand the potential polymerization-induced phase separation process in these materials, both the gel point and the onset of phase separation were determined as a function of conversion. The gel point was assigned as the G’/G” crossover from the photo-rheological analyses. The onset of phase separation was characterized as the point at which a reduction in intensity of 600 nm light transmitted through the polymerizing sample was observed (i.e. onset of turbidity). This point may actually be an over-estimation of the start of phase separation, because the detection is limited to length scales on the order of the wavelength of light in use. Using this method, phase separation was detected in all formulations except for TEGDMA/1 wt% PMMA and TEGDMA/1 wt% PBMA.
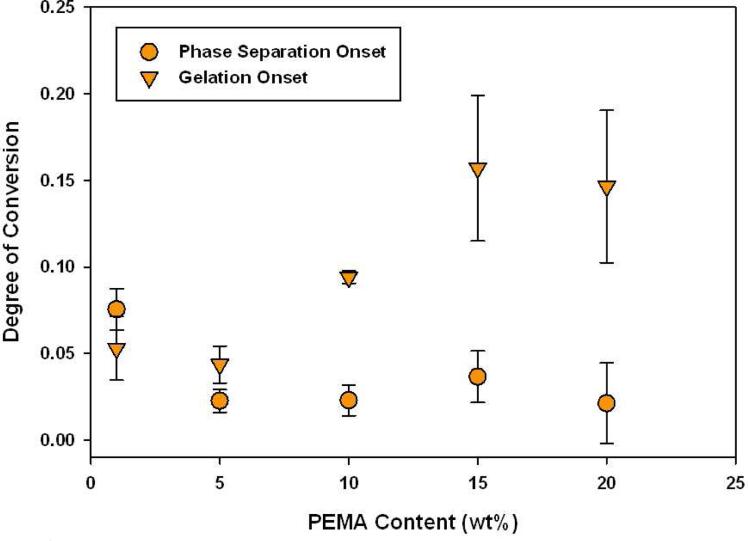
The gel point and onset of phase separation are plotted together in Figure 4 for TEGDMA/PEMA samples. Phase separation either effectively coincides with or precedes gelation, which is true for all the prepolymer compositions tested, which indicates there is a period of time where diffusion of incompatible phases occurs more readily than post-gelation where diffusivity decreases dramatically. In the 1 and 5 wt% PEMA formulations, the gel point occurs earlier in the reaction when compared to the control (0.065 conversion). This is a result of the enhanced autoacceleration occurring in low prepolymer content samples as suppressed termination means longer chains, and this correlates with earlier gelation. Delayed gelation is observed in samples containing greater than 10 wt% PEMA. In these cases, polymerization in the dispersed phase or one of the co-continuous phases is faster and occurs before the overall matrix or secondary co-continuous phase gels.
Figure 4.
TEGDMA/PEMA Gelation and Phase Separation onsets during Polymerization (n=3), as measured by G’/G” crossover point and onset of turbidity respectively, Io=300 μ W/cm2, λ =365 nm
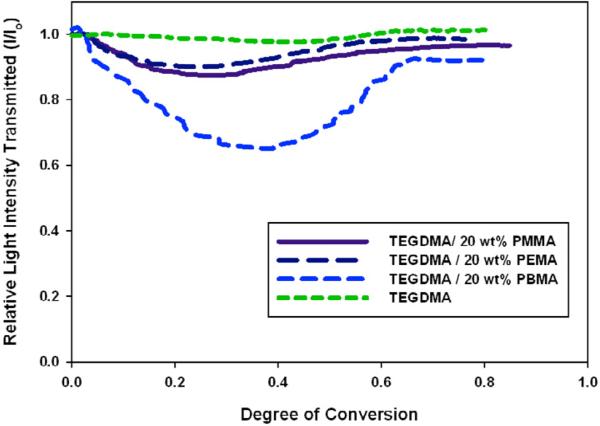
Not only is the onset of phase separation important, but also the characterization and comparison of the phase separation process within the different materials. As previously stated, the onset of phase separation is indicated by a reduction in visible light transmission, or in other words, an increase in turbidity of the material[24]. The increase in turbidity indicates a difference in refractive indices between the two incompatible phases, one prepolymer rich (see Table 1) and one depleted , which can be assumed to undergo polymerization at different rates. There exists a point where the turbidity is at a maximum, which is followed by a recovery period where light transmission increases. While potentially related to decreasing numbers or dimensions of light scattering centers, this decrease in optical density is most likely associated with the secondary phase (or more slowly polymerizing phase) ‘catching up’ or polymerizing to a point that the difference in refractive indices between phases is decreasing. The beginning of this recovery phase appears to coincide with the onset of deceleration in low prepolymer content (up to 15 wt%) materials. This indicates that the observed deceleration period is not just an artifact of viscous development within the material, but suggests that limiting conversion is approached in the TEGDMA/prepolymer phase while a slower network progression continues in the TEGDMA-“homopolymer” phase. This behavior is not observed in higher prepolymer content materials, mostly because the kinetics in both phases is hindered significantly because of high material viscosity, that the Rp development due to enhanced autoacceleration is not observed.
To characterize this process, the change in intensity for the different materials was plotted as a function of conversion. In Figure 5 the process is compared for the three prepolymers at the same loading (20 wt%). There is a distinct difference between the intensity profiles for PBMA when compared to PMMA or PEMA. PBMA induces a much more dramatic intensity reduction while the PMMA and PEMA modified materials experience relatively small intensity reductions. This appears to be an artifact of the difference in viscosities of the samples. Since PBMA has a comparatively much lower initial viscosity, phase separation may proceed more readily with the development of phases that are more divergent in refractive indices (this is supported by phase compositions calculated using DMA, discussed later). In the samples containing PMMA and PEMA, viscosity is so high that diffusion of incompatible phases is more restricted. Therefore the phase separation process does not exhibit such dramatic differences in refractive indices, even though the refractive indices of PEMA and PMMA are marginally more different from TEGDMA (Tables 1, 2).
Figure 5.
Light Transmission during Polymerization for Different Prepolymers (20 wt% PMMA/PEMA/PBMA), Io=300 μ W/cm2, λ cure=365 nm, λ visible=600 nm
Table 2.
TEGDMA/PMMA Kinetics
| Prepolymer Content (wt %) | Rpmax (mol/L/min) | Conversion @ Rpmax | Final Conversion |
|---|---|---|---|
| 0 | 13.1 (±1.2) | 0.30 (±0.04) | 0.76 (±0.03) |
| 1 | 23.3 (±2.8) | 0.41 (±0.03) | 0.78 (±0.03) |
| 5 | 15.4 (±0.7) | 0.39 (±0.01) | 0.81 (±0.02) |
| 10 | 13.9 (±0.6) | 0.35 (±0.01) | 0.80 (±0.03) |
| 15 | 14.3 (±1.2) | 0.37 (±0.03) | 0.80 (±0.01) |
| 20 | 4.41 (±0.5) | 0.14 (±0.03) | 0.81 (±0.01) |
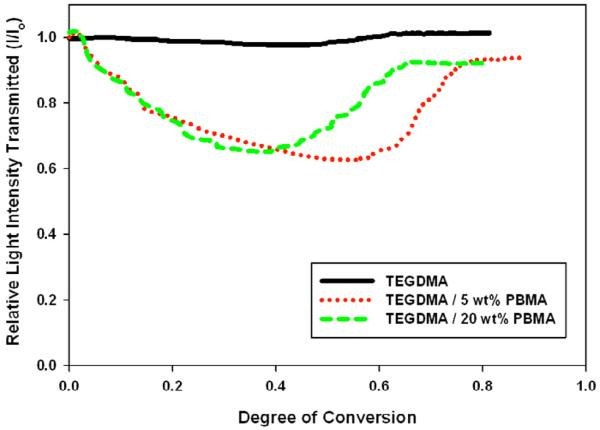
The phase separation process was also compared for each material at different prepolymer loadings. The comparison for PBMA is displayed in Figure 6. Without any prepolymer, there is little relative change in intensity throughout the entire polymerization. Once prepolymer is added, and phase separation is observed, there is a dip in light transmission intensity. The minimum intensity with respect to conversion depends on the amount of PBMA in the sample. At lower loadings, where autoacceleration is enhanced, the minimum intensity occurs at a later conversion.
Figure 6.
Light Transmission during Polymerization at Different Prepolymer Loadings (TEGDMA/PBMA), Io=300 μ W/cm2, λ cure=365 nm, λ visible=600 nm
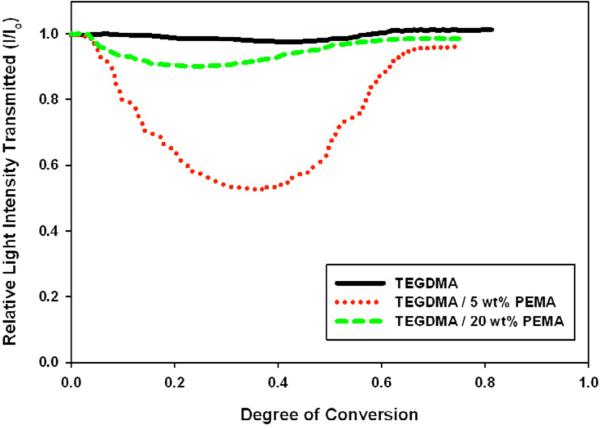
The relative value of the minimum intensity is not dependent on kinetics and is the same for 5 wt% or 20 wt% PBMA. This indicates that the compositions of the phases formed in each sample are similar because they produce the same difference in refractive index. The same behavior was observed for PMMA. Samples containing PEMA, however, showed a difference in the value of minimum intensity – indicating that different phases are formed at 5 wt% versus 20 wt% loading (Figure 7). This is validated by DMA data (discussed below). PEMA has the highest molecular weight of all prepolymers tested (Table 1). This may limit its diffusional mobility during early-stage polymer matrix formation, which likely results in different phase compositions based on prepolymer loading.
Figure 7.
Light Transmission during Polymerization at Different Prepolymer Loadings (TEGDMA/PEMA), Io=300 μ W/cm2, λ cure=365 nm, λ visible=600 nm
3.2.3 Dynamic Mechanical Analysis
Dynamic mechanical analysis was used to detect single versus multi-phase structure. It was also utilized to estimate the compositions of different phases in the fully polymerized materials. All samples were post-cured thermally after photo-irradiation to ensure that final conversion was greater than 95% before analysis. This post-cure processing is not expected to alter the phase structure set in place during the initial, ambient photopolymerization, which forms a dense network structure with high TEGDMA conversion (>75 %).
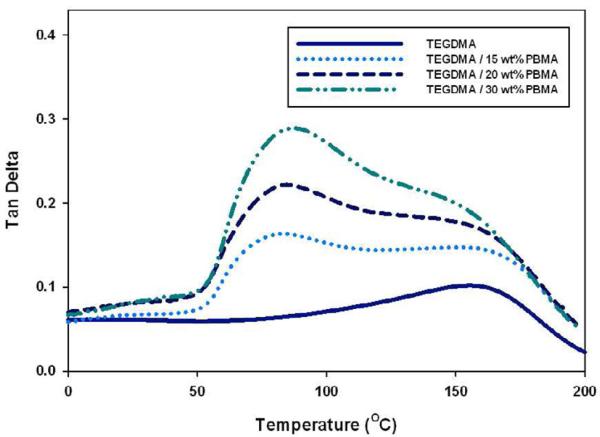
Multi-phase structure was verified in samples that exhibited multiple glass transition temperatures (Tg's) or maximums in tan delta behavior as a function of temperature. For pure TEGDMA homopolymer, one broad, asymmetric tan delta curve is observed (Tg of 161 ± 4 °C), which is characteristic of the significant variation in crosslink density associated with structurally heterogeneous dimethacrylate networks. As shown in Figure 8, with increasing prepolymer content a secondary phase, rich in prepolymer develops. The same behavior is observed in PEMA and PMMA modified materials.
Figure 8.
Tan Delta Behavior Post-polymerization (TEGDMA/PBMA), Temperature Ramp: 3 °C /min
All prepolymers used in this study are non-reactive, and therefore other than any chain transfer to polymer, which does not readily occur in methacrylic systems until very high conversions, they do not change chemical character or Tg during the TEGDMA polymerization. All prepolymers have a Tg that is distinctly different and separate from that of pure fully cured TEGDMA homopolymer (161 °C) by a difference of at least 44 °C (Table 1). Because of this, the shift in Tg's observed in phase-separated samples can be used to calculate composition of the phases in the final material, based on the Fox equation which has been utilized for both sequential and simultaneous IPN's[25]. Our system most closely resembles a sequential IPN with the selective formation of the linear polymer in a first step, followed by TEGDMA homopolymerization. The relationship used to calculate the composition of TEGDMA in each phase based on the Fox equation[26]:
| (4) |
The homopolymer Tg of TEGDMA ambiently cured by photopolymerization (with no post-cure processing) is ~ 80 °C [27]. Therefore in TEGDMA/PBMA materials, the local Tg is reduced by PBMA in prepolymer rich regions (Table 1). However in TEGDMA/PMMA materials the local Tg of prepolymer rich regions is actually raised and in TEGDMA/PEMA samples it remains similar to that of the photocured matrix. These differences could impact how the different prepolymers interact with the homopolymer matrix during phase polymerization.
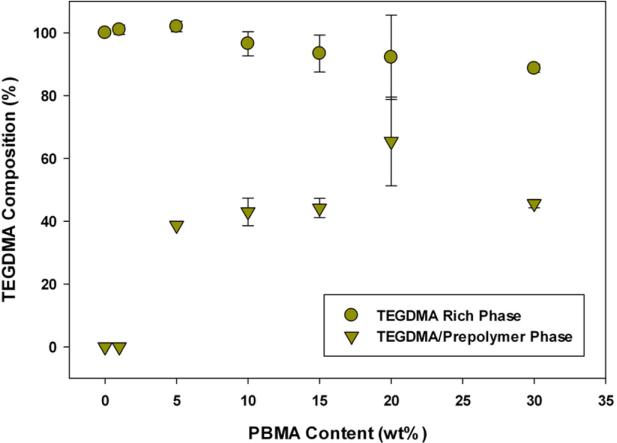
The TEGDMA compositions in both the phases formed for TEGDMA/PBMA and TEGDMA/PEMA samples are shown in Figures 9-10. In PMMA and PBMA containing materials, a relatively pure TEGDMA phase exists whether the sample is single or multi-phase. The prepolymer-rich phase has a TEGDMA composition of ~40-50 % for PMMA and PBMA. This TEGDMA composition is consistent at all prepolymer loadings where PIPS is observed, indicating that once a thermodynamic instability is encountered similar incompatible phase compositions are formed in varying volume fractions related to the initial prepolymer content. At 1 wt% PBMA no optical evidence of PIPS was observed and this coincides with no secondary phase structure apparent in the DMA tan delta plot.
Figure 9.
Post-polymerization Phase Compositions (TEGDMA/PBMA, n=3), measured by shift in Tg.
Figure 10.
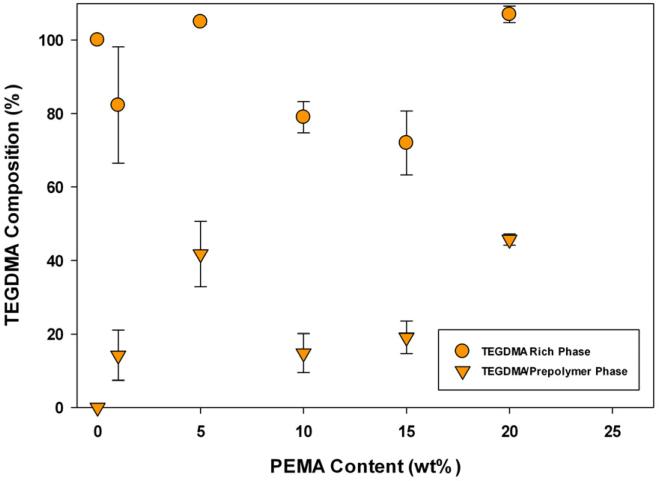
Post-polymerization Phase Compositions (TEGDMA/PEMA, n=3), measured by shift in Tg.
As indicated by Figure 10, TEGDMA/PEMA samples do not display the same stability in phase composition. In particular, samples containing 5 and 20 wt% PEMA have much different phase compositions than 1, 10 and 15 wt% PEMA materials. In the phase separation characterization, it was noted that the minimum relative intensity achieved during polymerization (corresponding to a maximum difference in refractive indices of polymerizing phases) varied depending on the amount of PEMA introduced into the monomer matrix. Since the difference in refractive index of polymerizing phases varies with PEMA content it is expected that the final phase compositions would vary as well.
3.2.4 Volumetric Shrinkage
Equation 3 is used to calculate the ambient cure volumetric shrinkage in all materials. However, this measurement alone does not provide sufficient information as to whether there is an actual reduction in volumetric shrinkage due to the phase separation process. For that reason, a theoretical volumetric shrinkage was calculated using Equation 5:
| (5) |
Where χ = experimentally observed final conversion
[C=C] = initial methacrylate concentration (mol/ml)
Δ VSC=C = molar coefficient of shrinkage for methacrylate group (22.5 cm3/mol)[3, 4]
This equation accounts for decreases in shrinkage due to changes in the initial methacrylate concentration, which is a significant factor in high prepolymer content samples. Since phase separation impacts the overall conversion in these materials (Tables 3-5), both the experimental and theoretical shrinkage were normalized by conversion.
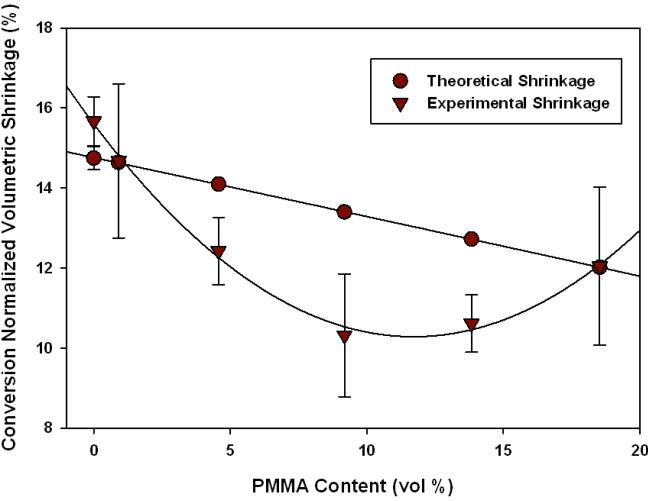
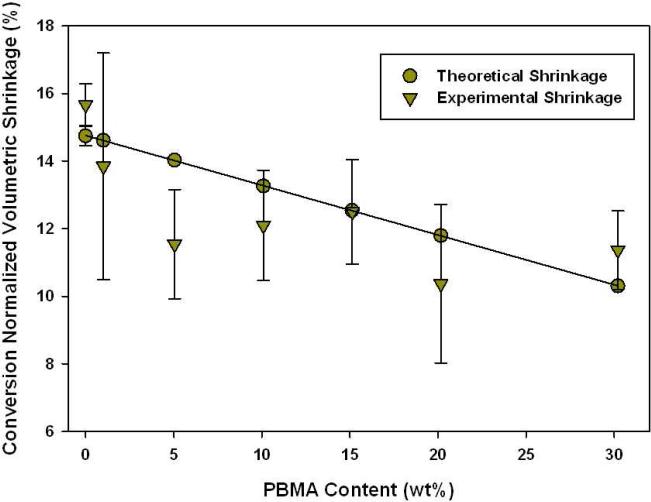
The normalized experimental and theoretical volumetric shrinkage for TEGDMA/Prepolymer samples are displayed in Figures 11-12. Here, the results are presented as a function of volume fraction (as opposed to mass). In previous results, mass fraction was used for simplicity; however, when measuring volumetric shrinkage the volume fraction of prepolymer added to the bulk matrix is more critical than the mass added.
Figure 11.
Volumetric Polymerization Shrinkage (TEGDMA/PMMA, n=3), calculated by change in density post-polymerization.
Figure 12.
Polymerization Volumetric Shrinkage (TEGDMA/PBMA, n=3) calculated by change in density post-polymerization.
It is noted that the control, pure TEGDMA, has an experimental shrinkage that falls within error to the theoretical calculation. However, in some cases the experimental shrinkage falls significantly below the theoretically predicted value based on initial reactive group concentration and the degree of conversion achieved. This demonstrates an additional physical bulk volume recovery effect associated with the internal heterogeneous structure.
In both TEGDMA/PMMA and TEGDMA/PEMA samples there is an enhanced reduction in volumetric shrinkage that occurs at 5 wt% prepolymer loading level. The maximum reduction is observed at 10 wt% prepolymer in both cases. However for the TEGDMA/PBMA samples, considering the experimental error of the density-based measurements, there is essentially no significant shrinkage reduction regardless of the prepolymer loading level. As indicated in Table 1, the three prepolymers have Tg's at 117(±6.0), 72.5(±1.1), and 22.4(±2.5) °C for PMMA, PEMA, and PBMA, respectively. PBMA is the only prepolymer in use that has a Tg below room temperature. Therefore TEGDMA/PBMA samples were the only materials in which the additive was in the rubbery state throughout the polymerization. PMMA and PEMA contribute Tg's that are significantly or modestly higher than that of the ambient-photocured TEGDMA matrix that evolves during photopolymerization.[28]
The shrinkage control mechanism proposed for thermoplastic modifiers, which are also known as low profile additives, relies on chemical or physical connectivity between two phases that develop at different rates. The later development of the secondary phase can lead to nano/micro-scale cavitation at the interface or within the primary phase. This can compensate for some of the initial volumetric shrinkage occurring in the primary phase, resulting in an overall shrinkage reduction due to phase separation[1, 7, 9]. In the TEGDMA/prepolymer model used here, the linkage between the primary and secondary phases is due to the presence of TEGDMA in both phases as well as physical entanglements involving the prepolymer chains integrated into the bulk homopolymer matrix. Since PBMA has a rubbery character throughout the polymerization (and consequently, a lower modulus), it has lower efficacy at distorting the adjacent phase structure.
4. Conclusions
Here, we have presented a simplified approach to achieve and study polymerization-induced phase separation. Pre-gel phase separation was demonstrated with these initial experiments indicating that under certain conditions, PIPS leads to a significant physical reduction in volumetric shrinkage compared to that expected based on solely chemical considerations of double bond concentration and final conversion. These PIPS-based reductions in polymerization shrinkage are also expected to convey a practically important internal stress relaxation mechanism in photopolymers as well.
Table 4.
TEGDMA/PBMA Kinetics
| Prepolymer Content (wt %) | Rpmax (mol/L/min) | Conversion @ Rpmax | Final Conversion |
|---|---|---|---|
| 0 | 13.1 (±1.2) | 0.30 (±0.04) | 0.76 (±0.03) |
| 1 | 18.7 (±1.4) | 0.38 (±0.02) | 0.81 (±0.01) |
| 5 | 31.0 (±2.6) | 0.47 (±0.04) | 0.90 (±0.04) |
| 10 | 12.8 (±2.6) | 0.31 (±0.05) | 0.85 (±0.02) |
| 15 | 5.25 (±0.3) | 0.18 (±0.03) | 0.82 (±0.01) |
| 20 | 7.74 (±1.2) | 0.22 (±0.05) | 0.83 (±0.01) |
| 30 | 5.20 (±0.7) | 0.19 (±0.03) | 0.83 (±0.01) |
Acknowledgements
The donation of the monomer used in this study by Esstech and funding support from NIH/NIDCR 5R01DE014227 are greatly appreciated.
Footnotes
Publisher's Disclaimer: This is a PDF file of an unedited manuscript that has been accepted for publication. As a service to our customers we are providing this early version of the manuscript. The manuscript will undergo copyediting, typesetting, and review of the resulting proof before it is published in its final citable form. Please note that during the production process errors may be discovered which could affect the content, and all legal disclaimers that apply to the journal pertain.
References
- 1.Cao X, Lee LJ. Journal of Applied Polymer Science. 2003;90(6):1486–1496. [Google Scholar]
- 2.Stansbury JW, Ge JH. Radtech Report. 2003:56–61. [Google Scholar]
- 3.Dewaele M, Truffier-Boutry D, Devaux J, Leloup G. Dental Materials. 2006;22(4):359–365. doi: 10.1016/j.dental.2005.03.014. [DOI] [PubMed] [Google Scholar]
- 4.Patel MP, Braden M, Davy KWM. Biomaterials. 1987;8(1):53–56. doi: 10.1016/0142-9612(87)90030-5. [DOI] [PubMed] [Google Scholar]
- 5.Goncalves F, Pfeifer CCS, Stansbury JW, Newman SM, Braga RR. Dental Materials. 2010;26(7):697–703. doi: 10.1016/j.dental.2010.03.014. [DOI] [PubMed] [Google Scholar]
- 6.Li W, Lee LJ. Polymer. 2000;41(2):697–710. [Google Scholar]
- 7.Velazquez R, Ceja I, Guzman J, Castano VM. Journal of Applied Polymer Science. 2004;91(2):1254–1260. [Google Scholar]
- 8.Velazquez R, Reyes J, Castano VM. E-Polymers. 2003 [Google Scholar]
- 9.Velazquez R, Sanchez F, Yanez R, Castano VM. Journal of Applied Polymer Science. 2000;78(3):586–591. [Google Scholar]
- 10.Dean K, Cook WD. Macromolecules. 2002;35(21):7942–7954. [Google Scholar]
- 11.Chen F, Cook WD. European Polymer Journal. 2008;44(6):1796–1813. [Google Scholar]
- 12.Molau GE. Journal of Polymer Science Part B-Polymer Letters. 1965;3(12PB):1007–&. [Google Scholar]
- 13.Flory PJ. Journal of Chemical Physics. 1941;9(8):660–661. [Google Scholar]
- 14.Odian G. Principles of Polymerization. Fourth Edition John Wiley & Sons; Hoboken: 2004. [Google Scholar]
- 15.Braun D, Meyer MI. Macromolecular Chemistry and Physics. 1998;199(5):735–744. [Google Scholar]
- 16.Nishi T, Wang TT, Kwei TK. Macromolecules. 1975;8(2):227–234. [Google Scholar]
- 17.Chou YC, Lee LJ. Polymer Engineering and Science. 1994;34(16):1239–1249. [Google Scholar]
- 18.Cook WD, Chen F, Ooi SK, Moorhoff C, Knott R. Polymer International. 2006;55(9):1027–1039. [Google Scholar]
- 19.Cowie J, Arrighi V. Third ed. Taylor & Francis Group; Boca Raton: 2008. Polymers: Chemistry and Physics of Modern Materials. [Google Scholar]
- 20.Fried J. Polymer Science and Technology. Second Edition Pearson Education; Upper Saddle River: 2003. [Google Scholar]
- 21.Spevacek J, Hanykova L, Labuta J. Macromolecules. 2011;44(7):2149–2153. [Google Scholar]
- 22.Pomposo JA, de Luzuriaga AR, Garcia I, Etxeberria A, Colmenero J. Macromolecular Rapid Communications. 2011;32(7):573–578. doi: 10.1002/marc.201000720. [DOI] [PubMed] [Google Scholar]
- 23.Dickens SH, Stansbury JW, Choi KM, Floyd CJE. Macromolecules. 2003;36(16):6043–6053. [Google Scholar]
- 24.Howard B, Wilson ND, Newman SM, Pfeifer CS, Stansbury JW. Acta Biomaterialia. 2010;6(6):2053–2059. doi: 10.1016/j.actbio.2009.11.006. [DOI] [PMC free article] [PubMed] [Google Scholar]
- 25.Yang J, Winnik MA, Ylitalo D, DeVoe RJ. Macromolecules. 1996;29(22):7047–7054. [Google Scholar]
- 26.Fox TG, Loshaek S. Journal of Polymer Science. 1955;15(80):371–390. [Google Scholar]
- 27.Lu H, Lovell LG, Bowman CN. Macromolecules. 2001;34(23):8021–8025. [Google Scholar]
- 28.Emami N, Soderholm KJM. Dental Materials. 2005;21(10):977–983. doi: 10.1016/j.dental.2005.02.016. [DOI] [PubMed] [Google Scholar]


