Abstract
Capacitance has been used as a non-destructive measure of root system size for 30 years. The equipment required is cheap and simple to apply in both field and laboratory. Good linear correlations have been reported between capacitance and root mass. A model by F. N. Dalton, predicting a linear relationship between these two variables, has become accepted widely. This model was tested for barley (Hordeum vulgare) grown hydroponically using treatments that included: raising roots out of solution, cutting roots at positions below the solution surface, and varying the distance between plant electrode and the solution surface. Although good linear correlations were found between capacitance and mass for whole root systems, when roots were raised out of solution capacitances were not linearly related to submerged root mass. Excision of roots in the solution had negligible effect on the measured capacitance. These latter observations conflict with Dalton’s model. Capacitance correlated linearly with the sum of root cross-sectional areas at the solution surface and inversely with distance between plant electrode and solution surface. A new model for capacitance is proposed that is consistent with these observations.
Key words: Arabidopsis, capacitance, cereal, electrical circuit, Hordeum vulgare L, hydroponics, impedance, root architecture, root growth, soil
Introduction
Measurement of root capacitance has been proposed as a non-destructive screening method to estimate the size of plant root systems (e.g. Chloupek, 1977; Kendall et al., 1982; Dalton, 1995; van Beem et al., 1998; Rajkai et al., 2002; Bengough et al., 2009). Good correlations between capacitance (C) and root mass, length, or surface area have been reported (Table 1). As a consequence, the measurement of root C has been used to inform plant breeding (e.g. van Beem et al., 1998; Chloupek et al., 1999; McBride et al., 2008), to study root growth (Dalton, 1995; Preston et al., 2004), and to estimate root mass of trees (Tsukahara et al., 2009; Pitre et al., 2010). The simplicity of the measurement and its ease of application in field and laboratory have led to increasingly wide use of the technique, although many questions remain concerning the interpretation and general validity of such capacitance measurements (Chloupek, 1977; Dalton, 1995; Ozier-Lafontaine and Bajazet, 2005; Rajkai et al., 2005; Chloupek et al., 2010). There has also been renewed interest in measurement of root system properties using electrical impedance methods which are related to capacitance methods: some of these methods have been reappraised recently in papers by Urban et al. (2011) and Cao et al. (2010, 2011). The present paper explores the mechanistic basis of capacitance measurement for estimating root system size.
Table 1.
Details of studies (plant species, growth medium, and electrical frequency at which capacitance was determined) and parameters obtained for linear relationships between capacitance and root system size
| Publication | Plant species | Growth medium | Frequency | R2 values | n | |||
|---|---|---|---|---|---|---|---|---|
| (kHz) | FM | DM | RL | SA | ||||
| Chloupek (1972) | Zea mays | Sand (container) | 0.8 | 0.736 | 0.728 | 0.731 | 0.663 | 24 |
| Allium cepa | Sand (container) | 1 | 0.566 | 0.545 | nd | 0.529 | 14 | |
| Helianthus annuus | Sand (container) | 5 | 0.916 | 0.897 | 0.92 | nd | 15 | |
| Avena sativa | Clay soil (container) | 5 | 0.566 | 0.464 | nd | nd | 15 | |
| Helianthus annuus | Clay soil (container) | 5 | 0.692 | 0.432 | nd | nd | 10 | |
| Brassica napus | Not specified | 0.081 | nd | nd | nd | 18 | ||
| Chloupek (1977) | Daucus carota | Loam soil (field)* | 1 | 0.514 | 113 | |||
| Helianthus annuus ** | Sand | 1 | 0.549, 0.554 | 15 | ||||
| Helianthus annuus *** | Sand | 1 | 0.523, 0.543, 0.566 | 15 | ||||
| Kendall et al. (1982) | Trifolium pratense | Solution | 1 | 0.672 | 21 | |||
| Medicago sativa | Silt loam soil (field*) | 1 | 0.436 | 20 | ||||
| Dalton (1995) | Solanum lycopersicum | Solution | 1 | 0.877 | 12 | |||
| van Beem et al. (1998) | Zea mays 35 d **** | Vermiculite | 1 | 0.85 | 32 | |||
| Zea mays 70 d **** | Vermiculite | 1 | 0.27 | 32 | ||||
| Zea mays 56 d **** | Loam soil (field) | 1 | 0.41, 0.53 | 36 | ||||
| Ozier-Lafontaine and Bajazet (2005) | Amaranthus tricolor | Solution | 1 | 0.937 | 5 | |||
| Solanum lycopersicum | Solution | 1 | 0.987 | 11 | ||||
| Solanum lycopersicum | Clay loam soil (container) | 1 | 0.829 | 15 | ||||
| Preston et al. (2004) | Populus deltoides × Populus nigra | Potting compost (container) | 1 | 0.866 | 0.895 | 33 | ||
| Rajkai et al. (2005) | Helianthus annuus | Sandy soil (container) | 1 | 0.832 (needle), 0.921 (clamp) | 12 | |||
| McBride et al. (2008) | Zea mays (exp. 1, 4 genotypes) | Turface, porous granular medium (container) | 1 | 0.779, 0.647 | 30, 30 | |||
| 0.823, 0.364 | 30, 30 | |||||||
| Zea mays (exp. 2, 4 genotypes) | Turface | 1 | 0.761, 0.846, | 30, 30 | ||||
| 0.646, 0.726 | 30, 30 | |||||||
| Bengough et al. (2009) | Triticum aestivum (35 genotypes) | Gravel-sand mix (containers) | 1 | 0.753 | 67 | |||
| Tsukahara et al. (2009) | Prunus persica | Soil (field) | 1 | 0.897 | 0.896 | 27 | ||
| Pyrus pyrifolia (on Pyrus betulaefolia rootstock) | Soil (container) | 1 | 0.806 | 18 | ||||
| Pitre et al. (2010) | Salix viminalis × Salix schwerinii | Soil (pots), sandy soil (field) | 1 | 0.81, 0.49 | 16, 8 | |||
| Chloupek et al. (2010) | Daucus carota | Soil (field) | 1 | 0.525 | 92 | |||
*Final harvest date only (several previous harvest dates gave poorer correlations, possibly a result of dry soil.
**Capacitance was measured first with several, and then with only one, electrode in soil.
***Capacitance was measured with one electrode in soil at 5, 10, and 15cm from the plant.
****Combined data from eight genotypes in vermiculite, six in field.
FM, fresh mass; DM, dry mass; RL, root length; SA, surface area; n, number of replicates.
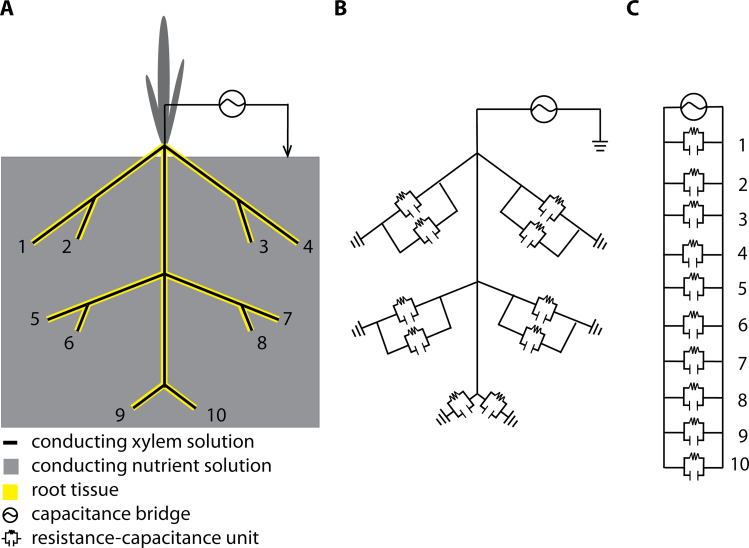
The most widely accepted model to explain the capacitance of plant root systems was put forward by Dalton (1995). He proposed a simple resistance-capacitance model (Fig. 1) to describe the underlying electrical pathways between an electrode in the root substrate and an electrode inserted into the base of the shoot. The model considers roots to be equivalent to cylindrical capacitors. It suggests that the plasma membranes of root cells serve as dielectrics (Dvořák et al., 1981) separating the soil solution from the inner solution and generating capacitance. Accordingly, the boundary layers between the plasma membranes of root cells and these solutions are seen as equivalent to capacitor plates. Thus, the capacitance of a root system would be linearly related to its size, analogous to the addition of capacitors when they are connected in parallel (equation 1)
Fig. 1.
Resistance-capacitance (RC) circuits according to the Dalton (1995) model. (Panel A) Diagram of a plant root system with 10 root tips showing the tissue separating the xylem solution from the nutrient solution. (Panel B) Electrical equivalent network of the root system showing the location of the RC components. (Panel C) Equivalent circuit for the root system. Note that the individual RC components can have different values.
 |
(1) |
where C total represents the overall capacitance and C 1 to C i represent the capacitance components arising from root components 1 to i.
Dalton’s model (1995) has gained wide acceptance, because the linear relationship between the capacitance and the size of a plant root system it predicts has been found for many different plant species in many different substrates (Table 1). Dalton surmised that the suberized plant tissue of fully developed endodermis would act as an insulator. Hence, according to Dalton, the root capacitance would be provided predominantly by ‘active’ apical parts of the root. The model equates xylem and phloem vessels with wires that conduct the current to the plant electrode aboveground. Thus, Dalton concluded that root C would provide information about both the mass and the physiological ‘activity’ of roots. Dalton observed what he called a ‘hyperbolic decrease of capacitance’ with increasing distance between the shoot electrode and the soil surface and explained this by a network of resistance-capacitance elements in the shoot connected in series. When capacitors are connected in series, the effective plate separation increases and the total capacitance (C total) is then less than that of the smallest capacitor (equation 2)
Table 2.
Composition of the nutrient solution (conductivity 39.1 mS at 19.3 °C)
| Nutrients | g l–1 | Micronutrients | mg l–1 |
|---|---|---|---|
| NH4Cl | 0.16 | MnCl2.4H2O | 1.19 |
| Ca(NO3)2.4H2O | 0.94 | H3BO3 | 1.42 |
| KNO3 | 0.40 | ZnCl2 | 0.10 |
| MgSO4 | 0.36 | CuSO4.5H2O | 0.40 |
| FeEDTA | 0.04 | Na2MoO4.2H2O | 2.24 |
| KH2PO4 | 0.68 | CoCl2.6H2O | 0.24 |
 |
(2) |
The substrate (soil, sand, water, etc.) around the roots also provides capacitance, and the root system and substrate can be considered as two capacitors connected in series (Rajkai et al., 2005). Hence, an accurate estimation of the capacitance of a root system requires either that the capacitance of the substrate is substantially higher than that of the root system or that it is known: This criterion is met, at least in fine sandy subsoil at 1kHz for sunflower root, according to Rajkai et al. (2005).
Although Dalton’s key prediction of a linear relationship between C and root mass is supported by a number of studies (Table 1), there are several examples of apparent failures of the model. For example, the best-fitting regressions are not always linear functions, but can be quadratic (Preston et al., 2004) and, even when a linear regression fits, the intercept often deviates from zero (e.g. van Beem et al., 1998; McBride et al., 2008). To evaluate Dalton’s model more fully, a series of tests were devised using a hydroponic system to minimize complications resulting from the soil component of the electrical pathway. These tests included: (1) using roots and root systems of different sizes and ages; (2) comparisons of nodal and seminal roots; (3) removal of parts of submerged roots and root systems; (4) changing the depth of submergence of roots and root systems; (5) varying the location of the plant electrode; and (6) measuring roots and root systems in air.
Materials and methods
Plant material
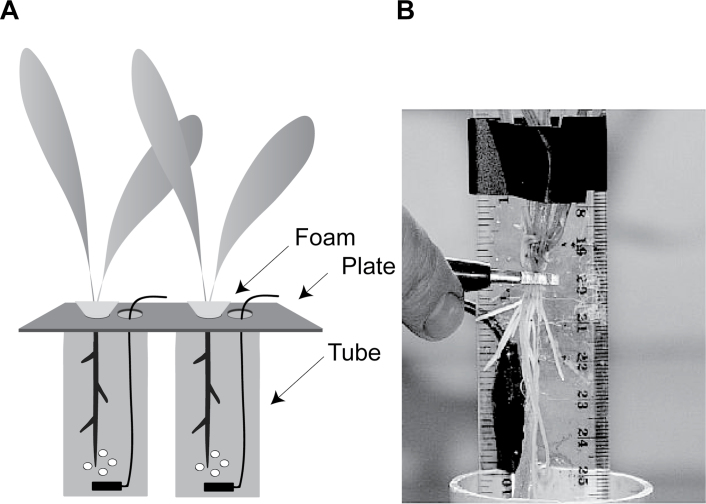
Barley caryopses were surface sterilized by soaking in a saturated 2% calcium hypochlorite solution for 15 minutes, then rinsed three times in distilled water. The seeds were germinated on paper towel moistened with sterile distilled water in a sterile Petri dish in the dark at 16 °C for four days. Five days after sowing (DAS) 20 seedlings at similar stages of development were transferred to a 10 l basin in a controlled environment room. Plants were illuminated for 18 hours daily with a photon irradiance (PAR; 400–700nm) of 320 µmol m–2 s–1 at plant height. The day/night temperature regime was 18/12 °C. The basin was filled with nutrient solution (Table 2) and aerated through eight porous stones (Hagen, Toronto, Canada). Air pressure was provided by an air pump (Motore Asincrono, no. G0225; Lafert Electric Motors, Cheshire, UK). Ten DAS, seedlings were transferred to plastic tubes of 50mm diameter, 1 m length and 2 l volume (Fig. 2). Each seedling grew in a separate tube containing a gently bubbling, aerated, nutrient solution. Losses of water by evaporation and transpiration were replaced daily. The nutrient solution was replaced weekly and on the day before harvest.
Fig. 2.
Experimental apparatus. (Panel A) Plants supported in foam within plastic tubes (50mm diameter × 1 m length) containing aerated nutrient solution (not to scale). (Panel B) Capacitance measurement with one electrode (a stainless steel rod) submerged in the solution and the other (a strip of aluminium foil) wrapped around either a single root or the whole root system.
Measurement of capacitance
Capacitance measurements were made on plants between 22 and 37 DAS to create root systems of a wide range of sizes. For these measurements, foam, husk, and dead leaves were removed, and plants were placed in tubes filled with fresh nutrient solution. In the case of whole root systems, nodal roots that were too short to enter the solution surface by more than 2–3mm were excised at the plant base. This was necessary, because root tips that just touched the solution surface caused large variations in capacitance. Capacitance was measured at 1kHz and 1V with an LCR meter (Passive Component LCR Meter; Extech Instruments, Massachusetts, USA) connected to a ‘solution’ electrode and a ‘plant’ electrode via alligator clips. The solution electrode was a stainless steel rod (165mm length, 3mm diameter) placed at the edge of the tube, of which 12cm was submerged. The capacitance readings were insensitive to electrode depth or position. The plant electrode was a strip of aluminium foil (breadth 4±0.5mm; 8-fold thickness) wrapped around the plant tissue and clamped with the alligator clip. In a preliminary experiment, the foil strip was found to be the gentlest and most flexible way of attaching the electrode to a plant when compared with subcutaneous needles (Chloupek, 1977; Dalton, 1995; Blomme et al., 2004; Ozier-Lafontaine and Bajazet, 2005; Tsukahara et al., 2009), with wires (Preston et al., 2004) or with clamping devices (Kendall et al., 1982; van Beem et al., 1998; Rajkai et al., 2005) which injured the plant. The use of aluminium foil also gave more reproducible C values (data not shown). The capacitance measurements performed are shown in Fig. 3.
Fig. 3.
Capacitance measurements performed on whole root systems and single roots. (Panel A) Plant electrodes were attached to the top of the root system, roots were submerged to 5mm from the plant electrode, and the capacitance measured. Then, similar measurements were made with single excised roots. (Panel B) Plant electrodes were attached to the top of the roots, roots were submerged to 5mm from the plant electrode, and the capacitance measured. Then, roots were raised incrementally and capacitance was measured after each increment. After this, roots were trimmed incrementally from the bottom and, after the removal of each increment, the remaining root was resubmerged to 5mm from the plant electrode and capacitance measured. (Panel C) Roots were removed from the solution and plant electrodes were attached to the top of the roots. Roots were partially submerged and capacitance measured. Roots were then trimmed 1–2mm below the solution surface and the capacitance remeasured. This procedure was repeated incrementally by further submergence and trimming until no root remained. (Panel D) Roots were removed from the solution and partially resubmerged. Then the plant electrodes were attached to roots 5mm above the solution and capacitance measured. Roots were trimmed 1–2mm below the solution surface and the capacitance remeasured. This procedure was repeated incrementally by further submergence and trimming until no root remained. (Panel E) Plant electrodes were attached to the top of the roots, roots were submerged to 5mm from the plant electrode, and the capacitance measured. Roots were then raised incrementally and capacitance was measured after each increment until the entire root was removed from the solution. The root was then blotted with a damp paper towel and the alligator clip formerly attached to the solution electrode was clamped directly onto the root at different positions and the capacitance measured at each position.
Root mass and diameter
After capacitance measurement, roots were stored for up to 20 d in damp paper towel sealed within Petri dishes placed in a fridge at 6 °C. Root fresh mass (FM) was measured and root diameters determined using a microscope with eyepiece graticule (MZ75, MZFIII; Leica, Solms, Germany). Root cross-sectional areas (A) and circumferences were calculated assuming a circular geometry.
Statistics
Capacitance data are expressed as mean ± standard deviation (SD) from three repeated measurements (technical replicates). Regression analyses and t-tests were performed using Sigmaplot 11 or Sigmaplot 12 (Systat Software, Chicago, IL, USA). Regression coefficients are expressed as mean ± standard error (SE) from n determinations.
Results and discussion
The relationships between capacitance and mass for submerged roots
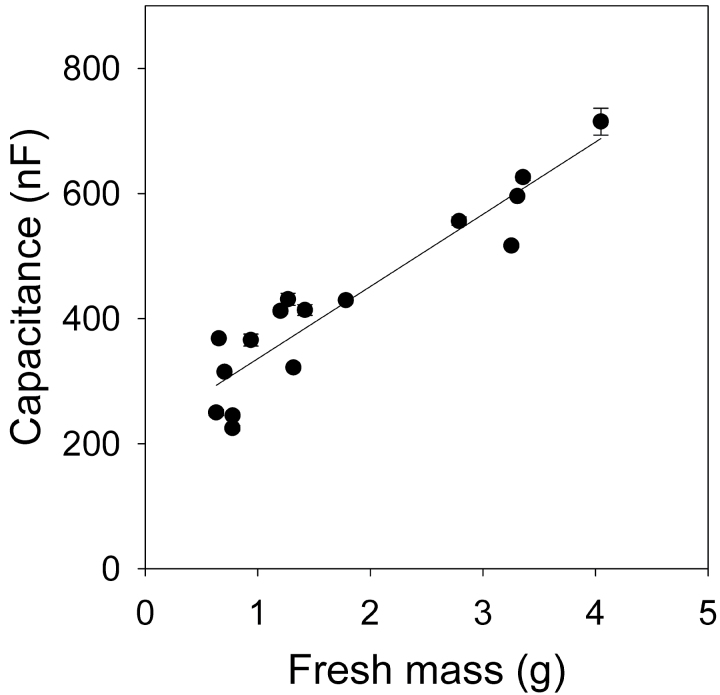
The first experiments (Fig. 3A left) found that there was a significant correlation between capacitance and mass across 16 completely submerged whole root systems of different ages and thus sizes (Fig. 4). Dalton’s model predicts a linear relationship between capacitance and mass of roots submerged. The linear regression line intercepts the y-axis at 221±0.024 nF (mean ± SE, n = 16).
Fig. 4.
Relationship between capacitance (C, nF) and fresh mass (M, g) of 16 whole root systems of different ages submerged with 5mm distance remaining between solution surface and plant electrode. Linear regression: C = (115±12) × M + (221±24) (mean ± SE, R 2 = 0.869, P < 0.0001). Data represent the mean ± SD of three repeated measurements.
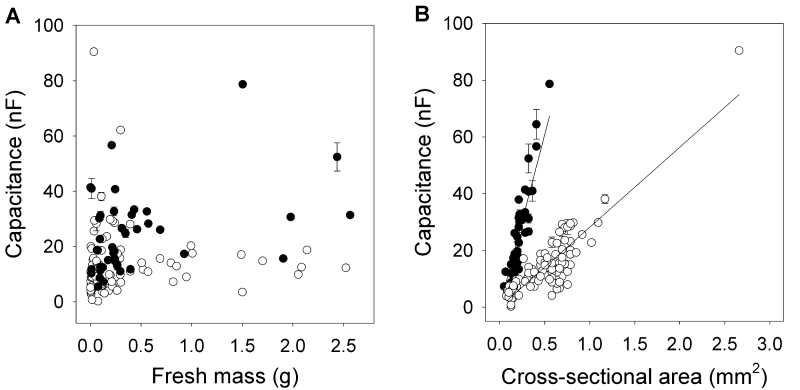
In contrast to the results obtained for entire root systems (Fig. 4), when individual excised seminal and nodal roots were examined (Fig. 3A right), there was little relationship between capacitance and root mass (Fig. 5A). This does not concur with Dalton’s model. Significant linear relationships were obtained between capacitance and root cross-sectional area at the solution surface for both seminal and nodal roots (Fig. 5B). The gradient of this relationship was 4.3-times steeper for seminal than for nodal roots. Thus, seminal roots provided more capacitance per unit area than nodal roots. This might be due to differences in the anatomy or morphology of seminal and nodal roots (Esau, 1977). As is apparent in Fig. 5B, the cross-sectional area at the solution surface of seminal roots was generally less than that of nodal roots.
Fig. 5.
Relationships between capacitance (C, nF) and fresh mass (g) (panel A) and the sum of cross-sectional areas at the solution surface (A, mm2) (panel B) for 48 seminal roots (● ) and 103 nodal roots (◯) after excision from eight plants. The roots were submerged with 5mm between solution surface and plant electrode (see Fig. 3A). There was no significant correlation between C and fresh mass for seminal roots or nodal roots. Linear regressions for the relationships between C and A were C = (121±4.4) × A (R 2 = 0.806, P < 0.001) for seminal roots and C = (28.2±0.88) × A (R 2 = 0.771, P < 0.001) for nodal roots (mean ± SE). Data represent the mean ± SD of three repeated measurements.
Further evidence that capacitance is not linearly related to the mass of root submerged
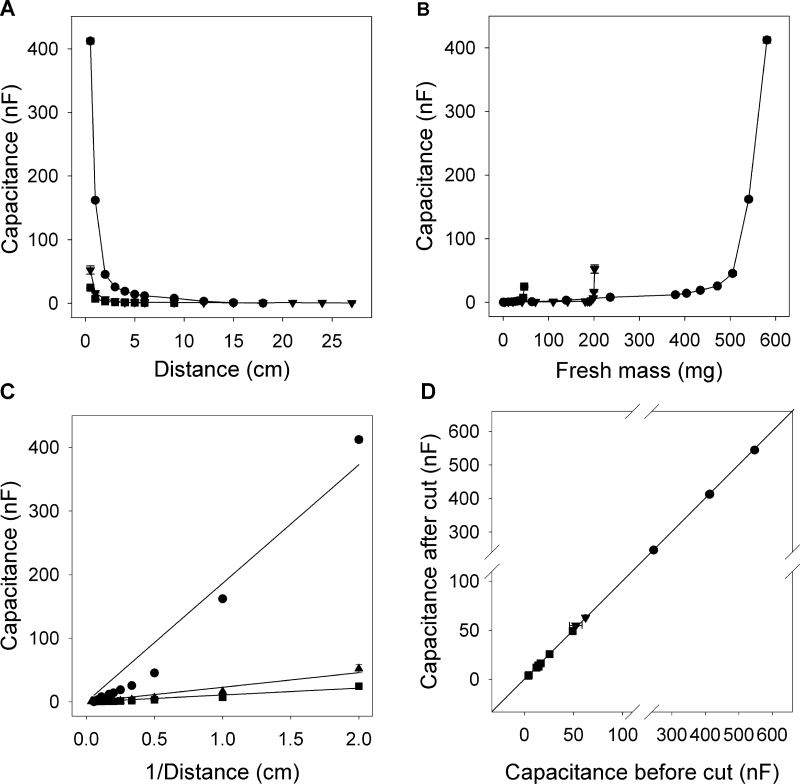
When roots were raised incrementally out of solution (Fig. 3B left), capacitance decreased nonlinearly with each increment (Fig. 6A). In the same experiment, capacitance increased nonlinearly with increasing root mass submerged (Fig. 6B). These results do not agree with any model predicting a simple linear relationship between capacitance and mass of roots submerged. It suggests that root tissues close to the plant electrode contribute disproportionately to the measured capacitance. Equivalent data were obtained when plant electrodes were attached to the top of the roots and roots were lowered incrementally into solution (Figs. 3C and 7A). There was an approximately linear relationship between measured capacitance and the reciprocal of the distance between the plant electrode and the solution surface (Fig. 6C), which is that expected for capacitors connected in series along the root axis (equation 2).
Fig. 6.
(Panels A, B) Examples of relationships between capacitance (nF) and the distance (cm) between the plant electrode and the solution surface (panel A) and the fresh mass (mg) of submerged root tissue when roots were raised incrementally out of solution (panel B) (see Fig. 3B left). Data are shown for a whole root system (● ), an excised seminal root (▲), and an excised nodal root (■) from a survey of four whole root systems and 10 individual roots. (Panel C) The relationship between capacitance (C) and the reciprocal of the distance (1/D) between plant electrode and solution surface. The linear regression was forced through the origin and was for the root system C = (186.43±12.02)/D (mean ± SE, n = 11, R 2 = 0.949, P < 0.0001), for the seminal root system C = (22.96±1.48)/D (mean ± SE, n = 14, R 2 = 0.936, P < 0.0001), and for the nodal root C = (10.82±0.96)/D (mean ± SE, n = 8, R 2 = 0.925, P < 0.0001). (Panel D) The relationship between capacitance measured after (C a) and before (C b) complete trimming of the submerged root (see Fig. 3B right). The linear regression was C a = (0.997±0.002) × C b + (0.323±0.364) (mean ± SE, n = 14, R 2 = 1.000). Data are shown for four whole root systems (● ), two excised seminal roots (▲) and eight excised nodal roots (■). Data represent the mean ± SD of three repeated measurements.
Fig. 7.
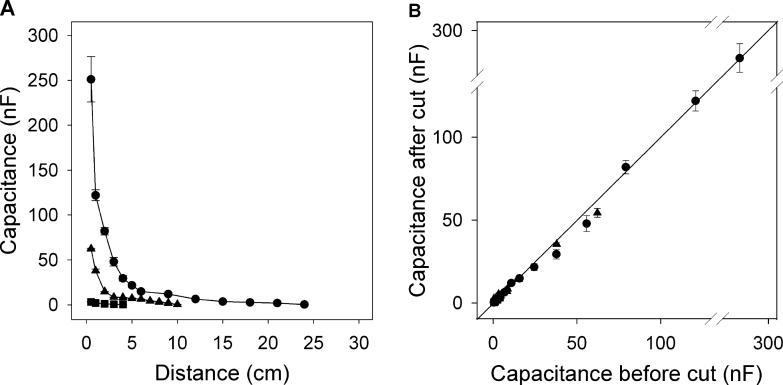
(A) Relationship between capacitance and the distance between the plant electrode and the solution surface, when roots were lowered incrementally into solution (see Fig. 3C). (B) The relationship between capacitance measured after (C a) and before (C b) trimming of the submerged root (see Fig. 3C). The linear regression for the combined data was C a = (1.008±0.01) × C b – (1.47±1.17) (mean ± SE, n = 29, R 2 = 0.998). Points represent the mean ± SD of three repeated measurements. Data are shown for a whole root system (● ), an excised seminal root (▲), and an excised nodal root (■). Capacitance was measured at increments of 1cm for the first 6cm and in increments of 3cm thereafter.
Trimming roots (Fig. 3B right and C) did not affect capacitance (Figs. 6D and 7B): linear regressions between capacitance before and after trimming did not differ significantly from a 1:1 relationship. Again this is inconsistent with the model of Dalton (1995), which suggests that capacitance is determined by submerged root mass or the ‘active’ apical parts of the root. Similar insensitivity to root excision was found for capacitance measurements by Matsumoto et al. (2001) and Kendall et al. (1982) and resistance measurements by Cao et al. (2010).
Capacitance depends strongly on root cross-sectional area at the solution surface
Capacitance was measured at different positions on an individual root or root system, in each case with the electrode 5mm above the solution surface (Fig. 3D). Complex relationships were observed between capacitance and position (Fig. 8A). Maximal capacitance occurred in both whole root systems and seminal roots where the number of secondary roots was greatest. In general, young whole root systems had greater capacitance than young seminal roots which in turn had greater capacitance than nodal roots. Trimming roots (Fig. 3D) did not affect capacitance (P > 0.1; data not shown). Total root cross-sectional area at the solution surface varied in the same way as capacitance with position (Fig. 8B). The relationship between capacitance and cross-sectional area at the solution surface was linear for any individual root or root system (Fig. 8C and Table 3). This confirms this study’s previous observation that capacitance was linearly related to cross-sectional area at the top of the root when fully submerged (Fig. 5B). The slopes of these relationships were greater for whole root systems and branched seminal roots than for unbranched nodal roots (Table 3). There were large differences between slopes for individual seminal roots. The regressions between capacitance and cross-sectional area at the solution surface usually passed through the origin, although intercepts were occasionally found (intercepts not shown; there were very few such cases and no obvious characteristics of roots with intercepts were observed). The R 2 values for regressions of capacitance against sum of circumferences of individual roots at the solution surface and against the total cross-sectional area at the solution surface were not consistently different (Table 3). Therefore it is unclear as to which relationship is stronger.
Fig. 8.
The relationships between capacitance and the position of the electrode on the root system, where position refers to distance from the plant base (panel A) (see Fig. 3D), between the sum of root cross-sectional areas (ΣA) at the solution surface and the position of the electrode on the root system (panel B), and between capacitance and ΣA (panel C). Examples are shown for a whole root system (● ), a seminal root (▲), and a nodal root (■). Data represent the mean ± SD of three repeated measurements. Linear regressions are provided in Table 3.
Table 3.
Linear regressions forced through the origin for capacitance against the root cross-sectional area and sum of circumferences of individual roots at the solution surface
| Root type | DAS | n | C = b.A | C = b.Σκ | ||||
|---|---|---|---|---|---|---|---|---|
| b | SE(b) | R2 | b | SE(b) | R2 | |||
| Root system | 22 | 11 | 103 | 2.8 | 0.967 | 9.09 | 0.84 | 0.567 |
| Root system | 22 | 13 | 190 | 11.4 | 0.853 | 13.6 | 0.64 | 0.906 |
| Root system | 22 | 12 | 208 | 17.0 | 0.759 | 17.9 | 0.61 | 0.950 |
| Root system* | 24 | 14 | 145 | 5.6 | 0.923 | 14.2 | 0.62 | 0.900 |
| Seminal root | 22 | 12 | 265 | 16.5 | 0.929 | 16.6 | 0.60 | 0.977 |
| Seminal root | 27 | 9 | 165 | 10.7 | 0.930 | 10.7 | 0.73 | 0.922 |
| Seminal root | 28 | 9 | 109 | 5.9 | 0.954 | 12.9 | 0.69 | 0.955 |
| Seminal root | 30 | 13 | 146 | 7.1 | 0.940 | 9.46 | 0.64 | 0.887 |
| Seminal root | 32 | 11 | 72 | 3.1 | 0.946 | 4.54 | 0.23 | 0.926 |
| Seminal root | 34 | 7 | 80 | 4.6 | 0.952 | 6.83 | 0.41 | 0.948 |
| Seminal root | 37 | 11 | 92 | 8.2 | 0.837 | 25.5 | 1.95 | 0.879 |
| Seminal root | 37 | 9 | 144 | 4.2 | 0.989 | 11.1 | 0.32 | 0.989 |
| Seminal root* | 37 | 10 | 125 | 4.2 | 0.980 | 12.0 | 1.04 | 0.876 |
| Seminal root | 37 | 9 | 82 | 4.3 | 0.965 | 9.13 | 0.44 | 0.971 |
| Nodal root | 28 | 6 | 27 | 0.9 | 0.941 | 6.76 | 0.56 | 0.632 |
| Nodal root | 29 | 13 | 55 | 4.7 | 0.341 | 12.5 | 0.41 | 0.895 |
| Nodal root* | 29 | 13 | 36 | 1.1 | 0.780 | 9.06 | 0.28 | 0.780 |
| Nodal root | 37 | 9 | 53 | 2.0 | 0.857 | 12.9 | 0.63 | 0.757 |
| Nodal root | 37 | 9 | 43 | 0.8 | 0.953 | 11.6 | 0.55 | 0.673 |
R 2 values and gradient terms are for regressions forced through the origin, except in three cases where an intercept was present (shown in italics). Asterisks indicate that the data for correlation between capacitance and root cross-sectional area are given in Fig. 8C. DAS, days after sowing; C, Capacitance (nF); A, cross-sectional area (mm2); Σκ, sum of circumferences of individual roots (mm); SE(b), standard error of coefficient.
Capacitance of roots out of solution
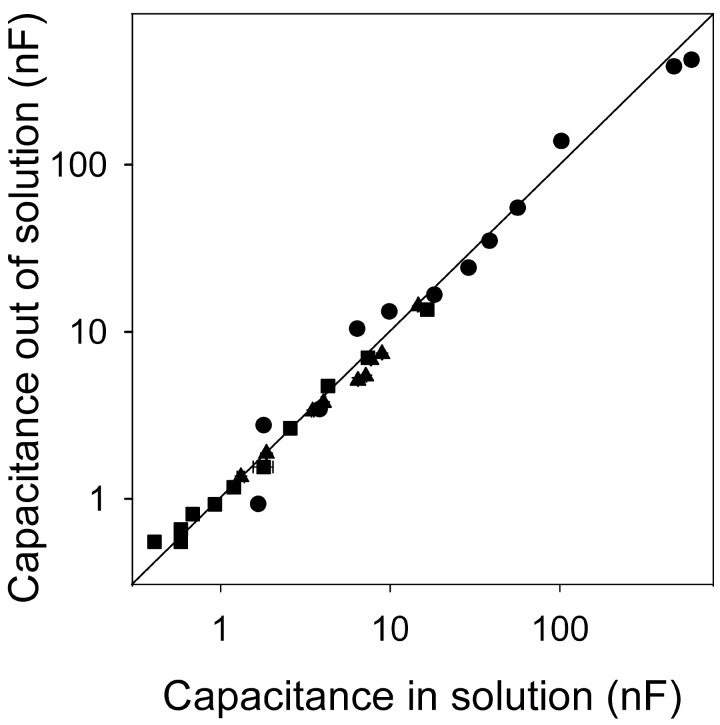
The capacitance measured in plants in air, when electrodes were placed at base of the shoot and at any point on the root system (Fig. 3E right), equalled the capacitance measured in the hydroponic system when the root system was raised out of solution to the same point (Fig. 9). These values followed a 1:1 line. This confirms that the root below the solution surface has negligible effect on the measured capacitance, which depends only on the material between the plant electrode and the solution surface.
Fig. 9.
Relationship between the capacitances of roots measured in solution against capacitance measured at an equivalent separation of electrodes in roots removed from solution (see Fig. 3E). Examples are shown for a whole root system (● ), a seminal root (▲), and a nodal root (■). Data represent the mean ± SD of three repeated measurements. The line indicates a 1:1 relationship.
Towards a new model for root capacitance
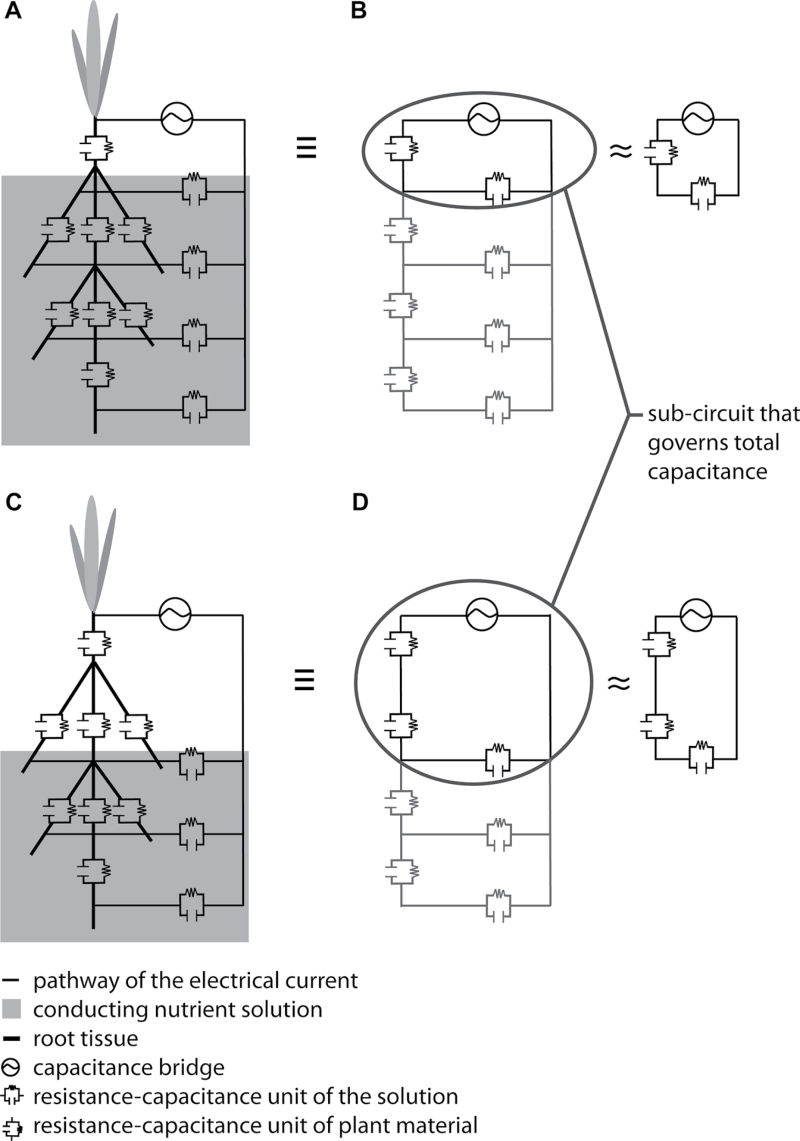
The model of Dalton (Fig. 1) is consistent with the initial observations reported here (i.e. the linear correlation between capacitance and root mass; Fig. 4), but it cannot explain the other observations reported in this paper (Figs. 5–9). The observation that root capacitance is dominated by the capacitance of the tissue between the solution surface and the plant electrode led to the formulation of an alternative model (Fig. 10); this has some similarities to the one proposed by Cao et al. (2011).
Fig. 10.
Resistance-capacitance (RC) circuits according to the revised model. (A, C) Diagrams of barley plants with five root tips; (B, D) Electrical equivalent networks of the root systems showing the location of the RC components. (A, B) RC circuits for a completely submerged root system; (C, D) RC circuits for a partly submerged root system. The subcircuit that largely determines the capacitance is ringed to emphasize its importance. Note that the individual RC components can have different values.
The basics of the revised model are as follows. (1) The capacitance of the solution is much greater than the capacitance of the plant tissue (preliminary experiments suggest that this is also the case in soil at field capacity). (2) The capacitances of tissues along an unbranched root can be considered as connected in series. (3) The capacitances of multiple unbranched roots comprising the whole root system act in parallel, but reduce to the equivalent of a single capacitor. (4) The capacitances of individual roots are directly proportional to their cross-sectional area or circumference (Fig. 5B and Table 3), although different constants of proportionality may apply to different roots.
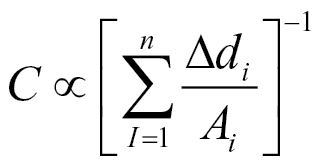
The revised model is consistent with all of the current observations. For example, a linear correlation between capacitance and root mass (Fig. 4) is explained by the capacitance being proportional to root cross-sectional area at the solution surface. The positive intercept for the relationship between capacitance and root mass (Fig. 4) is due to the substantial contribution to the measured capacitance of the plant material between the solution surface and the plant electrode. The lack of correlation between the capacitance of individual roots and their fresh mass shown in these experiments (Fig. 5A) occurs because the root cross-sectional area at the solution surface varies independently of root mass. The non-linear relationship between capacitance and the distance between the plant electrode and solution surface (Figs. 6A and 7A) fits a reciprocal relationship which is that expected of a series of capacitors along the root axis. The lack of effect of trimming roots below the solution surface (Figs. 6D and 7B) is explained by roots below the solution surface having negligible effect on the measured capacitance, which implies that the material between the plant electrode and the solution surface dominates measured capacitance. This is also consistent with the 1:1 relationship between the capacitance measured in plants in air, when electrodes were placed at base of the shoot and at any point on the root system, and the capacitance measured in the hydroponic system when the root system was raised out of solution to the same point (Fig. 9). The complex relationship between capacitance and electrode position on the root (Fig. 8A and 8B) can be explained by the variation in root cross-sectional areas with position. This effect can be incorporated into the revised model by correcting the capacitance estimate through weighting the values according to the variation in cross-sectional area. This can be achieved by calculating capacitance according to the following equation:
 |
(3) |
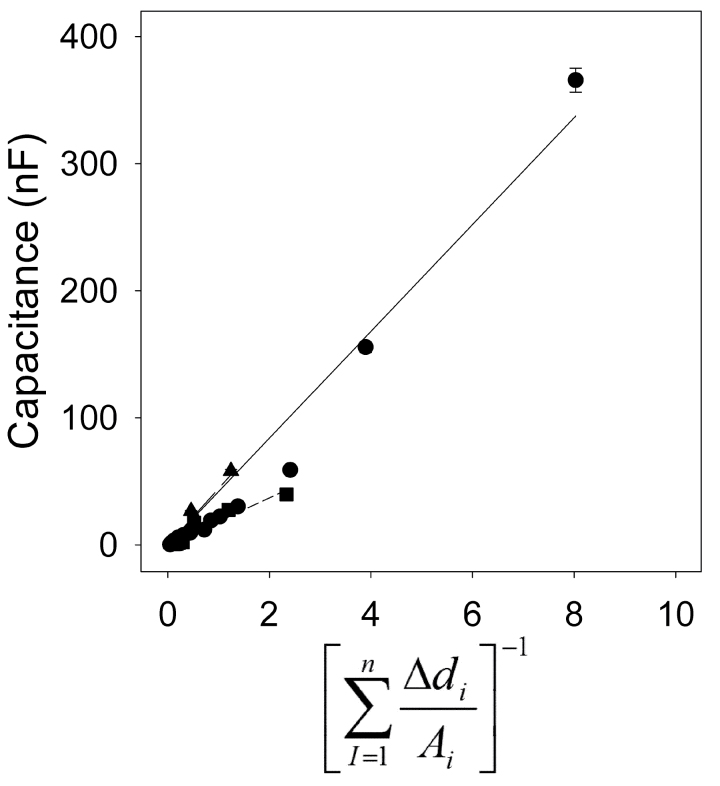
where A i is the cross-sectional area of the i th segment of root of length ∆d, where the summation is along n segments of root. An example of this relation is given in Fig. 11, using data recalculated from Fig. 8, where A is in mm2 and ∆d is in cm.
Fig. 11.
The relationships between capacitance and the reciprocal of cumulative distance/area 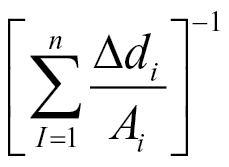 (equation 3) for a whole root system (● ), a seminal root (▲) and an unbranched nodal root (■). The linear regression coefficients for the relationship were C = 42.0
 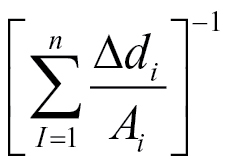 (R
2 = 0.964, n = 14) for the whole root system, C = 44.4
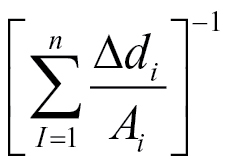 (R
2 = 0.913, n = 10) for the seminal root, and C = 18.5
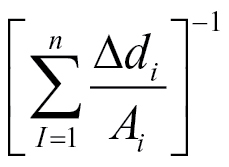 (R
2 = 0.919, n = 8) for the nodal root. Values were calculated from data presented in Fig. 8 (where A is in mm2 and ∆d is in cm) and represent the mean ± SD of three repeated measurements.
Remaining questions include: (1) Why is the linear relationship between capacitances and root cross-sectional area good for individual roots, but differs between roots? This might be related to differences in anatomy, for example, between nodal and seminal roots. (2) What is the underlying physical basis for the good relationship between measured capacitances and root cross-sectional area (or circumference)? One possible analogy is to consider the plant tissue as a homogenous dielectric material of dielectric constant ε, of cross-sectional area A, and thickness d. The capacitance would then be given by
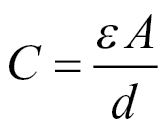 |
(4) |
(3) How do the measurements made in hydroponics relate to measurements made in other growth media? In the revised model, the measured capacitance is dominated by the total cross-sectional area of root near the solution surface and its distance from the plant electrode. Thus, the measured capacitance can provide an estimate of the number of roots at the solution surface and, thereby, the developmental stage, growth rate or size of a plant’s root system. The location of the root interface with the soil solution will have a great influence on the measured capacitance. Indeed, the model explains why the measured capacitance is lower in dry soil than in wet soil (c.f. Kendall et al., 1982; Dalton, 1995). This arises because there is less effective contact between the plant and the root–soil solution menisci distributed along the root surface.
This study performed preliminary experiments in wet potting compost (0.85 v/v peat, 0.10 v/v sand, 0.05 v/v vermiculite, at approximately field capacity) that have shown linear correlation between capacitance measured for barley plants in air and that measured for the plants in potting compost (gradient = 1.03±0.014), R 2 = 0.959, n = 43, P < 0.0001), in the same manner as was shown for hydroponically grown roots (Fig. 9). This suggests that the revised model for plant capacitance in hydroponics is likely to be appropriate for plant capacitance in potting compost at field capacity. This is also consistent with soil capacitance being substantially greater than capacitance of root material at 1kHz (Rajkai et al., 2005).
In conclusion, measurements of electrical capacitance of barley roots were inconsistent with the model of Dalton (1995) in many respects. This necessitated a new model for the underlying electrical pathways (Fig. 10); the revised model was consistent with all observations. It approximates the root tissue as a continuous dielectric and, therefore, root capacitances can be calculated according to established physical principles. Root capacitance is dominated by the tissue between the plant electrode and the solution surface and closely related to the cross-sectional area (or circumference) of the root at the solution surface. Measurements of root capacitance are applicable to studies of root development, although the data obtained should be interpreted in the context of the revised model. This cautions that the results will be dominated by only a small fraction of the total plant root tissue.
Acknowledgements
RCD was funded by a University of Dundee/James Hutton Institute PhD studentship. The authors thank the referees for their constructive comments, and AGB thanks Dr T. Ellis (CSIRO) for originally introducing him to the technique. The James Hutton Institute receives funding from the Scottish Government Rural and Environment Science and Analytical Services Division (RESAS). PJW and AGB gratefully acknowledge funding from the European Union (NUE Crops 222645 and EURoot 289300, respectively).
References
- Bengough AG, McKenzie BM, Hallet PD, Dietrich RC, White PJ, Jones HG. 2009. Physical limitations to root growth: screening, scaling and reality. In: Proceedings of 7th ISRR Symposium on Roots: research and applications (RootRAP) Vienna: Institut für Hydraulik und landeskulturelle Wasserwirtschaft; p 174 [Google Scholar]
- Blomme G, Blanckaert I, Tenkouano A, Swennen R. 2004. Relationship between electrical capacitance and root traits Infomusa 13 14–18 [Google Scholar]
- Cao Y, Repo T, Silvennoinen R, Lehto T, Pelkonen P. 2010. An appraisal of the electrical resistance method for assessing root surface area Journal of Experimental Botany 61 2491–2497 [DOI] [PMC free article] [PubMed] [Google Scholar]
- Cao Y, Repo T, Silvennoinen R, Letho T, Pelkonen P. 2011. Analysis of the willow root system by electrical impedance spectroscopy Journal of Experimental Botany 62 351–358 [DOI] [PMC free article] [PubMed] [Google Scholar]
- Chloupek O. 1972. The relationship between electrical capacitance and some other parameters of plant roots Biologia Plantarum 14 227–230 [Google Scholar]
- Chloupek O. 1977. Evaluation of the size of a plant’s root system using its electrical capacitance Plant and Soil 48 525–532 [Google Scholar]
- Chloupek O, Dostál V, Středa T, Psota V, Dvořáčková O. 2010. Drought tolerance of barley varieties in relation to their root system size Plant Breeding 129 630–636 [Google Scholar]
- Chloupek O, Skácel M, Ehrenbergerova J. 1999. Effect of divergent selection for root size in field-grown alfalfa Canadian Journal of Plant Science 79 93–95 [Google Scholar]
- Dalton FN. 1995. In-situ root extent measurements by electrical capacitance methods Plant and Soil 173 157–165 [Google Scholar]
- Dvořák M, Černohorská J, Janáček K. 1981. Characteristics of current passage through plant tissue Biologia Plantarum 23 306–310 [Google Scholar]
- Esau K. Anatomy of seed plants. New York: John Wiley; 1977. [Google Scholar]
- Kendall WA, Pederson GA, Hill RR., Jr 1982. Root size estimates of red clover and alfalfa based on electrical capacitance and root diameter measurements Grass and Forage Science 37 253–256 [Google Scholar]
- Matsumoto N, Homma T, Morita S, Abe J. 2001. Capacitance as a possible indicator for size of maize root system. In: Proceedings of 6th Symposium of the International Society of Root Research Nagoya: Japanese Society for Root Research, pp 578–579
- McBride R, Candido M, Ferguson J. 2008. Estimating root mass in maize genotypes using the electrical capacitance method Archives of Agronomy and Soil Science 54 215–226 [Google Scholar]
- Ozier-Lafontaine H, Bajazet T. 2005. Analysis of root growth by impedance spectroscopy (EIS) Plant and Soil 277 299–313 [Google Scholar]
- Pitre FE, Brereton NJB, Audoire S, Richter GM, Shield I, Karp A. 2010. Estimating root biomass in Salix viminalis × Salix schwerinii cultivar ‘Olof’ using the electrical capacitance method Plant Biosystems 144 479–483 [Google Scholar]
- Preston GM, McBride RA, Bryan J, Candido M. 2004. Estimating root mass in young hybrid poplar trees using the electrical capacitance method Agroforestry Systems 60 305–309 [Google Scholar]
- Rajkai K, Végh KR, Nacsa T. 2002. Electrical capacitance as the indicator of root size and activity Agrokémia és Talajtan 51 89–98 [Google Scholar]
- Rajkai K, Végh KR, Nacsa T. 2005. Electrical capacitance of roots in relation to plant electrodes, measuring frequency and root media Acta Agronomica Hungarica 53 197–210 [Google Scholar]
- Tsukahara K, Yamane K, Yamaki Y, Honjo H. 2009. A nondestructive method for estimating the root mass of young peach trees after root pruning using electrical capacitance measurements Journal of Agricultural Meteorology 65 209–213 [Google Scholar]
- Urban J, Bequet R, Mainiero R. 2011. Assessing the applicability of the earth impedance method for in situ studies of tree root systems Journal of Experimental Botany 62 1857–1869 [DOI] [PMC free article] [PubMed] [Google Scholar]
- van Beem J, Smith ME, Zobel RW. 1998. Estimating root mass in maize using a portable capacitance meter Agronomy Journal 90 566–570 [Google Scholar]


