

Background: Aerobic glycolysis promotes resistance against Aβ toxicity.
Results: Increased LDHA and PDK1 expression attenuates mitochondrial activity and confers resistance to Aβ. These proteins are down-regulated in a transgenic Alzheimer disease (AD) mouse model, and PDK1 is decreased in AD brain.
Conclusion: PDK and LDHA are central mediators of Aβ resistance.
Significance: Drugs that augment aerobic glycolysis may enhance brain cell survival in AD patients.
Keywords: Alzheimer Disease, Amyloid, Brain Metabolism, Mitochondrial Metabolism, Oxidative Stress, Pyruvate Dehydrogenase Kinase, Reactive Oxygen Species (ROS), Aerobic Glycolysis, Lactate Dehydrogenase A
Abstract
We previously demonstrated that nerve cell lines selected for resistance to amyloid β (Aβ) peptide exhibit elevated aerobic glycolysis in part due to increased expression of pyruvate dehydrogenase kinase 1 (PDK1) and lactate dehydrogenase A (LDHA). Here, we show that overexpression of either PDK1 or LDHA in a rat CNS cell line (B12) confers resistance to Aβ and other neurotoxins. Treatment of Aβ-sensitive cells with various toxins resulted in mitochondrial hyperpolarization, immediately followed by rapid depolarization and cell death, events accompanied by increased production of cellular reactive oxygen species (ROS). In contrast, cells expressing either PDK1 or LDHA maintained a lower mitochondrial membrane potential and decreased ROS production with or without exposure to toxins. Additionally, PDK1- and LDHA-overexpressing cells exhibited decreased oxygen consumption but maintained levels of ATP under both normal culture conditions and following Aβ treatment. Interestingly, immunoblot analysis of wild type mouse primary cortical neurons treated with Aβ or cortical tissue extracts from 12-month-old APPswe/PS1dE9 transgenic mice showed decreased expression of LDHA and PDK1 when compared with controls. Additionally, post-mortem brain extracts from patients with Alzheimer disease exhibited a decrease in PDK1 expression compared with nondemented patients. Collectively, these findings indicate that key Warburg effect enzymes play a central role in mediating neuronal resistance to Αβ or other neurotoxins by decreasing mitochondrial activity and subsequent ROS production. Maintenance of PDK1 or LDHA expression in certain regions of the brain may explain why some individuals tolerate high levels of Aβ deposition without developing Alzheimer disease.
Introduction
Alzheimer disease (AD)3 is a progressive neurodegenerative disease and is the most common form of age-related dementia. AD is characterized by widespread nerve cell death and the accumulation of extracellular plaques and intracellular neurofibrillary tangles within the brain (1). These plaques are primarily composed of amyloid-β peptide (Aβ), a 39–42-amino acid peptide derived from the proteolytic cleavage of the amyloid precursor protein (APP). The Aβ peptide, particularly the 42-amino acid long variant (Aβ42), is highly prone to undergo oligomerization and fibrillogenesis, events strongly associated with the disease state (2). The amyloid cascade hypothesis, first proposed over 15 years ago, suggests that Aβ deposition in the brain is the causative agent of AD (3, 4). Although multiple clinical trials have been conducted, i.e. testing agents that either prevent the cleavage of APP or promote increased clearance of Aβ, to date none of these trials have been successful in halting disease progression thus prompting the hunt for alternative therapies to combat AD (5).
Aβ deposition promotes mitochondrial dysfunction and an increase in reactive oxygen species (ROS) production resulting in oxidative damage, synaptic loss, and ultimately nerve cell death (6–9). However, numerous immunohistochemical studies of brain tissue from individuals without any history of dementia showed that up to 30% of the autopsied samples had significant plaque accumulation but little or no nerve cell loss (10, 11). It has been argued that asymptomatic individuals with high plaque accumulation likely had undiagnosed mild cognitive impairment and would have eventually developed AD had they lived long enough or had a high cognitive reserve. However, an alternative hypothesis is that these individuals may have acquired an innate resistance mechanism to the toxic effects of Aβ. Although difficult to study in patients, models of Aβ resistance have been generated in vitro following the continual exposure of cultured nerve cells to concentrations of Aβ that would otherwise be toxic and the eventual emergence of surviving clonal nerve cell populations. Analysis of these Aβ-resistant nerve cells revealed up-regulation of anti-oxidant enzymes compared with the sensitive parental cells (12, 13). Additionally these cells displayed an increased resistance to a wide array of neurotoxins, suggesting that acquisition of Aβ resistance also confers resistance to a variety of environmental stresses (14).
Intriguingly, Aβ-resistant cells also exhibit increased glucose uptake and flux through the glycolytic pathway and heightened sensitivity to glucose deprivation (15). These cells also appear to break down glucose in a unique manner, reminiscent of cancer cells. Cancer cells have been shown to shift metabolism from mitochondrial respiration to glycolysis and lactate production for their energy needs despite the presence of oxygen (16, 17). This phenomenon is termed the Warburg effect, or aerobic glycolysis, and is driven by hypoxia-inducible factor 1α subunit (HIF-1α) (18–21). HIF-1α is a heterodimeric transcription factor that regulates cellular adaptation to hypoxia and induces the transcription of pyruvate dehydrogenase kinase 1 (PDK1) (20, 21). PDK1 phosphorylates and inhibits pyruvate dehydrogenase, an enzyme responsible for the conversion of pyruvate to acetyl-CoA (21). When pyruvate dehydrogenase is inhibited, pyruvate is no longer an available substrate to fuel the TCA cycle, and mitochondrial oxygen consumption is decreased (21). Additionally, HIF-1α up-regulates the expression of LDHA, an enzyme responsible for the conversion of pyruvate to lactate, with the concomitant regeneration of nicotinamide (NAD+) (22).
Although HIF-1α was initially believed to be only active in low oxygen environments, recent findings have suggested that HIF-1α can be up-regulated under normoxic conditions in both normal and cancer cells (23–26). HIF-1α-regulated changes in metabolism not only allow for maintenance of energy homeostasis in prolonged low oxygen conditions but also attenuate generation of harmful ROS at higher oxygen levels (20). By repressing mitochondrial respiration, cancer cells are less likely to produce ROS and are more resistant to mitochondrial depolarization, two events tightly linked to induction of apoptosis (27).
Similar to cancer cells, the observed metabolic changes in Aβ-resistant cells arise through stabilization of HIF-1α (15). In addition, Aβ-resistant nerve cells have elevated PDK1 expression as well as an increase in LDHA activity and lactate production when compared with control cells (28). Moreover, mitochondrion-derived ROS, which are closely associated with Aβ toxicity, are markedly diminished in Aβ-resistant cells compared with Aβ-sensitive cells (28). Chemically or genetically inhibiting LDHA or PDK1 re-sensitizes resistant cells to Aβ toxicity, suggesting that the altered glycolytic metabolism in these cells may mediate Aβ resistance (28). Although a reduction in cerebral glucose metabolism, as measured by fluoro-2-deoxy-d-glucose (FDG) positron emission tomography (PET), is one of the most common diagnostic features of AD, recent evidence suggests that glucose utilization is more complex in the AD brain (29, 30). Studies using modified PET imaging, which measured both glucose consumption and oxygen utilization, revealed a strong correlation between the spatial distribution of elevated aerobic glycolysis and Aβ plaques in brain tissue from patients with AD and in normal individuals with high levels of Aβ deposition but without clinical manifestation of the disease (30). Additionally, the spatial distribution of Aβ deposition and increased aerobic glycolysis closely mirrors areas of high aerobic glycolysis in the normal healthy brain (31). These findings suggest that areas of the brain most susceptible to insult in AD may exhibit a Warburg effect as a protective mechanism that can be further activated in the presence of high levels of Aβ. However, this hypothesis has never formally been evaluated.
Here, we show that overexpression of LDHA or PDK1 in the B12 central nervous system cell line confers resistance to Aβ and other neurotoxins such as H2O2 and staurosporine. Increased survival in cells overexpressing LDHA or PDK1 is associated with decreased mitochondrial membrane potential, oxygen consumption, and ROS production, yet these cells maintain the ability to produce sufficient ATP. Expression of PDK1 and LDHA is decreased in wild type mouse primary cortical neurons exposed to Aβ and in cortical extracts from 12-month-old AD transgenic (APP/PS1) mice. Similarly, post-mortem cortical tissue from AD patients also revealed a decrease in PDK1 expression relative to control patient brain samples. These findings suggest that loss of the adaptive advantage afforded by aerobic glycolysis may exacerbate the pathophysiological processes associated with AD.
EXPERIMENTAL PROCEDURES
Materials
Cell culture reagents, including Dulbecco's modified Eagle's medium (DMEM), penicillin/streptomycin, DMEM without phenol red, and Dulbecco's phosphate-buffered saline (DPBS), were purchased from BioWhittaker (Walkersville, MD). Dialyzed fetal bovine serum (FBS) and horse serum were obtained from PAA Laboratories Inc. (Etobicoke, Ontario, Canada). Opti-MEM I, TrypLE Express, neurobasal medium, N2 supplement, B27 supplement, GlutaMAX-1 (100×) and Hanks' balanced salts solution were obtained from Invitrogen. Aβ(25–35) peptide was purchased from California Peptide Research (San Francisco). Poly-d-lysine, poly-l-ornithine, puromycin, dihydrochloride, dimethylformamide, and 3-(4,5-dimethylthiazol-2-yl)-2,5-diphenyltetrazolium bromide were all purchased from Sigma. DNase I and trypsin inhibitor were purchased from Roche Applied Science. G418 sulfate was purchased from Calbiochem. Mitotracker Red CM-H2XRos, tetramethylrhodamine methyl ester (TMRM), MitoSOX Red, 2′,7′-dichlorodihydrofluorescein diacetate (H2DCFDA), and the ATP determination kit were purchased from Invitrogen. MitoXpress-Xtra-HS was purchased from Luxcel Biosciences Ltd. (Cork, Ireland).
Cell Culture
The B12 rat central nervous system cell line was obtained from Dr. David Schubert (The Salk Institute, La Jolla, CA) and cultured as described previously (6, 13). The B12 central nervous system cells are an immortalized clonal cell line derived from a nitrosoethylurea-induced brain tumor in rats (32) and have been shown to be sensitive to Aβ toxicity. These cells were grown in DMEM supplemented with 10% FBS and 1% penicillin/streptomycin. For toxicity studies, the Aβ(25–35) peptide was dissolved in deionized water at 1 mg/ml, left overnight at room temperature to promote fibril formation, and subsequently stored at −20 °C.
Derivation of PDK1- and LDHA-overexpressing Cell Lines
For stable expression of PDK1 and LDHA, B12 cells were transfected with Lipofectamine (Invitrogen) according to the manufacturer's directions. Cells were plated at a density to achieve 70–80% confluency and transfected with vectors containing human PDK1 (pCMV6-AC) or LDHA (pCMV6-XL4) cDNA (Origene, Rockville, MD). Additionally, cells were transfected with an empty vector (pcDNA) as a positive control. Following selection in G418 (1 mg/ml) for 2 weeks, ∼10–12 clones were picked, expanded, and screened by immunoblot analysis for high level expression of either PDK1 or LDHA.
Derivation of PDK1 and LDHA Knockdown Cell Lines
For stable knockdown of PDK1 and LDHA, B12 cells were transfected with HuSH 29-mer shRNA (Origene, Rockville, MD) constructs directed at rat Ldha or Pdk1 transcripts followed by selection with puromycin as described previously (28). The shRNA construct directed against Ldha was 69GCCGAGAGCATAATGAAGAACCTTAGGCG, and the shRNA construct directed against Pdk1 was 29AATCACCAGGACAGCCAATACAAGTGGTT. A nontargeting shRNA construct (scrambled) in pRS plasmid was used as a negative control.
Immunoblot Analysis
B12 cells from subconfluent cultures were washed twice in cold DPBS and harvested in a Tris extraction buffer (50 mm Tris, pH 7.5, 2% SDS, and 1 mm PMSF). Protein extracts were quantified by a Lowry assay, resolved by 12% SDS-PAGE, and electroblotted onto PVDF membrane (Bio-Rad) (12). Membranes were probed with the following antibodies: polyclonal anti-LDHA (1:1000; Cell Signaling, Danvers, MA), polyclonal anti-PDK1 (1:1000; StressGen, San Diego), and a monoclonal anti-β-actin (1:2000; Cell Signaling, Danvers, MA) followed by incubation with an appropriate horseradish peroxidase-conjugated secondary antibody (Bio-Rad). The blots were developed using Pierce ECL Western blotting substrate (Thermo Scientific, Rockford, IL) and visualized with a Bio-Rad molecular imager (ChemiDoc XRS). Densitometric analysis was performed using ImageJ software. Band densities were standardized against β-actin, and the ratio of LDHA- or PDK1-specific bands relative to the β-actin band was determined. Relative intensity was calculated by comparing the LDHA/β-actin or PDK1/β-actin ratios of the transfected lines to the same ratio in the control cell line.
Cytotoxicity Assay
Aβ-, hydrogen peroxide-, and staurosporine-induced cytotoxicity was assessed by a modified 3-(4,5-dimethylthiazol-2-yl)-2,5-diphenyltetrazolium bromide assay (6, 13, 33). Cells were seeded (3 × 10³ cells/well) in a 96-well microtiter plate, and Aβ(25–35) was added to the test wells at a concentration of 20 μm and incubated for 48 h. To each well 10 μl of 3-(4,5-dimethylthiazol-2-yl)-2,5-diphenyltetrazolium bromide (2.5 mg/ml dissolved in DPBS) was added, and following a 4-h incubation, 100 μl of solubilization solution (20% SDS in 50% dimethylformamide, pH 4.8) was added to each well. The plates were rocked at room temperature overnight and then read on a microplate reader (Bio-Rad model 3550) using 595 nm as the test wavelength and 655 nm as the reference wavelength. The percent viability was calculated from the mean absorbance of the treated cells divided by the mean absorbance of the control cells and multiplied by 100%.
Oxygen Consumption
Oxygen consumption was monitored using the fluorescent oxygen probe MitoXpress-Xtra-HS. B12 cells (1.25 × 10⁵) were seeded on 60-mm dishes. The following day, Aβ(25–35) (20 μm) was added to the treatment dishes, and cells were incubated for 48 h. Cells were trypsinized, centrifuged, and resuspended at an appropriate density prior to the assay. Cells (2 × 10⁵) were transferred to a 96-well plate and incubated with the MitoXpress probe according to the manufacturer's instructions (Luxcel Biosciences Ltd.). Oxygen consumption was monitored as a function of fluorescence (excitation/emission 380/650 nm) every 2 min over a 6-h period on a time-resolved fluorescence microplate reader (Tecan, Infinite M1000). Data were analyzed using the program Mathematica as described previously (34). Oxygen concentration in micromolars was calculated by Equation 1, where X is the normalized fold change in fluorescence over the initial reading, 235 μm is the concentration of oxygen gas in fully saturated water at 30 °C, and S is the signal increase on deoxygenation.
 |
Linear regression over a span of 100 min was performed to determine the rate of oxygen consumption for each clone. Oxygen consumption rates were later standardized to cell number.
ATP Production
Cellular ATP was measured in B12 cells using a bioluminescence ATP determination kit. Approximately 7.5 × 10⁴ cells were plated in 35-mm dishes and the following day were treated with Aβ(25–35) (20 μm) for a further 48 h. Cells were harvested in a Tris extraction buffer (20 mm Tris, pH 7.8, 2 mm EDTA, 0.5% Nonidet P-40, and 25 mm NaCl). One microgram of protein sample was loaded in each well of a 96-well plate. The luciferin and luciferase buffers were prepared according to the manufacturer's instructions (Molecular Probes), and 100 μl was injected into each well. Luminescence was integrated over 10 s using a TECAN Infinite M1000 microplate reader. ATP contents were calculated by comparing the luminescence, using an ATP standard curve.
Fluorescence Microscopy
Mitochondrial membrane potential (Δψm) was visualized by the fluorescent dye TMRM (17). B12 cells were seeded between 1 × 10⁵ and 2 × 10⁵ cells on 30-mm plastic tissue culture dishes pretreated with polylysine and incubated overnight. The following day, cells were treated with 20 μm Aβ(25–35) for 48 h. Following treatment with Aβ, the media were aspirated, and new media were added containing TMRM at a concentration of 200 nm. Plates were then incubated at 37 °C for 20 min, washed in DPBS containing Hoechst stain (10 μg/ml), followed by an additional wash in DPBS, and then placed in phenol red-free DMEM. For treatment with H2O2 or staurosporine, cells were first stained using the above protocol. Following staining, cells were treated with either H2O2 (200 μm) or staurosporine (200 ng/ml) for 15 min before visualization. Cells were visualized by fluorescence microscopy (Zeiss-AxioObserver, ×40 objective), and pictures were taken using an Q Imaging (Retiga 1300 monochrome 10-bit) camera with Q Capture software. Pictures were taken of three random fields of view for each experiment. TMRM fluorescence was quantified with ImageJ software.
Mitochondrial ROS production was visualized by the fluorescent dye Mitotracker Red CM-H2XRos (MTR). B12 cells were plated and seeded between 1 and 2 × 10⁵ cells on 30-mm plastic tissue culture dishes pretreated with polylysine and incubated overnight. The following day, the cells were treated with 20 μm Aβ(25–35) for 48 h. Following treatment with Aβ, the media were aspirated, and new media were added containing MTR at a concentration of 100 nm. Plates were then incubated at 37 °C for 20 min, washed in DPBS containing Hoechst stain, followed by an additional wash in DPBS, and then placed in phenol red-free DMEM. For treatment with H2O2 or staurosporine, cells were first treated with either H2O2 (200 μm) or staurosporine (200 ng/ml) for 30 min before visualization and then stained and visualized as described above. MTR fluorescence was quantified with ImageJ software. Mitochondrion-derived superoxide was also visualized using the fluorescent dye MitoSOX Red mitochondrial superoxide indicator. Glass bottom dishes were pretreated with polylysine, and cells were plated and treated as described above. Cells were stained with MitoSOX at 5 μm and incubated at 37 °C for 30 min. Plates were then washed in DPBS containing Hoechst stain and then placed in phenol red-free DMEM. Cells were visualized by fluorescence microscopy (Zeiss-AxioObserver, ×100 objective), and fluorescence was quantified as described above.
Overall, cellular ROS was visualized by the fluorescent dye 5-(and-6)-chloromethyl-2′,7′-dichlorodihydrofluorescein diacetate (CM-H2DCFDA). Cells were plated and treated as described above. Cells were stained with CM-H2DCFDA at 2.5 μm and incubated at 37 °C for 15 min. Plates were then washed once in PBS then visualized as described above. H2DCFDA fluorescence was quantified with ImageJ software.
For time-lapse microscopy, B12 cells were seeded at 2 × 10⁵ cells in a 6-well Chamlide TC stage chamber (Live Cell Instruments, Nowan-gu, Seoul, Korea) pretreated with polylysine (50 μg/ml) and incubated overnight at 37 °C in a tissue culture incubator. The following day, cells were stained with TMRM as described above. Following staining, the stage chamber was assembled onto the automated stage of a DMI6000 B inverted microscope (Leica Microsystems, Wetzlar, Germany) heated to 37 °C and perfused with 5% CO2 using an FC-5 CO2/air gas mixer (Live Cell Instrument, Nowan-gu, Seoul, Korea). Cells were treated with H2O2 (200 μm) and time-lapse differential interference contrast, and fluorescent images of cells were automatically captured from three independent fields of each well every 10 min over 4 h using a C10600 Hamamatsu digital camera (Meyer Instruments, Houston, TX) equipped with Metamorph software. The differential interference contrast and fluorescent images were overlaid, and a time-lapse video was generated using ImageJ software.
Primary Nerve Cell Cultures
Primary cortical neurons were prepared from mouse embryonic day 14–17 as described previously (35). Cells were seeded at a density of 1.6 × 10⁶ cells per dish and cultured in Neurobasal media containing 2 mm glutamine, 50 units/ml penicillin/streptomycin, and N2/B27 supplements and incubated for 48 h (35). The media were changed 48 h post-plating. At this time cells were treated with 10 μm Aβ(25–35). Cells were harvested in 2% SDS buffer as described above at 4, 8, 12, 16, 24, 36, and 48 h post-Aβ treatment. PDK1 and LDHA were visualized by Western blot analysis as described above, and protein quantification was performed using ImageJ software.
Mouse and Human Tissue
Cortical brain tissues from APP/PS1 (APPswe, PSEN1dE9) double transgenic mice were generously provided by Dr. David Schubert (The Salk Institute, La Jolla, CA). Twelve-month-old tg-AD mice and age matched controls were perfused with saline and protease inhibitor mixture, and brain regions were snap-frozen and stored at −80 °C. Frozen tissue samples were partially thawed, and ∼100-mg pieces were removed and minced in a 5× weight/volume extraction buffer containing 50 mm Tris, pH 7.5, 2% SDS, and protease inhibitor mixture (12, 15). Following sonication and centrifugation, supernatants were collected, and protein extracts were quantified using the Lowry assay. Protein extracts (15 μg) from the frontal cortex were analyzed by immunoblot analysis as described above.
Autopsied brain samples were obtained from Drs. Carol Miller and Jenny Tang at the Alzheimer Disease Research Center (University of Southern California School of Medicine, Los Angeles, CA). All tissue samples were extracted from the same area of the mid-frontal cortex and immediately quick frozen after removal. All AD and control cases were matched pairwise for age, sex, and in most cases post-mortem interval. All AD patients had a clinical history of dementia and a plaque density (plaques per field, PPF) in the low to moderate range according to The Consortium to Establish a Registry for Alzheimer disease criterion (1 = sparse, 1–5 PPF; 3 = moderate, 6–20 PPF; 5 = frequent, 21–30 PPF or above). Patient details are summarized in Table 1. Frozen tissue samples were partially thawed, and ∼100-mg pieces were removed and minced in a 5× weight/volume extraction buffer containing 50 mm Tris, pH 7.5, 2% SDS, and protease inhibitor mixture (12, 15). Following sonication and centrifugation, supernatants were collected, and protein extracts were quantified using the Lowry assay. Protein extracts (15 μg) were analyzed by immunoblot analysis as described above.
TABLE 1.
Control and AD patient details
| Patient | Diagnosis | Age | Sex | PMIa | PPF |
|---|---|---|---|---|---|
| C1 | Normal | 94 | Female | 4.5 | 0 |
| A1 | AD | 95 | Female | 4.5 | 3 |
| C2 | Normal | 87 | Female | 6 | 0 |
| A2 | AD | 86 | Female | 6 | 1 |
| C3 | Normal | 88 | Male | 2 | 0 |
| A3 | AD | 85 | Male | 4.5 | 1 |
| C4 | Normal | 69 | Male | 8 | 0 |
| A4 | AD | 75 | Male | 2 | 5 |
| C5 | Normal | 91 | Female | NAb | 0 |
| A5 | AD | 90 | Female | 4.5 | 5 |
| C6 | Normal | 92 | Female | 7 | 0 |
| A6 | AD | 90 | Female | 7.5 | 3 |
| C7 | Normal | 80 | Male | 12 | 0 |
| A7 | AD | 77 | Male | 3 | 5 |
| C8 | Normal | 71 | Female | 11 | 0 |
| A8 | AD | 72 | Female | 5 | 5 |
a PMI, post-mortem interval.
b NA, not available.
Statistical Analysis
Data are presented as means ± S.D. resulting from at least three independent experiments. Data were analyzed statistically using a one-way ANOVA followed by a Tukey test (Vassar Stats). The oxygen consumption and primary nerve cell data were analyzed by a one-way ANOVA, and significant differences between means were determined by contrasts (Mathematica). Results were considered statistically significant at p < 0.05.
RESULTS
Overexpression of LDHA or PDK1 Confers Resistance to Aβ, H2O2, and Staurosporine Toxicity
LDHA and PDK1 are key enzymes that mediate the Warburg effect in cancer cells (17–19, 36). Previous studies have shown that increased PDK1 expression, LDHA activity, and lactate production are common features of Aβ-resistant cells (28). Therefore, we sought to determine whether overexpression of either LDHA or PDK1 in B12 Aβ-sensitive cells could confer resistance to Aβ toxicity. Western blot analysis of B12 cells transfected with vectors containing human LDHA or PDK1 cDNAs revealed elevated constitutive expression of LDHA or PDK1 compared with cells transfected with the control plasmid (pcDNA) (Fig. 1, A and B). B12 cells overexpressing LDHA or PDK1 exhibited a significant increase in cell viability following 48 h of exposure to Aβ(20 μm) when compared with control cells (Fig. 1C).
FIGURE 1.

Overexpression of LDHA or PDK1 increases resistance to Aβ and other toxins in B12-sensitive cells. A, immunoblot analysis of B12 Aβ-sensitive cells stably transfected with either pcDNA (empty vector) or a vector containing human LDHA cDNA revealed two clonal cell lines (clones 3 and 7) with markedly increased LDHA protein levels (*, p < 0.01). B, immunoblot analysis of extracts from two clonal cell lines (clones 6 and 7) stably transfected with a PDK1 expression vector confirmed a significant increase in PDK1 protein expression compared with the control cell line (**, p < 0.05). An additional 30-kDa PDK1 band was also elevated in PDK1-transfected cells and likely represents a cleavage product. Densitometric analyses of LDHA and PDK1 band intensities are indicated below each blot. Cell viability of clonal lines overexpressing either LDHA or PDK1 was significantly increased following exposure to either Aβ (20 μm) for 48 h (C), H2O2 (200 μm) for 24 h (D), or staurosporine (200 ng/ml) for 24 h (E) compared with the control cell line (*, p < 0.01).
Clonal nerve cell lines selected for resistance to Aβ toxicity have been shown to exhibit increased resistance to a wide array of neurotoxins (13, 14). We were therefore interested to see if overexpression of either LDHA or PDK1 conferred resistance to other stressors. The sensitivity of LDHA- and PDK1-overexpressing cells to glutamate, H2O2, staurosporine, and a variety of mitochondrial inhibitors (rotenone, antimycin, and oligomycin) was examined. Interestingly, none of the overexpressing lines were more resistant to any of the mitochondrial inhibitors or glutamate (data not shown). However, all LDHA- and PDK1-overexpressing cell lines showed an increased resistance to H2O2 (200 μm) and staurosporine (200 ng/ml; Fig. 1, D and E). Therefore, the overexpression of either LDHA or PDK1 confers resistance to H2O2 and staurosporine but not to neurotoxins that specifically disrupt the mitochondrial electron transport chain (ETC).
Attenuated LDHA and PDK1 Re-sensitize Cells to Aβ, H2O2, and Staurosporine Toxicity
Although we have previously shown that attenuation of LDHA and PDK1 in PC12 and B12 reversed Aβ toxicity in these cells, we sought to determine whether specific inhibition of LDHA and PDK1 expression by shRNA-mediated knockdown could also render B12 parental cells more sensitive to Aβ (28). Immunoblot analysis confirmed B12 cell lines stably transfected with shRNA directed at rat ldha or pdk1 transcripts exhibited decreased expression of the targeted mRNAs compared with cells transfected with a control shRNA containing a nonspecific/scrambled sequence (supplemental Fig. 1). Knockdown of either ldha or pdk1 in the B12 cells resulted in a significant decrease in cell viability, following 48 h of exposure to Aβ or 24 h of exposure to H2O2 or staurosporine when compared with the control (supplemental Fig. 1, C–E, p < 0.01). Thus attenuation of LDHA or PDK1 appears to further sensitize B12 cells to a variety of neurotoxins.
Decreased Mitochondrial Membrane Potential in LDHA- and PDK1-overexpressing Cells
Mitochondrial membrane potential is generated by oxidative phosphorylation (OXOPHOS) activity; thus, a decrease in mitochondrial membrane potential is indicative of decreased electron transport and OXOPHOS activity (17). Both elevated PDK1 and LDHA expressions have been tied to reduced mitochondrial OXOPHOS activity, and therefore we sought to determine whether overexpression of LDHA or PDK1 could result in decreased mitochondrial membrane potential (Δψm) following treatment with Aβ, H2O2, and staurosporine. Indeed, all overexpressing cell lines had significantly less Δψm as measured by reduced TMRM fluorescence, compared with control cells expressing plasmid alone (Fig. 2). When control cells were treated for 48 h with Aβ (20 μm), there was a significant increase in Δψm (p < 0.01), whereas Δψm remained unaltered in both LDHA- and PDK1-overexpressing cell lines compared with untreated cells. Similar results were obtained when cells were treated with either H2O2 (200 μm) or staurosporine (200 ng/ml) for 30 min, namely the control cells showed a significant increase in membrane potential (p < 0.01), whereas all the LDHA- and PDK1-overexpressing cell lines significantly maintained Δψm. Time-lapse microscopy revealed that control cells displayed increased Δψm or hyper-polarization, followed by rapid depolarization and cell death when exposed to H2O2 (200 μm) (supplemental Video 1). In contrast, LDHA- and PDK-overexpressing cells showed decreased Δψm under control conditions, which was maintained when cells were exposed to H2O2 (200 μm). Furthermore, the majority of cells overexpressing either LDHA or PDK1 did not undergo mitochondrial membrane depolarization and subsequent cell death following treatment with H2O2. Taken together, overexpression of either LDHA or PDK1 resulted in decreased Δψm, which is maintained following exposure to a variety of stressors.
FIGURE 2.

Decreased mitochondrial membrane potential in LDHA- and PDK 1-overexpressing cells. Top panels, mitochondrial membrane potential (Δψm) was measured in B12 cells following staining with the red fluorescing dye TMRM. Both PDK1- and LDHA-overexpressing B12 cell lines exhibited a significant reduction in Δψm under normal culture conditions compared with the control cell line expressing the empty vector (pcDNA) (*, p < 0.01). Cells expressing the empty vector (pcDNA) showed a significant increase in Δψm following exposure to Aβ (20 μm), H2O2 (200 μm), or staurosporine (200 ng/ml) compared with PDK1- and LDHA-overexpressing cells. As a counterstain, nuclei were stained with Hoechst (blue) and visualized by fluorescence microscopy at ×400 magnification. Bottom panels, quantification of TMRM fluorescence intensity revealed that Δψm was consistently lower in PDK- and LDHA-overexpressing cells in the absence (−) or presence (+) of the indicated stressor when compared with the pcDNA control cell line. Data presented are the average of three independent experiments.
Overexpression of LDHA or PDK1 Decreases Oxygen Consumption but Maintains ATP Levels in the Presence of Aβ
The overexpression PDK1 or LDHA is believed to be sufficient to shift metabolism away from mitochondrial respiration toward increased lactate production (17, 36). Thus, we sought to determine whether the overexpression of these enzymes in B12 cells would result in a reduction in oxygen (O2) consumption, a measure of mitochondrial respiration. O2 consumption was monitored in B12 cells stably expressing LDHA or PDK1 using MitoXpress-Xtra-HS, a fluorescent oxygen probe. Under control conditions, all PDK1- and LDHA-expressing clonal lines exhibited significantly decreased O2 consumption compared with the pcDNA control (Fig. 3A, p < 0.05). Interestingly, 48 h of Aβ(25–35) (20 μm) treatment resulted in decreased O2 consumption in the pcDNA control line but had little effect on the overexpressing clones (Fig. 3, p < 0.05).
FIGURE 3.

Respiration is decreased but ATP levels are maintained in cells overexpressing LDHA and PDK1. A, oxygen consumption was monitored in B12 cell lines using the MitoXpress-Xtra-HS fluorescent probe. All clonal cell lines overexpressing LDHA and PDK1 displayed significantly lower levels of oxygen consumption under control conditions compared with cells expressing an empty vector (pcDNA) (*, p < 0.05; **, p < 0.01). Oxygen consumption significantly decreased in pcDNA control cells following 48 h of treatment with Aβ(25–35) (20 μm) compared with untreated conditions (#, p < 0.05). In contrast, cells overexpressing LDHA or PDK1 maintain or increase their oxygen consumption following 48 h of Aβ exposure. B, representative example of oxygen consumption over time for the indicated B12 cell lines. C, representative example of oxygen consumption over time following 48 h of Aβ(25–35) (20 μm) treatment. D, cells overexpressing LDHA or PDK1 had similar levels of ATP when compared with control cells under normal culture conditions. Cells expressing empty vector had significantly lower levels of ATP following exposure to Aβ (#, p < 0.05), whereas LDHA- and PDK1-overexpressing cells maintained significantly higher ATP levels than the control following treatment with Aβ (*, p < 0.05). Data represent the average ± S.D. of three independent experiments. Data were analyzed by a one-way ANOVA followed by a Tukey test.
Considering that mitochondrial respiration is a far more efficient way of producing energy compared with lactate production, we sought to determine whether the observed decreased O2 consumption affected the levels of ATP in cells overexpressing LDHA or PDK1. Intracellular ATP levels were measured in the B12-overexpressing cell lines cultured in the absence or presence of 20 μm Aβ for 48 h. Under control conditions, all B12 cell lines had similar levels of ATP (Fig. 3D). However, Aβ treatment resulted in a 50% reduction in ATP levels in B12 control cells (pcDNA) (Fig. 3D, p < 0.05). Interestingly all PDK1- and LDHA-overexpressing clones maintained significantly higher levels of ATP production in the presence of Aβ compared with control cells under the same conditions (Fig. 3D, p < 0.05). These results suggest that cells that are less dependent on mitochondrial respiration are also less sensitive to Aβ-induced alterations in glucose metabolism and are able to maintain ATP levels in the presence of Aβ.
Attenuated Mitochondrial and Cellular ROS in LDHA- and PDK1-overexpressing B12 Cells
Reduced mitochondrial ROS is associated with the Warburg effect and was previously observed in Aβ-resistant cells with innately high PDK1 and LDHA activity (17, 28, 37). Therefore, we sought to determine whether overexpression of either PDK1 or LDHA in Aβ-sensitive cells could reduce mitochondrial ROS when exposed to Aβ or other stressors. We examined mitochondrial ROS in control and LDHA/PDK1-overexpressing cells using MTR CM-H2XRos, a mitochondrial specific dye that fluoresces when oxidized by ROS (17). Under control conditions, all LDHA- and PDK1-overexpressing cells showed significantly less mitochondrial ROS, as measured by mean MTR fluorescence, when compared with the control cells expressing an empty vector (Fig. 3. p < 0.01). Moreover, LDHA- and PDK1-overexpressing cell lines exhibited significantly lower levels of mitochondrial ROS when treated with Aβ (20 μm) for 48 h compared with the vector control cells (Fig. 4). In contrast, the parental cells expressing vector alone showed a significant increase in mitochondrial ROS following exposure to Aβ(p < 0.01). Similarly, LDHA- and PDK1-overexpressing cells generated significantly less mitochondrial ROS when exposed to either H2O2 or staurosporine for 30 min compared with vector control cells treated in the same manner. Similar results were obtained using MitoSOX, a mitochondrion-specific superoxide indicator (supplemental Fig. 2). Thus, overexpression of either LDHA or PDK1 resulted in a significant reduction in mitochondrial ROS, which is maintained following toxin exposure.
FIGURE 4.

Decreased mitochondrial ROS in LDHA- and PDK 1-overexpressing cells. Top panels, mitochondrial ROS production was measured in B12 cell lines following labeling with the red fluorescent dye MitoTracker-ROS Red (MTR). B12 clonal cell lines overexpressing PDK1 or LDHA exhibited a significant reduction in mitochondrial ROS (red) compared with the parental (pcDNA) cell line expressing the empty vector under both normal culture conditions and following exposure to Aβ(25–35)(20 μm), H2O2 (200 μm), or staurosporine (200 ng/ml) for the indicated time periods. Nuclei were stained with Hoescht (blue) and visualized by fluorescence microscopy at ×400 magnification. Bottom panels, quantification of MTR fluorescent images revealed that mitochondrial ROS production was significantly decreased in PDK1- or LDHA-overexpressing cell lines compared with the pcDNA control line (*, p < 0.05; **, p < 0.01). Data presented are the average of three independent experiments.
Overall, cellular ROS levels have been previously shown to increase when cells are treated with stressors such as Aβ (6, 8). We therefore sought to examine if the cellular levels of ROS were altered in B12 cells overexpressing LDHA or PDK1. We used the live cell fluorescent ROS indicator H2DCFDA to determine the overall levels of ROS. Under control conditions, cells overexpressing either LDHA or PDK1 showed significantly decreased basal levels of ROS when compared with the parental cell expressing the empty vector (supplemental Fig. 3, p < 0.01). Interestingly, significantly lower levels of ROS were maintained in these cells when exposed to Aβ, H2O2, or staurosporine (supplemental Fig. 3, p < 0.01). In contrast, B12 cells expressing empty vector alone exhibited a significant increase in cellular ROS following 48 h of exposure to Aβ or when treated with either H2O2 or staurosporine for 24 h (supplemental Fig. 3, p < 0.01). Thus, cells overexpressing either LDHA or PDK1 exhibit lower levels of both mitochondrial and cellular ROS when compared with control cells, which likely contributes to their broad resistance to oxidant-promoting neurotoxins.
Decreased LDHA and PDK1 Expression in Primary Nerve Cells following Exposure to Aβ
Expression of both PDK1 and LDHA in wild type mouse primary cortical nerve cell cultures was examined following Aβ exposure over a 48-h period (Fig. 5). A significant decrease in the expression of both these proteins was observed by 48 h following exposure to Aβ when compared with untreated cells harvested at the same time points. Decreased PDK1 and LDHA expression was unlikely due to loss of cells because minimal cell death was observed up to 48 h (data not shown). Therefore, it appears that Aβ exposure inhibits expression of Warburg effect enzymes in primary neurons.
FIGURE 5.

Aβ exposure inhibits expression of Warburg effect enzymes in mouse primary cortical neurons. A, primary cortical nerve cell cultures were exposed to Aβ(25–35) (10 μm) and harvested at the indicated time points over a 48-h period. Western blot analysis revealed that both PDK1 and LDHA expressions are decreased in cortical neurons exposed to Aβ compared with untreated cells. Densitometric analyses of PDK1 (B) and LDHA (C) band intensities are indicated. A significant decrease in both PDK1 and LDHA expression in Aβ-treated cells was observed by 48 h (*, 0.05 p < 0.05; **, p < 0.01). Data represent the average ± S.D. of three independent experiments. Data were analyzed by a one-way ANOVA, and significant differences between means were determined by contrasts.
Decreased LDHA and PDK1 Expression in tg-AD Mice at 12 Months
The APPswe/PSEN1dE9 double transgenic mouse strain (tg-AD) exhibits pronounced amyloid plaque accumulation and memory deficits at 12 months of age compared with age-matched controls (38, 39). Based on the neuroprotective properties of PDK1 and LDHA in culture, we sought to determine whether the levels of both enzymes were altered in cortical extracts from tg-AD mice relative to non-tg littermate controls. Immunoblot analysis (Fig. 6) revealed a significant reduction in overall levels of LDHA and PDK1 in tg-AD mice compared with controls (p < 0.001).
FIGURE 6.

PDK1 and LDHA protein levels are decreased in APPswe/PSEN1dE9 double transgenic (tg-AD) mouse brains. Top panels, immunoblot analysis of cortical extracts from 12-month-old mice revealed that PDK1 and LDHA protein levels were markedly decreased in tg-AD mice when compared with nontransgenic littermate controls. Bottom panel, densitometric analysis of the above immunoblots revealed significantly decreased PDK1 and LDHA expression in tg-AD mice compared with littermate controls (*, p < 0.001).
Decreased PDK1 Expression in Human AD Cortical Samples
It has been shown previously that glycolytic activity and enzymes involved in glycolysis are up-regulated in the AD brain (15). We therefore examined the levels of LDHA and PDK1 in extracts from post-mortem control and AD frontal cortex tissue. We observed no significant difference in the overall protein levels of LDHA (data not shown). However, a significant decrease in PDK1 protein expression was detected in AD brain samples when compared with age-matched controls (Fig. 7, p < 0.01).
FIGURE 7.

PDK1 is decreased in cortical extracts from AD patients. Top panels, immunoblot analysis of post-mortem human cortical extracts revealed decreased PDK1 levels in human AD brain samples (A1–A7) when compared with the age- and sex-matched controls (1–7). Bottom panel, densitometric analysis of the above blot revealed a significant decrease in PDK1 expression in AD patients compared with controls (*, p < 0.01).
DISCUSSION
Mitochondrial Membrane Potential, ROS Production, and Aβ Sensitivity
Mitochondrial dysfunction is a hallmark of AD, and it is thought to be central to Aβ toxicity. ROS can be produced by the leakage of electrons from the mitochondrial ETC, which results in the partial reduction of molecular oxygen and the subsequent generation of superoxide radicals (O2˙̄). Chronic increases in ROS production, as seen in AD, can lead to the oxidation and damage of macromolecules such as proteins, lipids, and nucleic acids and is strongly associated with the induction of apoptosis. Interestingly, cells depleted of mitochondrial DNA lacking critical subunits of the respiratory chain are not sensitive to the toxic effects of Aβ suggesting that Aβ relies on a functional mitochondrial respiratory chain to elicit toxicity (39). Aβ has been shown to accumulate within the mitochondria of AD patients and transgenic mice (40–43). The direct binding Aβ to the mitochondrial protein alcohol dehydrogenase (ABAD) promotes leakage of electrons, mitochondrial dysfunction, increased ROS production, and ultimately cell death (41). However, overexpression of the mitochondrial antioxidant enzyme manganese superoxide dismutase in tg-AD mice improved resistance to Aβ and attenuated the AD phenotype, suggesting that mitochondrial toxicity is central to Aβ-induced cell death (44). Here, we show that overexpression of LDHA or PDK1 in nerve cells results in both decreased Δψm and O2 consumption, which is associated with reduced mitochondrial ROS production and attenuated cell death following exposure to various toxins, including Aβ. Interestingly, the reduction in mitochondrial respiration does not appear to negatively affect ATP levels in cells overexpressing LDHA or PDK1. These cells are likely able to maintain high levels of cellular ATP through increased flux through the glycolytic pathway, similar to Aβ-resistant cells (15). We propose that decreased ETC activity and ROS production associated with LDHA and PDK1 expression is central to conferring protection against Aβ and other toxins. This is further supported by the observation that knockdown of either LDHA or PDK1 in B12 cells further potentiated sensitivity to Aβ and other neurotoxins. Moreover, genetic silencing of either LDHA or PDK1 in Aβ-resistant cells resulted in re-sensitization to Aβ toxicity, suggesting that these enzymes play an important role in protecting cells against Aβ toxicity (28).
Protective Role of LDHA and PDK1
Elevated LDHA and PDK1 expression may confer resistance to Aβ, H2O2, and staurosporine by a variety of mechanisms. Although Aβ is known to trigger an increase in H2O2 production resulting in free radical damage and cell death, H2O2 accumulation is not observed in Aβ-resistant cells (13). Moreover, cells selected for resistance against Aβ toxicity are also resistant to exogenously applied H2O2 and neurotoxins known to induce oxidative stress, suggesting that Aβ and H2O2 promote cell death by a similar mechanism (13, 14). Additionally, the observation that pretreatment of CNS primary cultures or PC12 and B12 cells with catalase, an antioxidant that detoxifies H2O2, results in protection against Aβ-induced cell death further suggests that H2O2 mediates Aβ toxicity (6). H2O2 treatment has been shown to induce transient Δψm hyperpolarization and a subsequent delayed burst of endogenous ROS in mouse primary neurons and human neuroblastoma cells. Furthermore, chemical inhibition of mitochondrial hyperpolarization was shown to protect neuronal cells from oxidative stress-induced cell death (45). In our study, PDK1 or LDHA overexpression also prevented the transient increase in Δψm following H2O2 exposure.
Interestingly, overexpression of LDHA or PDK1 also resulted in increased resistance to staurosporine, an apoptosis-inducing agent that was initially believed to promote toxicity in a ROS-independent manner (46). Staurosporine has been well characterized as a potent inducer of apoptosis through inhibition of protein kinases (46, 47). However, several studies have shown that staurosporine-induced apoptosis in neurons is partly dependent on mitochondrion-derived ROS (48–50). Given that oxidative stress is tightly associated with Aβ- and H2O2-induced cell death, overexpression of LDHA or PDK1 is likely to protect cells by reducing mitochondrial ETC activity and associated ROS production.
In this study, we observed decreased Δψm and O2 consumption in cells overexpressing LDHA or PDK1 compared with control cells, which was maintained following toxin exposure. In contrast, control cells underwent a sharp increase in Δψm followed by rapid depolarization and cell death in the presence of all toxins. A positive Δψm is created by the ETC that transfers protons (H+) into the intermembrane space. The resulting electrochemical gradient is subsequently used to synthesize ATP. Thus, if ETC activity is low, in the case of reduced mitochondrial respiration, then Δψm would also be low. Loss of Δψm altogether mediates the release of proapoptotic factors through the mitochondrial transition pore. In cells overexpressing PDK1, the observed decrease in Δψm and O2 consumption is likely reflective of a decrease in ETC activity as a result of pyruvate dehydrogenase inhibition (23). PDK1-mediated inhibition of pyruvate dehydrogenase results in decreased entry of pyruvate into the TCA cycle and a subsequent decrease in the production of the electron donors NADH and FADH2 necessary for ETC activity. In LDHA-overexpressing cells, LDHA competes with the mitochondrial NADH/NAD+ shuttle systems to regenerate NAD+ (51). Therefore, the overexpression of LDHA or PDK1 likely limits the availability of both pyruvate and NADH in the mitochondria thereby decreasing respiration and Δψm (36).
Previous studies revealed that more ROS is generated at higher mitochondrial membrane potentials, with dramatic increases in ROS being produced when mitochondrial membranes reach potentials of 140 mV or more (52). Conversely a small decrease (10 mV) in Δψm significantly attenuates ROS production (up to 70%) via complex I of the ETC, suggesting that moderate attenuation of membrane potential can result in significant changes in the oxidative potential of the cell (53). Interestingly, we observed that cells overexpressing LDHA or PDK1 exhibited decreased mitochondrial membrane potentials with or without exposure to toxins, which likely contributed to their resistance through the associated decrease in mitochondrial ROS. Moreover, the observed hyperpolarization prior to depolarization and cell death in H2O2-exposed control cells was likely associated with a burst in ROS production. Collectively, our findings suggest that cells exhibiting a lower Δψm and decreased mitochondrial ROS production under basal conditions may have a unique advantage over cells exhibiting higher Δψm when faced with a toxic stressor such as Aβ.
Glucose Metabolism in the AD Brain
Recent [18F]FDG PET imaging studies in tg-AD (APPSweLon/PS1M146L) mice revealed a dynamic picture of glucose utilization within the brain (54). In 3-, 6-, and 12-month-old tg-AD mice, it was found that there was an age-dependent increase in glucose uptake in the cortex, hippocampus, and striatum, areas associated with high plaque accumulation (54). However, this study did not discern what proportion of glucose was processed by aerobic glycolysis versus mitochondrial respiration. Here, we looked at 12-month-old APP/PS1 mice and observed a decrease in both LDHA and PDK1 expression in the frontal cortex when compared with age-matched controls. Thus, it is possible that at early stages of pathogenesis in tg-AD mice, nerve cells exploit the Warburg effect and increase glucose uptake to protect against Aβ toxicity. However, if LDHA and PDK1 expression decreases in older mice then more glycolytic flux would be processed through the mitochondria leading to increased ROS production, elevated apoptosis, and ultimately cognitive impairment. A more intensive longitudinal study of the Warburg effect in AD mice is necessary to offer more insight into the metabolic state of affected neurons.
Interestingly, a study measuring the regional distribution of aerobic glycolysis in the human brain revealed that areas most susceptible to amyloid toxicity exhibit high aerobic glycolysis (30). In the developing nervous system, aerobic glycolysis is believed to account for 90% of glucose consumed (55). During childhood, this fraction accounts for 35% of glucose utilization and finally drops to 10–12% in the adult brain (31). PET studies of cognitively normal individuals have shown an age-associated decrease in FDG uptake in regions of the brain frequently affected in AD, although these studies did not determine what proportion of glucose was processed by aerobic glycolysis versus oxidative phosphorylation (56). However, a recent neuroimaging study revealed a strong correlation between the spatial distribution of Aβ deposition and aerobic glycolysis in both cognitively normal individuals and AD patients (30). Thus, aerobic glycolysis may be elevated in areas of the brain most susceptible to insult as a pre-emptive protective mechanism or in response to Aβ accumulation during aging (Fig. 8). Loss of this protective mechanism may render certain areas of the brain susceptible to Aβ-induced neurotoxicity.
FIGURE 8.
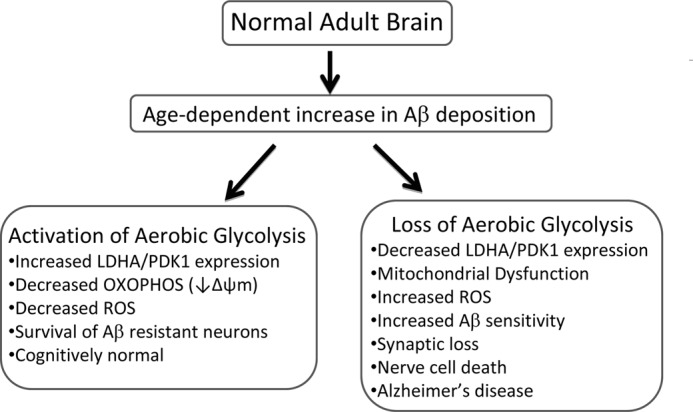
Proposed model describing the relationship between aerobic glycolysis and AD. In the normal young adult brain, aerobic glycolysis (the Warburg effect) is elevated in regions known to be susceptible to Aβ deposition. Aerobic glycolysis is maintained, in part, by increased lactate dehydrogenase A (LDHA) and pyruvate dehydrogenase kinase 1 (PDK1) expression. LDHA converts pyruvate to lactate with the concomitant regeneration of nicotinamide (NAD+) which is necessary to sustain glycolysis. PDK1 phosphorylates and inhibits pyruvate dehydrogenase resulting in decreased OXPHOS, mitochondrial membrane potential (Δψm), and ROS production. The age-associated increase in Aβ deposition and concomitant decrease in aerobic glycolysis may render certain populations of neurons vulnerable to Aβ toxicity in the elderly. In cognitively normal individuals, gradual Aβ deposition triggers increased expression of LDHA and PDK1 resulting in elevated aerobic glycolysis, lowered Δψm, and diminished ROS. As a result of increased aerobic glycolysis, nerve cells become resistant to Aβ toxicity. In individuals who develop Alzheimer disease, the inability to either activate or maintain aerobic glycolysis renders nerve cells more susceptible to Aβ-mediated mitochondrial dysfunction and increased ROS production leading to synaptic loss and ultimately widespread nerve cell death.
In this study, we looked at AD post-mortem tissue and observed a decrease in PDK1 expression in the frontal cortex. Decreased PDK1 expression may contribute to loss of aerobic glycolysis in brain areas with Aβ deposition which, in turn, may trigger an increase in mitochondrial respiration, ROS production, and nerve cell death. A recent study showed that inhibition of respiratory complexes in a cell culture model leads to an increase in both ROS and Aβ production, further potentiating toxicity (57). Similarly, AD mice treated with a complex I inhibitor also exhibit an increase in Aβ levels (57). In both models, ROS-dependent accumulation of Aβ was reduced by treatment with antioxidants. Therefore, mitochondrial ROS production appears to be tightly associated with Aβ production in vitro and in vivo (57). The decreased ROS production afforded by the Warburg effect may not only be intrinsically neuroprotective but may actually attenuate Aβ production in AD. In future studies it will be important to perform immunohistochemical analysis on brain tissues to determine the spatial relationship between PDK1 expression and Aβ deposition.
Although we propose that glucose is the main fuel source for Aβ-resistant neurons, alternative substrates, such as lactate, may be also used to meet the energy demands of brain cells. The astrocyte-neuron lactate shuttle theory postulates that glucose is predominantly taken up by glia and metabolized glycolytically to lactate, which is subsequently secreted and taken up by neurons (58). In neurons, lactate is converted to pyruvate which enters the TCA cycle and drives oxidative phosphorylation. Studies in our laboratory have shown that addition of lactate to the culture media of either PC12 or B12 cells failed to alleviate Aβ sensitivity.4 Furthermore, exogenous lactate failed to rescue the elevated sensitivity of Aβ-resistant PC12 and B12 clonal nerve cell lines to glucose deprivation.4 These findings suggest that exogenous lactate itself is unlikely to fuel the neuroprotective response associated with aerobic glycolysis.
Conclusions
PDK1 and LDHA appear to be central mediators of Aβ resistance by altering mitochondrial activity that results in a decrease in both Δψm and mitochondrial ROS production. In addition, overexpression of either of these enzymes confers resistance to other stressors, including H2O2 and staurosporine. Overexpression of these key Warburg effect enzymes decreases mitochondrial respiration while maintaining ATP production that appears to contribute to the protective role of these proteins. Decreased expression of LDHA and PDK1 in mouse primary cortical neurons may also contribute to their sensitivity to Aβ. Likewise, decreased expression of both LDHA and PDK1 in 12-month-old tg-AD (APP/PS1) mice suggests that loss of this neuroprotective mechanism may potentiate cognitive impairment. Loss of PDK1-mediated aerobic glycolysis in AD patients may hasten both memory loss and nerve cell death and could be used as a biomarker of disease progression. Moreover, identification of compounds that mimic or augment PDK1 activity may have clinical relevance for the treatment of AD.
Acknowledgments
We thank Dr. David Schubert at The Salk Institute, La Jolla, CA, for the generous donation of the B12 cell line and tissue samples. We also thank Dr. Jim Staples, Dr. Louise Milligan, and Dr. Ronald Podesta from the Department of Biology at the University of Western Ontario for technical assistance.
This work was supported in part by Natural Sciences and Engineering Research Council of Canada Grant 355803-2008 (to R. C. C.), Scottish Rite Charitable Foundation Grant 11103 (to R. C. C.), Canada Foundation for Innovation Grant 22167 (to R. C. C.), and Canadian Institutes of Health Research Grant 115135 (to R. J. R.).

This article contains supplemental Figs. 1–3 and Video 1.
J. T. Newington, T. Rappon, and R. C. Cumming, unpublished observations.
- AD
- Alzheimer disease
- Aβ
- amyloid β
- LDHA
- lactate dehydrogenase A
- ROS
- reactive oxygen species
- APP
- amyloid precursor protein
- TMRM
- tetramethylrhodamine methyl ester
- H2DCFDA
- 2′,7′-dichlorodihydrofluorescein diacetate
- CM-H2DCFDA
- 5-(and-6)-chloromethyl-2′,7′-dichlorodihydrofluorescein diacetate
- MTR
- Mitotracker Red
- DPBS
- Dulbecco's PBS
- PPF
- plaques per field
- ANOVA
- analysis of variance
- tg
- transgenic
- OXPHOS
- oxidative phosphorylation
- FDG
- fluoro-2-deoxy-d-glucose
- PET
- positron emission tomography
- ETC
- electron transport chain.
REFERENCES
- 1. Selkoe D. J. (2004) Alzheimer disease. Mechanistic understanding predicts novel therapies. Ann. Intern. Med. 140, 627–638 [DOI] [PubMed] [Google Scholar]
- 2. Selkoe D. J. (1998) The cell biology of β-amyloid precursor protein and presenilin in Alzheimer disease. Trends Cell Biol. 8, 447–453 [DOI] [PubMed] [Google Scholar]
- 3. Selkoe D. J. (1991) The molecular pathology of Alzheimer disease. Neuron 6, 487–498 [DOI] [PubMed] [Google Scholar]
- 4. Hardy J. A., Higgins G. A. (1992) Alzheimer disease. The amyloid cascade hypothesis. Science 256, 184–185 [DOI] [PubMed] [Google Scholar]
- 5. Ballard C., Gauthier S., Corbett A., Brayne C., Aarsland D., Jones E. (2011) Alzheimer disease. Lancet 377, 1019–1031 [DOI] [PubMed] [Google Scholar]
- 6. Behl C., Davis J. B., Lesley R., Schubert D. (1994) Hydrogen peroxide mediates amyloid β protein toxicity. Cell 77, 817–827 [DOI] [PubMed] [Google Scholar]
- 7. Tillement L., Lecanu L., Papadopoulos V. (2011) Alzheimer disease. Effects of β-amyloid on mitochondria. Mitochondrion 11, 13–21 [DOI] [PubMed] [Google Scholar]
- 8. Butterfield D. A., Reed T., Newman S. F., Sultana R. (2007) Roles of amyloid β-peptide-associated oxidative stress and brain protein modifications in the pathogenesis of Alzheimer disease and mild cognitive impairment. Free Radic. Biol. Med. 43, 658–677 [DOI] [PMC free article] [PubMed] [Google Scholar]
- 9. Markesbery W. R. (1997) Oxidative stress hypothesis in Alzheimer disease. Free Radic. Biol. Med. 23, 134–147 [DOI] [PubMed] [Google Scholar]
- 10. Bouras C., Hof P. R., Giannakopoulos P., Michel J. P., Morrison J. H. (1994) Regional distribution of neurofibrillary tangles and senile plaques in the cerebral cortex of elderly patients. A quantitative evaluation of a one-year autopsy population from a geriatric hospital. Cereb. Cortex 4, 138–150 [DOI] [PubMed] [Google Scholar]
- 11. Price J. L., Morris J. C. (1999) Tangles and plaques in nondemented aging and “preclinical” Alzheimer disease. Ann. Neurol. 45, 358–368 [DOI] [PubMed] [Google Scholar]
- 12. Cumming R. C., Dargusch R., Fischer W. H., Schubert D. (2007) Increase in expression levels and resistance to sulfhydryl oxidation of peroxiredoxin isoforms in amyloid β-resistant nerve cells. J. Biol. Chem. 282, 30523–30534 [DOI] [PubMed] [Google Scholar]
- 13. Sagara Y., Dargusch R., Klier F. G., Schubert D., Behl C. (1996) Increased antioxidant enzyme activity in amyloid β protein-resistant cells. J. Neurosci. 16, 497–505 [DOI] [PMC free article] [PubMed] [Google Scholar]
- 14. Dargusch R., Schubert D. (2002) Specificity of resistance to oxidative stress. J. Neurochem. 81, 1394–1400 [DOI] [PubMed] [Google Scholar]
- 15. Soucek T., Cumming R., Dargusch R., Maher P., Schubert D. (2003) The regulation of glucose metabolism by HIF-1 mediates a neuroprotective response to amyloid β peptide. Neuron 39, 43–56 [DOI] [PubMed] [Google Scholar]
- 16. Warburg O. (1956) On the origin of cancer cells. Science 123, 309–314 [DOI] [PubMed] [Google Scholar]
- 17. Bonnet S., Archer S. L., Allalunis-Turner J., Haromy A., Beaulieu C., Thompson R., Lee C. T., Lopaschuk G. D., Puttagunta L., Bonnet S., Harry G., Hashimoto K., Porter C. J., Andrade M. A., Thebaud B., Michelakis E. D. (2007) A mitochondria-K+ channel axis is suppressed in cancer and its normalization promotes apoptosis and inhibits cancer growth. Cancer Cell 11, 37–51 [DOI] [PubMed] [Google Scholar]
- 18. Le A., Cooper C. R., Gouw A. M., Dinavahi R., Maitra A., Deck L. M., Royer R. E., Vander Jagt D. L., Semenza G. L., Dang C. V. (2010) Inhibition of lactate dehydrogenase A induces oxidative stress and inhibits tumor progression. Proc. Natl. Acad. Sci. U.S.A. 107, 2037–2042 [DOI] [PMC free article] [PubMed] [Google Scholar]
- 19. Zhou M., Zhao Y., Ding Y., Liu H., Liu Z., Fodstad O., Riker A. I., Kamarajugadda S., Lu J., Owen L. B., Ledoux S. P., Tan M. (2010) Warburg effect in chemosensitivity. Targeting lactate dehydrogenase A re-sensitizes taxol-resistant cancer cells to taxol. Mol. Cancer 9, 33. [DOI] [PMC free article] [PubMed] [Google Scholar]
- 20. Kim J. W., Tchernyshyov I., Semenza G. L., Dang C. V. (2006) HIF-1-mediated expression of pyruvate dehydrogenase kinase. A metabolic switch required for cellular adaptation to hypoxia. Cell Metab. 3, 177–185 [DOI] [PubMed] [Google Scholar]
- 21. Papandreou I., Cairns R. A., Fontana L., Lim A. L., Denko N. C. (2006) HIF-1 mediates adaptation to hypoxia by actively down-regulating mitochondrial oxygen consumption. Cell Metab. 3, 187–197 [DOI] [PubMed] [Google Scholar]
- 22. Semenza G. L., Jiang B. H., Leung S. W., Passantino R., Concordet J. P., Maire P., Giallongo A. (1996) Hypoxia-response elements in the aldolase A, enolase 1, and lactate dehydrogenase A gene promoters contain essential binding sites for hypoxia-inducible factor 1. J. Biol. Chem. 271, 32529–32537 [DOI] [PubMed] [Google Scholar]
- 23. McFate T., Mohyeldin A., Lu H., Thakar J., Henriques J., Halim N. D., Wu H., Schell M. J., Tsang T. M., Teahan O., Zhou S., Califano J. A., Jeoung N. H., Harris R. A., Verma A. (2008) Pyruvate dehydrogenase complex activity controls metabolic and malignant phenotype in cancer cells. J. Biol. Chem. 283, 22700–22708 [DOI] [PMC free article] [PubMed] [Google Scholar]
- 24. Semenza G. L. (2010) HIF-1. Upstream and downstream of cancer metabolism. Curr. Opin. Genet. Dev. 20, 51–56 [DOI] [PMC free article] [PubMed] [Google Scholar]
- 25. Lu H., Dalgard C. L., Mohyeldin A., McFate T., Tait A. S., Verma A. (2005) Reversible inactivation of HIF-1 prolyl hydroxylases allows cell metabolism to control basal HIF-1. J. Biol. Chem. 280, 41928–41939 [DOI] [PubMed] [Google Scholar]
- 26. Lu H., Forbes R. A., Verma A. (2002) Hypoxia-inducible factor 1 activation by aerobic glycolysis implicates the Warburg effect in carcinogenesis. J. Biol. Chem. 277, 23111–23115 [DOI] [PubMed] [Google Scholar]
- 27. Koppenol W. H., Bounds P. L., Dang C. V. (2011) Otto Warburg's contributions to current concepts of cancer metabolism. Nat. Rev. Cancer 11, 325–337 [DOI] [PubMed] [Google Scholar]
- 28. Newington J. T., Pitts A., Chien A., Arseneault R., Schubert D., Cumming R. C. (2011) Amyloid β resistance in nerve cell lines is mediated by the Warburg effect. PLoS One 6, e19191. [DOI] [PMC free article] [PubMed] [Google Scholar]
- 29. Mosconi L. (2005) Brain glucose metabolism in the early and specific diagnosis of Alzheimer disease. FDG-PET studies in MCI and AD. Eur. J. Nucl. Med. Mol. Imaging 32, 486–510 [DOI] [PubMed] [Google Scholar]
- 30. Vlassenko A. G., Vaishnavi S. N., Couture L., Sacco D., Shannon B. J., Mach R. H., Morris J. C., Raichle M. E., Mintun M. A. (2010) Spatial correlation between brain aerobic glycolysis and amyloid-β (Aβ) deposition. Proc. Natl. Acad. Sci. U.S.A. 107, 17763–17767 [DOI] [PMC free article] [PubMed] [Google Scholar]
- 31. Vaishnavi S. N., Vlassenko A. G., Rundle M. M., Snyder A. Z., Mintun M. A., Raichle M. E. (2010) Regional aerobic glycolysis in the human brain. Proc. Natl. Acad. Sci. U.S.A. 107, 17757–17762 [DOI] [PMC free article] [PubMed] [Google Scholar]
- 32. Schubert D., Heinemann S., Carlisle W., Tarikas H., Kimes B., Patrick J., Steinbach J. H., Culp W., Brandt B. L. (1974) Clonal cell lines from the rat central nervous system. Nature 249, 224–227 [DOI] [PubMed] [Google Scholar]
- 33. Hansen M. B., Nielsen S. E., Berg K. (1989) Re-examination and further development of a precise and rapid dye method for measuring cell growth/cell kill. J. Immunol. Methods 119, 203–210 [DOI] [PubMed] [Google Scholar]
- 34. Hynes J., Swiss R. L., Will Y. (2012) High throughput analysis of mitochondrial oxygen consumption. Methods Mol. Biol. 810, 59–72 [DOI] [PubMed] [Google Scholar]
- 35. Ribeiro F. M., Black S. A., Cregan S. P., Prado V. F., Prado M. A., Rylett R. J., Ferguson S. S. (2005) Constitutive high affinity choline transporter endocytosis is determined by a carboxyl-terminal tail dileucine motif. J. Neurochem. 94, 86–96 [DOI] [PubMed] [Google Scholar]
- 36. Fantin V. R., St-Pierre J., Leder P. (2006) Attenuation of LDH-A expression uncovers a link between glycolysis, mitochondrial physiology, and tumor maintenance. Cancer Cell 9, 425–434 [DOI] [PubMed] [Google Scholar]
- 37. Michelakis E. D., Sutendra G., Dromparis P., Webster L., Haromy A., Niven E., Maguire C., Gammer T. L., Mackey J. R., Fulton D., Abdulkarim B., McMurtry M. S., Petruk K. C. (2010) Metabolic modulation of glioblastoma with dichloroacetate. Sci. Transl. Med. 2, 31ra34. [DOI] [PubMed] [Google Scholar]
- 38. Dineley K. T., Xia X., Bui D., Sweatt J. D., Zheng H. (2002) Accelerated plaque accumulation, associative learning deficits, and up-regulation of α7 nicotinic receptor protein in transgenic mice co-expressing mutant human presenilin 1 and amyloid precursor proteins. J. Biol. Chem. 277, 22768–22780 [DOI] [PubMed] [Google Scholar]
- 39. Cardoso S. M., Santos S., Swerdlow R. H., Oliveira C. R. (2001) Functional mitochondria are required for amyloid β-mediated neurotoxicity. FASEB J. 15, 1439–1441 [DOI] [PubMed] [Google Scholar]
- 40. Fernández-Vizarra P., Fernández A. P., Castro-Blanco S., Serrano J., Bentura M. L., Martínez-Murillo R., Martínez A., Rodrigo J. (2004) Intra- and extracellular Aβ and PHF in clinically evaluated cases of Alzheimer disease. Histol. Histopathol. 19, 823–844 [DOI] [PubMed] [Google Scholar]
- 41. Lustbader J. W., Cirilli M., Lin C., Xu H. W., Takuma K., Wang N., Caspersen C., Chen X., Pollak S., Chaney M., Trinchese F., Liu S., Gunn-Moore F., Lue L. F., Walker D. G., Kuppusamy P., Zewier Z. L., Arancio O., Stern D., Yan S. S., Wu H. (2004) ABAD directly links Aβ to mitochondrial toxicity in Alzheimer disease. Science 304, 448–452 [DOI] [PubMed] [Google Scholar]
- 42. Manczak M., Anekonda T. S., Henson E., Park B. S., Quinn J., Reddy P. H. (2006) Mitochondria are a direct site of Aβ accumulation in Alzheimer disease neurons. Implications for free radical generation and oxidative damage in disease progression. Hum. Mol. Genet. 15, 1437–1449 [DOI] [PubMed] [Google Scholar]
- 43. Caspersen C., Wang N., Yao J., Sosunov A., Chen X., Lustbader J. W., Xu H. W., Stern D., McKhann G., Yan S. D. (2005) Mitochondrial Aβ. A potential focal point for neuronal metabolic dysfunction in Alzheimer disease. FASEB J. 19, 2040–2041 [DOI] [PubMed] [Google Scholar]
- 44. Dumont M., Wille E., Stack C., Calingasan N. Y., Beal M. F., Lin M. T. (2009) Reduction of oxidative stress, amyloid deposition, and memory deficit by manganese superoxide dismutase overexpression in a transgenic mouse model of Alzheimer disease. FASEB J. 23, 2459–2466 [DOI] [PMC free article] [PubMed] [Google Scholar]
- 45. Choi K., Kim J., Kim G. W., Choi C. (2009) Oxidative stress-induced necrotic cell death via mitochondria-dependent burst of reactive oxygen species. Curr. Neurovasc. Res. 6, 213–222 [DOI] [PubMed] [Google Scholar]
- 46. Rüegg U. T., Burgess G. M. (1989) Staurosporine, K-252, and UCN-01. Potent but nonspecific inhibitors of protein kinases. Trends Pharmacol. Sci. 10, 218–220 [DOI] [PubMed] [Google Scholar]
- 47. Herbert J. M., Seban E., Maffrand J. P. (1990) Characterization of specific binding sites for [3H]staurosporine on various protein kinases. Biochem. Biophys. Res. Commun. 171, 189–195 [DOI] [PubMed] [Google Scholar]
- 48. Kruman I., Guo Q., Mattson M. P. (1998) Calcium and reactive oxygen species mediate staurosporine-induced mitochondrial dysfunction and apoptosis in PC12 cells. J. Neurosci. Res. 51, 293–308 [DOI] [PubMed] [Google Scholar]
- 49. Pong K., Doctrow S. R., Huffman K., Adinolfi C. A., Baudry M. (2001) Attenuation of staurosporine-induced apoptosis, oxidative stress, and mitochondrial dysfunction by synthetic superoxide dismutase and catalase mimetics in cultured cortical neurons. Exp. Neurol. 171, 84–97 [DOI] [PubMed] [Google Scholar]
- 50. Morais Cardoso S., Swerdlow R. H., Oliveira C. R. (2002) Induction of cytochrome c-mediated apoptosis by amyloid β(25–35) requires functional mitochondria. Brain Res. 931, 117–125 [DOI] [PubMed] [Google Scholar]
- 51. Golshani-Hebroni S. G., Bessman S. P. (1997) Hexokinase binding to mitochondria. A basis for proliferative energy metabolism. J. Bioenerg. Biomembr. 29, 331–338 [DOI] [PubMed] [Google Scholar]
- 52. Korshunov S. S., Skulachev V. P., Starkov A. A. (1997) High protonic potential actuates a mechanism of production of reactive oxygen species in mitochondria. FEBS Lett. 416, 15–18 [DOI] [PubMed] [Google Scholar]
- 53. Miwa S., Brand M. D. (2003) Mitochondrial matrix reactive oxygen species production is very sensitive to mild uncoupling. Biochem. Soc. Trans. 31, 1300–1301 [DOI] [PubMed] [Google Scholar]
- 54. Poisnel G., Hérard A. S., El Tannir El Tayara N., Bourrin E., Volk A., Kober F., Delatour B., Delzescaux T., Debeir T., Rooney T., Benavides J., Hantraye P., Dhenain M. (2012) Increased regional cerebral glucose uptake in an APP/PS1 model of Alzheimer disease. Neurobiol. Aging 33, 1995–2005 [DOI] [PMC free article] [PubMed] [Google Scholar]
- 55. Powers W. J., Rosenbaum J. L., Dence C. S., Markham J., Videen T. O. (1998) Cerebral glucose transport and metabolism in preterm human infants. J. Cereb. Blood Flow Metab. 18, 632–638 [DOI] [PubMed] [Google Scholar]
- 56. Cunnane S., Nugent S., Roy M., Courchesne-Loyer A., Croteau E., Tremblay S., Castellano A., Pifferi F., Bocti C., Paquet N., Begdouri H., Bentourkia M., Turcotte E., Allard M., Barberger-Gateau P., Fulop T., Rapoport S. I. (2011) Brain fuel metabolism, aging, and Alzheimer disease. Nutrition 27, 3–20 [DOI] [PMC free article] [PubMed] [Google Scholar]
- 57. Leuner K., Schütt T., Kurz C., Eckert S. H., Schiller C., Occhipinti A., Mai S., Jendrach M., Eckert G. P., Kruse S. E., Palmiter R. D., Brandt U., Dröse S., Wittig I., Willem M., Haass C., Reichert A. S., Müller W. E. (2012) Mitochondrion-derived reactive oxygen species lead to enhanced amyloid β formation. Antioxid. Redox. Signal. 16, 1421–1433 [DOI] [PMC free article] [PubMed] [Google Scholar]
- 58. Aubert A., Costalat R., Magistretti P. J., Pellerin L. (2005) Brain lactate kinetics. Modeling evidence for neuronal lactate uptake upon activation. Proc. Natl. Acad. Sci. U.S.A. 102, 16448–16453 [DOI] [PMC free article] [PubMed] [Google Scholar]