Abstract
We present a new method to enhance the sensitivity in static solid-state NMR for a gain in signal-to-noise ratio up to 40%. This sensitivity enhancement is different from the corresponding solution NMR sensitivity enhancement schemes and is achieved by combining single and multiple quantum dipolar coherences. While this new approach is demonstrated for the PISEMA (polarization inversion spin exchange at magic angle) experiment, it can be generalized to the other separated local field experiments for solid-state NMR spectroscopy. This method will have a direct impact on solid-state NMR spectroscopy of liquid crystals as well as membrane proteins aligned in lipid membranes.
NMR spectroscopy is an inherently low sensitivity technique.1 In spite of the technology advancements in high-field magnets, hardware, isotopic enrichments many hours or several days of signal averaging are required to collect multidimensional experiments for biomacromolecules. For liquid-state NMR, sensitivity enhancement (SE) pulse schemes represented a breakthrough.2, 3 When combined with transverse relaxation optimized spectroscopy (TROSY),4 SE methods have dramatically improved both sensitivity and resolution of NMR spectra, enabling the analysis of macromolecular systems greater than 80 kDa.5–7 While these developments involved mostly liquid-state NMR techniques, static and magic angle spinning (MAS) solid-state NMR experiments could in principle profit from them. For instance, TROSY-like effects have been recently observed in solid-state NMR spectra of proteins8–10 and some SE schemes have also been introduced for solids. 11, 12 However, these methods have not been fully developed for solids.
Here, we report the first example of SE via single and multiple quantum dipolar coherences for a net gain in signal-to-noise ratio (S/N) up to 40%. We implemented the SE scheme for PISEMA (polarization inversion spin exchange at magic angle), a separated local field (SLF) experiment that correlates the dipolar coupling (DC) and chemical shift anisotropy (CSA) in two dimensions for static solid-state NMR spectroscopy.13, 14 SLF experiments have been widely applied for determining the interactions of peptides and proteins with membranes, elucidating the structure and topology of membrane proteins in aligned lipid bilayers, and analyzing liquid crystalline molecules15–26.
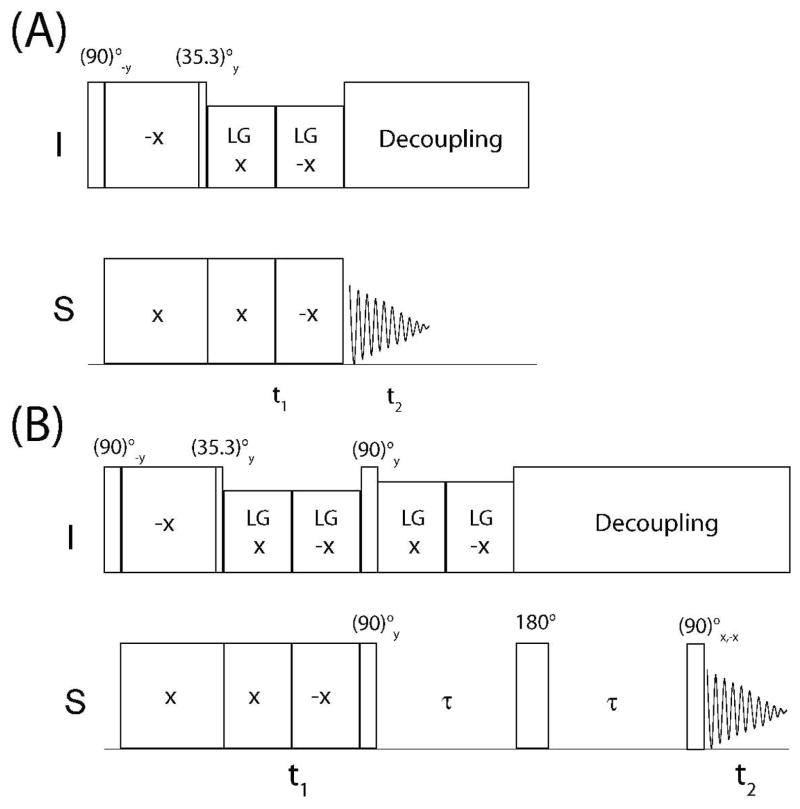
This new implementation is different from the liquid-state NMR SE technique or previous solid-state NMR schemes. In fact, the earlier SE schemes2, 3 detect two orthogonal components of chemical shift-modulated coherences, enhancing the signal-to-noise ratio (S/N) by a factor of or 40%. In contrast, our new approach detects two dipolar-modulated coherences encoded in single and multiple quantum coherences. The new pulse scheme presented here (sensitivity-enhanced PISEMA or SE-PISEMA) increases the sensitivity of the original experiment up to 40% (Figure 1).
Figure 1.
Pulse sequences for the conventional PISEMA (A) and for SE-PISEMA (B) experiments.
In the conventional PISEMA experiment (Figure 1A),13 a cross-polarization period from the abundant spins I (1H) to the S spins (15N) is followed by a 35° pulse on I spin, which flips the magnetization along the magic angle (54.3°). Spin exchange between I and S spins is then established during t1 evolution, by applying frequency switched Lee-Goldburg (FSLG) homonuclear decoupling sequence27 on I spins in synchronous with 180° phase-shifted 2π pulses on S spin, satisfying Hartmann-Hann condition.28 As a result, the spin diffusion among I spins and S spin chemical shift evolution are suppressed, giving rise to a scaled heteronuclear dipolar coupling evolution. For an I-S spin system, the density matrix (ρ) during t1 evolution of the PISEMA experiment can be described in the doubly tilted rotating frame defined by the operator U=exp(−iθmIy)·exp(−iSyπ/2) in the following form:29, 30
| (1) |
where ωIS = 2πDIS and DIS is heteronuclear dipolar coupling. Converting the S spin operators to laboratory frame by applying 90°y rotation, the above equation can be rewritten as
| (2) |
After t1 evolution, Sx is detected under I spin decoupling, and the final density matrix for a PISEMA experiment with two scans for each t1 increment is given by
| (3) |
where ωS represents the chemical shift of the S spin. From these equations, it is apparent that the conventional PISEMA experiment detects only the cosine modulated dipolar coherence while the sine modulated coherence is encoded in the unobservable two-spin order term.
In the SE-PISEMA experiment (Figure 1B), t1 evolution (eq. 2) is followed by a (90)° pulse on I and S spins, which converts the multiple quantum term 2IxSy into the antiphase S spin term 2IzSy, and the Sx term into Sz. The resulting density matrix is given by
| (4) |
During the time τ, FSLG spin lock is continued on I spins, which gives rise to a scaled heteronuclear dipolar coupling Hamiltonian HIS=cosθmωIS2IzSz. In this period, the Sz term does not evolve, whereas the antiphase S spin operator evolves under HIS as
| (5) |
The other operators, Ix and 2IySx, evolve into unobservable two-spin order terms and are neglected. The chemical shift evolution of the S spin during the first τ period is refocused by applying a π pulse followed by a second τ period under heteronuclear decoupling. Combining equations 4 and 5 and considering only the single spin operators of S spin, the density matrix can be written as
| (6) |
In eq. 6, sign inversion due to the π pulse is taken into account. At this point, a final π/2 pulse is applied on the S spin with phases x and –x in two separate scans followed by S spin detection under I spin decoupling. This scheme allows one to detect both sine and cosine dipolar coherences. The resulting FIDs (stored in separate files) can be described by the density matrices ρ1 and ρ2:
| (7) |
Addition and subtraction of the two density matrices gives the following sine (ρs) and cosine (ρc) terms, respectively:
| (8) |
Unlike the original PISEMA experiment, the SE-PISEMA scheme detects and also uncouples the sine- and cosine-modulated coherences by performing a two-step phase cycle of the last 90° pulse followed by addition and subtraction of the resultant data sets. Note that in the SE-PISEMA ρc and ρs are phase shifted by 90° in both dimensions. Therefore, a relative 90° zero-order phase correction after Fourier transformation is applied to obtain pure absorptive phase in both dimensions of ρc and ρs.2 In the sine modulated term the dipolar doublet peaks associated with each S spin have opposite signs. As a result, the addition or subtraction of the absorptive phased two-dimensional data sets ρc and ρs yields a two-dimensional spectrum, where the intensity of one component of the dipolar doublet is increased by a factor of (1+sin(cosθmωISτ)) and second component decreased by a factor (1−sin(cosθmωISτ)) compared to the corresponding resonances in the PISEMA experiment (eq. 3). The resulting density matrix for the SE-PISEMA obtained by subtracting ρs from ρc is given by:
| (9) |
The RMS noise of ρs and ρc is identical to that of the ρPISEMA. As for the SE scheme in liquid-state NMR,2 the addition or subtraction of two datasets (ρs and ρc, whose RMS noises are uncorrelated) causes the noise level to increase by a factor of . Therefore, the S/N for SE-PISEMA (eqs 8 and 9) and PISEMA (eq. 3) experiments are related by the following equation:
| (10) |
Since the S/N is a function of sin(cosθmωISτ), the sensitivity enhancement of SE-PISEMA experiment depends on the value of τ and the DC values. For τ=1/(cosθm4D), the term sin(cosθmωISτ) becomes equal to 1 and the SE has a maximum value of or 40%.
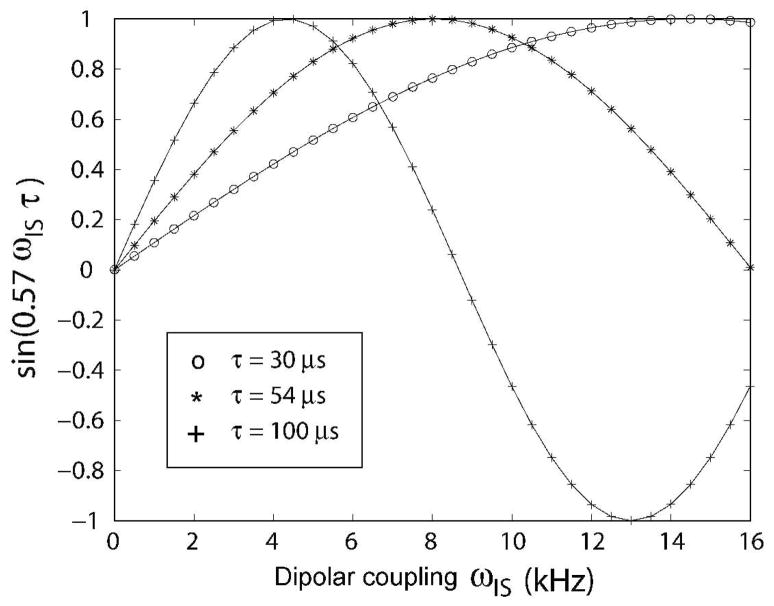
Figure 2 shows the theoretical values of sin(cosθmωISτ) as a function of the DC. For τ = 54 μs, the sin(cosθmωISτ) term is greater than 0.7 with a maximum of 1.0 for a dipolar couplings ranging from 4 to 12 kHz, giving rise to a range of sensitivity enhancement from 20 to 40%. It is noteworthy that the largest enhancements will occur for values of DIS greater than 5 kHz, which usually correspond to the DC values measured for the transmembrane domain resonances in oriented membrane protein samples.15, 19
Figure 2.
A. Simulations of the sin[(cosθm)ωISτ] factor as a function of the DC values for the SE-PISEMA experiment. For τ=54 ms, the maximum S/N enhancement is achieved with DIS~8 kHz.
To demonstrate this new method, we performed PISEMA and SE-PISEMA experiments on a single crystal of N-acetyl-leucine (NAL). The two dimensional spectra were acquired at 16.45 T using a VNMRS Varian spectrometer, equipped with flat coil low-E probe, which was developed at the National High Magnetic Field Laboratory in Florida31.
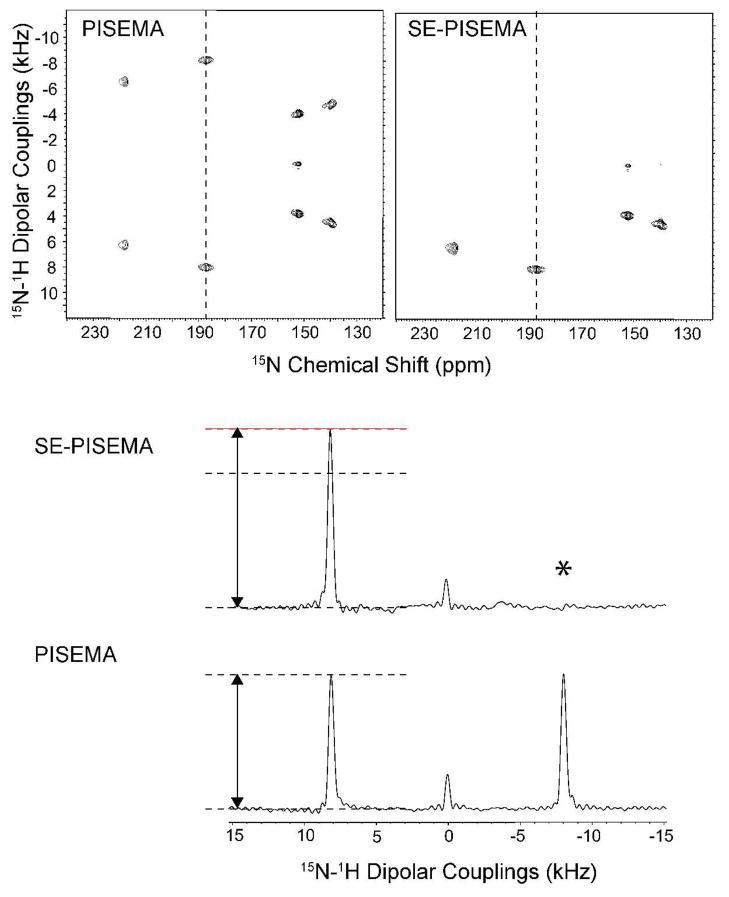
Figure 3 shows the two-dimensional PISEMA and SE-PISEMA spectra of NAL. The four-fold symmetry of the crystal unit generates a set of four distinct resonances with different values of the CSA and DC. Table 1 summarizes the S/N enhancements for each peak in the spectrum together with the corresponding theoretical values. The theoretical and experimental values are in good agreement, with the resonances showing the highest DC values displaying the largest percent enhancements. For the two peaks resonating at 187 and 218 ppm, the S/N enhancement is nearly at the maximum theoretical value of 40%. The slight deviations from theoretical values are due to evolutions during finite π/2 and π pulses.
Figure 3.
Top: comparison of two-dimensional spectra of NAL: conventional PISEMA experiment (Left) and SE-PISEMA experiments (Right). Both spectra were acquired with 2 ms cross-polarization time. The effective RF field during the t1 period was 50 kHz on both channels. For the SE-PISEMA the effective field of FSLG during τ period (54 μs) was 74 kHz. A total of 8 scans and 64 increments of t1 were used for both experiments. The dwell time in the indirect dimension was 40 μs, which correspond to a spectral width of 30.4 kHz after adjusting the theoretical scaling factor 0.82.14 The SE-PISEMA data set was divided by a factor of to match the same root-mean-square noise of the PISEMA experiment. Bottom: comparison of one-dimensional slices from the two-dimensional experiments taken at 187 ppm. The asterisk indicates the cancellation of one of the dipolar doublet components due to the subtraction of the cosine- and sine-modulated spectra (see text).
In conclusion, we have introduced a new approach to enhance the sensitivity of static solid-state NMR experiments. In the PISEMA experiment, this approach increases the S/N up to 40%. In the last two decades, several SLF experiments have been developed and applied to various solid samples.13 However, the low sensitivity of these experiments has drastically hampered the flourishing of these techniques. Taken with the enormous progress in probe technology31 and sample preparations16, the implementation of our new SE method in several SLF experiments will speed up multi-dimensional data acquisition. This will expedite the determination of the structure and topology of membrane proteins, the analysis of membrane-ligand and membrane-protein interactions as well as the high-resolution characterization of liquid crystals.
Table I.
Sensitivity enhancements (S/N) of SE-PISEMA pulse scheme with respect to PISEMA experiment for NAL resonances.
| 15N chemical Shift (ppm) | Experimental | Theoretical |
|---|---|---|
| 139.7 | 1.27 | 1.27 |
| 152.1 | 1.20 | 1.18 |
| 187.0 | 1.33 | 1.40 |
| 218.0 | 1.38 | 1.37 |
Acknowledgments
The authors would like to acknowledge Dr. N. Traaseth for careful reading of the manuscript. This work was supported by grants to G.V. from the National Institutes of Health (GM64742, HL80081, GM072701).
References
- 1.Ernst RR, Bodenhausen G, Wokaun A. Principles of Nuclear Magnetic Resonance in One and Two Dimensions. Oxford Science Publications; 1987. [Google Scholar]
- 2.Cavanagh J, Rance M. J Magn Res. 1990;88:72. [Google Scholar]
- 3.Kay LE, Keifer E, Saarinen T. Journal of the American Chemical Society. 1992;114:10663–10665. [Google Scholar]
- 4.Pervushin K, Riek R, Wider G, Wuthrich K. Proc Natl Acad Sci U S A. 1997;94:12366–71. doi: 10.1073/pnas.94.23.12366. [DOI] [PMC free article] [PubMed] [Google Scholar]
- 5.Tugarinov V, Hwang PM, Kay LE. Annu Rev Biochem. 2004;73:107–46. doi: 10.1146/annurev.biochem.73.011303.074004. [DOI] [PubMed] [Google Scholar]
- 6.Kreishman-Deitrick M, Egile C, Hoyt DW, Ford JJ, Li R, Rosen MK. Biochemistry. 2003;42:8579–86. doi: 10.1021/bi034536j. [DOI] [PubMed] [Google Scholar]
- 7.Fiaux J, Bertelsen EB, Horwich AL, Wuthrich K. nature. 2002;418:207–211. doi: 10.1038/nature00860. [DOI] [PubMed] [Google Scholar]
- 8.Skrynnikov NR. Magn Reson Chem. 2007;45:S161–S173. doi: 10.1002/mrc.2162. [DOI] [PubMed] [Google Scholar]
- 9.Chevelkov V, Faelber K, Schrey A, Rehbein K, Diehl A, Reif B. J Am Chem Soc. 2007;129:10195–10200. doi: 10.1021/ja072024c. [DOI] [PubMed] [Google Scholar]
- 10.Vosegaard T, Bertelsen K, Pedersen JM, Thogersen L, Schiott B, Tajkhorshid E, Skrydstrup T, Nielsen NC. J Am Chem Soc. 2008;130:5028–5029. doi: 10.1021/ja8000612. [DOI] [PMC free article] [PubMed] [Google Scholar]
- 11.Tycko R. Chemphyschem. 2004;5:863–868. doi: 10.1002/cphc.200301208. [DOI] [PubMed] [Google Scholar]
- 12.Oliver SL, Titman JJ. J Magn Reson. 1999;140:235–241. doi: 10.1006/jmre.1999.1844. [DOI] [PubMed] [Google Scholar]
- 13.Ramamoorthy A, Wei Y, Dong-Kuk L. Ann Rev NMR Spec. 2004;52:1–52. [Google Scholar]
- 14.Wu CH, Ramamoorthy A, Opella SJ. J Mag Res. 1994;109:270–272. [Google Scholar]
- 15.Opella SJ, Marassi FM. Chem Rev. 2004;104:3587–606. doi: 10.1021/cr0304121. [DOI] [PMC free article] [PubMed] [Google Scholar]
- 16.Page RC, Li C, Hu J, Gao FP, Cross TA. Magn Reson Chem. 2007;45:S2–S11. doi: 10.1002/mrc.2077. [DOI] [PubMed] [Google Scholar]
- 17.Traaseth NJ, Ha KN, Verardi R, Shi L, Buffy JJ, Masterson LR, Veglia G. Biochemistry. 2008;47:3–13. doi: 10.1021/bi701668v. [DOI] [PMC free article] [PubMed] [Google Scholar]
- 18.Dvinskikh SV, Yamamoto K, Scanu D, Deschenaux R, Ramamoorthy A. J Phys Chem B. 2008;112:12347–12353. doi: 10.1021/jp803265z. [DOI] [PubMed] [Google Scholar]
- 19.Traaseth NJ, Verardi R, Torgersen KD, Karim CB, Thomas DD, Veglia G. Proc Natl Acad Sci U S A. 2007;104:14676–14681. doi: 10.1073/pnas.0701016104. [DOI] [PMC free article] [PubMed] [Google Scholar]
- 20.Buffy JJ, Traaseth NJ, Mascioni A, Gor’kov PL, Chekmenev EY, Brey WW, Veglia G. Biochemistry. 2006;45:10939–10946. doi: 10.1021/bi060728d. [DOI] [PubMed] [Google Scholar]
- 21.Traaseth NJ, Buffy JJ, Zamoon J, Veglia G. Biochemistry. 2006;45:13827–13834. doi: 10.1021/bi0607610. [DOI] [PubMed] [Google Scholar]
- 22.Dvinskikh SV, Durr UH, Yamamoto K, Ramamoorthy A. J Am Chem Soc. 2007;129:794–802. doi: 10.1021/ja065536k. [DOI] [PMC free article] [PubMed] [Google Scholar]
- 23.Ramamoorthy A, Lee DK, Santos JS, Henzler-Wildman KA. J Am Chem Soc. 2008;130:11023–11029. doi: 10.1021/ja802210u. [DOI] [PubMed] [Google Scholar]
- 24.Waugh JS. Proc Natl Acad Sci U S A. 1976;73:1394–1397. doi: 10.1073/pnas.73.5.1394. [DOI] [PMC free article] [PubMed] [Google Scholar]
- 25.Sinha N, Ramanathan KV. Chemical Physics Letters. 2000;332:125. [Google Scholar]
- 26.Muller L, Kumar A, Baumann T, Ernst RR. Phys Rev Lett. 1974;32:1402–1406. [Google Scholar]
- 27.Bielecki A, Kolbert AC, de Groot HjM, Griffin RG, Levitt MH. Adv Magn Reson. 1990;14:111. [Google Scholar]
- 28.Hartmann SR, Hahn EL. Phys Rev. 1962;128:2042. [Google Scholar]
- 29.Gan Z. J Magn Reson. 2000;143:136–143. doi: 10.1006/jmre.1999.1971. [DOI] [PubMed] [Google Scholar]
- 30.Fu R, Tian C, Kim H, Smith SA, Cross TA. J Magn Reson. 2002;159:167–174. doi: 10.1016/s1090-7807(02)00036-8. [DOI] [PubMed] [Google Scholar]
- 31.Gor’kov PL, Chekmenev EY, Li C, Cotten M, Buffy JJ, Traaseth NJ, Veglia G, Brey WW. J Magn Reson. 2006 doi: 10.1016/j.jmr.2006.11.008. [DOI] [PubMed] [Google Scholar]


