Abstract
Few-node subgraphs are the smallest collective units in a network that can be investigated. They are beyond the scale of individual nodes but more local than, for example, communities. When statistically over- or under-represented, they are called network motifs. Network motifs have been interpreted as building blocks that shape the dynamic behaviour of networks. It is this promise of potentially explaining emergent properties of complex systems with relatively simple structures that led to an interest in network motifs in an ever-growing number of studies and across disciplines. Here, we discuss artefacts in the analysis of network motifs arising from discrepancies between the network under investigation and the pool of random graphs serving as a null model. Our aim was to provide a clear and accessible catalogue of such incongruities and their effect on the motif signature. As a case study, we explore the metabolic network of Escherichia coli and show that only by excluding ever more artefacts from the motif signature a strong and plausible correlation with the essentiality profile of metabolic reactions emerges.
1. Introduction
Analysing few-node subgraphs and network motifs has become an indispensable tool for understanding complex networks. Network motifs, the statistical over- or under-representations of few-node subgraphs, give insights into network organization beyond the trivial scale of individual nodes and links.
Any study that employs the perspective of network motifs to relate the function to the topology of a network must have strong evidence for the following: (i) the subgraph composition is non-random (compared with a suitable pool of reference graphs, i.e. to a ‘null model’) and (ii) the motifs can be related to function, i.e. over-represented subgraphs can be assigned plausible functional roles and/or under-represented subgraphs can be argued to be detrimental to the functioning of the system.
The general concept has been introduced and developed by the Alon and co-workers [1,2], particularly for transcriptional regulatory networks [3,4]. Ever since the early studies of network motifs, it was clear that other mesoscopic or macroscopic network properties can affect the perceived motif signature. In particular, the randomization procedure has drawn significant criticism [5–10]. Some examples of topological properties considered here that affect the motif signature are: (i) modularity [11–14] and (ii) hierarchical structures [15–19]. Others include: (i) the degree distribution (reviewed in Newman [20]) and (ii) degree correlations [21,22].
The crosstalk between global and local network properties and their effect on network motifs was assessed in recent studies [6,23,24]. The effect on motif signatures was formally explored for scale-free and hierarchical graphs [24], and the crosstalk between two graph properties (assortativity and clustering coefficient) was studied in detail with the help of a biased random walk in the ensemble of all graphs with fixed degree sequence [25]. Even if the topological analysis is beyond any doubt, the functional relevance of motifs for biological networks has been called into question [5,7,26].
The work by Ginoza & Mugler [8] has put forward a local argument for motif correlations induced by a property of the randomization scheme. While this argument (in the form given by Ginoza & Mugler [8]) is true only for graphs without bidirectional links (and therefore a reduced motif inventory) and for small densities (as otherwise a wider range of randomization steps will be available), the argument nevertheless shows the possibility of subtle intrinsic correlations influencing the result of a motif analysis. In Avetisov et al. [27], an algorithm for constructing modular hierarchical graphs is described. The authors, in particular, observe that their constructed graphs have a non-random motif composition, resembling one of the superfamilies from [2].
Here, we extend the topological arguments from the earlier-mentioned list and provide a clear and transparent catalogue of possible artefacts arising from mismatches between the network under investigation and the pool of randomized graphs serving as null model. The functional relevance of motifs will be investigated by combining them with dynamical data.
Our running example is the metabolic network of Escherichia coli; yet, in parallel, we also illustrate some of these problems with random graphs. We show that the successive removal of artefacts strongly modifies the motif signature. Using flux-balance analysis (FBA) [28], a standard method for predicting metabolic flux patterns and biomass production, we then show that the corrected motif signatures become functionally ever more plausible.
The organization of the text is as follows: a short overview on motifs, together with the methods employed here and the network representation of metabolism, is given in §2; a number of effects of network architecture on motif content are discussed in §3; issues in mapping (dynamical) data onto motifs are the focus of §4; and in §5, the implications of our results for the analysis of complex networks, in general, are described, as well as some aspects of further work.
2. Methods
2.1. Terminology and software packages
Throughout this paper, we discuss induced subgraphs, as they constitute the objects of interest in the vast literature on network motifs. By induced, we mean that for each pair of nodes of the subgraph, there is a (directed) link if and only if the same link appears in the original graph.
The general idea of a motif analysis is to compare few-node subgraph counts obtained from a real network with the corresponding counts obtained from randomized versions. In the case of three-node subgraphs, the corresponding Z-scores can be summarized in a triad significance profile (TSP) showing the statistical over- or under-representation of each of the subgraphs. The Z-score for subgraph m is defined as  , where cm is the count of subgraph m in the original network, μm is the expectation value of cm in the random networks and σm is the standard deviation of cm in the random networks.
A typical randomization scheme preserves the number of incoming, outgoing and bidirectional links at each node. The most prominent example is switch randomization, where iteratively endpoints of randomly selected links are swapped (ensuring that bidirectional and unidirectional links are randomized independently and that no parallel links are produced in this way). The exact procedure of randomizing a graph while retaining the degree sequence of the graph has been debated both in fields of application [29] and in more mathematical communities [30–33]. Apart from pure convergence issues of the iterative randomization process, the individual randomization step is of interest. In particular, one can accompany the decision by subsidiary conditions (e.g. enhancing positive or negative degree correlations or, alternatively, retaining global network features such as modularity or the diameter). However, such subsidiary conditions increase the risk of sampling the null model search space non-uniformly.
There are two sorting schemes for subgraph types in the literature. We will employ the one from Milo et al. [1], where subgraphs are grouped according to criteria (cyclic versus acyclic; then connectivity or number of bidirectional links), rather than the one, where three-node subgraphs are sorted according to their ‘identifier’ (the adjacency matrix of the subgraph, read as a binary number [34]). In all figures showing a TSP, we will also indicate this subgraph identifier underneath the corresponding subgraph pictogram.
The most important software packages for a motif analysis are mfinder, the software used in the original works on motifs [1], and FANMOD [35]. MAVisto [36] additionally has the ability to highlight motifs in labelled networks. Motif finding has also been implemented for the Pajek network analysis software [37].
In the following, we will show the impact of several large-scale topological properties on the TSP. To this end, we construct random graphs with prescribed large-scale properties and evaluate the subgraph composition. The random graphs are directed Erdős–Rényi (ER) graphs generated with an additional parameter pb that regulates the number of bidirectional links. The other parameter is the usual link probability p. In some places, we will analyse a ‘randomization error’, the sum over the squares of Z-scores over all subgraphs. Given that for purely random graphs, the ‘correct’ TSP must be zero for all subgraphs; this randomization error thus measures the deviation from the correct TSP.
When appropriate, we also show analytical predictions of the artefactual TSP. In these cases, we employ the formalism developed in Fretter et al. [38].
2.2. Network representations of metabolic systems
Metabolic networks are a condensed, abstract representation of the production and distribution of metabolic compounds (metabolites) by all biochemical reactions that can occur in an organism owing to the catalytic action of enzymes. Metabolites and reactions belong to distinct sets of nodes. The only possible connections are links between these two categories and not within, thus forming a bipartite network. More involved representations of metabolism exist, for example, including enzymes as another category of nodes [39], or choosing a hyper-graph structure to represent reaction–compound relations [40], but these representations are inaccessible to a wide range of current graph-analytical tools.
The topology of metabolic networks is organized in a complicated way. The degree distribution of metabolites is typically scale-free, the whole architecture modular and layered. Ignoring any hierarchy of functional modules, the uptake reactions, reactions contributing to biomass generation and all the reactions in-between result in a layered organization of metabolism. These complications present a formidable challenge in any attempt to explore the interrelations between network topology and dynamical function for metabolic systems [41,42].
Because most formalisms developed to analyse networks have been focused on general graphs where all nodes belong to the same mode or category, and arbitrary links are possible, henceforth called unipartite graphs or networks, metabolic networks are customarily projected onto either one of the two sets of nodes and the projected unipartite network is then analysed. In the majority, these analyses considered metabolism as an undirected network (see earlier studies [39,43,44] and for a critique of the projection of metabolic networks, see recent studies [41,45]).
A method for the projection of directed metabolic networks was presented [46]. We retain that method for projecting the metabolic network onto its metabolite-centric representation, i.e. connecting each substrate with each product of a certain reaction and introducing a bidirectional link if the reaction is reversible (see the scheme in figure 1). For a directed representation of the reaction-centric network, we draw a link between two reaction nodes if there is a directed path of length two from a source reaction Ri, through exactly one metabolite Ck, to another reaction  . The link is drawn in the direction of the existing path (as depicted in figure 2).
Figure 1.
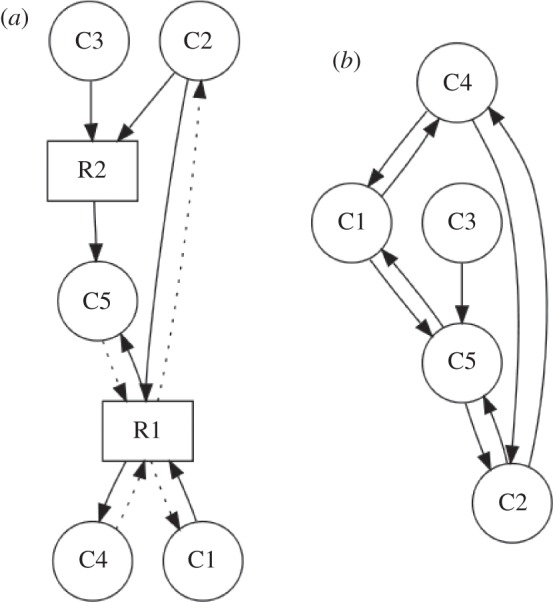
Projection of a metabolic bipartite network (a) onto its metabolite nodes (b). As discussed in §2.2, there are multiple ways of unambiguously storing reaction reversibility information in a network. Here, solid lines identify substrates and products of forward reactions and dashed lines the reverse direction.
Figure 2.
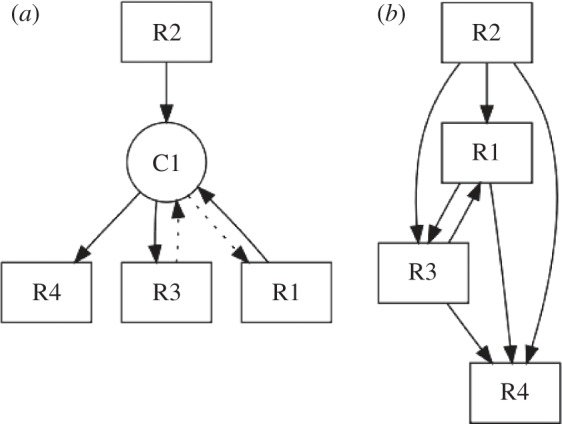
Projection of a metabolic bipartite network (a) onto its reaction nodes (b). As in figure 1, the reverse direction of a reaction is represented here with dashed lines.
Studying few-node subgraph compositions of metabolic networks suffers from several issues. First, few-node subgraphs are typically defined for unipartite graphs. Second, the choice of an appropriate null model is unclear. In the first publication of TSPs for metabolic networks [46], the metabolite-centric representations were treated as any other graph, and standard switch randomization was applied, thus ignoring, among others, effects caused by the projection process itself.
Attempts to define more realistic null models for metabolic systems need to focus on two aspects: (i) incorporating topological constraints such as the bipartite nature of the graph, adequate treatment of reversible reactions and modularity; (ii) incorporating functional constraints (such as mass balance [47] or other stoichiometric constraints [48]), ensuring that, in principle, the randomized graph could be a fully functional metabolism. In this paper, we will pursue the first aspect.
Eom et al. [46] have also neglected an important biological point when dealing with metabolic network structures. When we think of the metabolic capabilities of an organism, what we have in mind are the pathway maps that detail the procession of biochemical reactions required to transform a substrate taken up from the environment to a final product that is useful to the organism. In order to preserve this pathway structure, Ma & Zeng [49] suggested the removal of all currency metabolites from the network, i.e. all those compounds that provide energy or balance charges, or chemical groups among the main metabolites under transformation. In our opinion, such a step is necessary to reveal those structures otherwise dominated by the connections formed by these currency metabolites to almost all other reaction nodes in the network. In this study, we highlight the various results that stem from considering such technicalities and the topology-based constraints on metabolic null models.
In the following, we use a set of metabolic networks from 43 different organisms that were collected from the WIT database1 and published in recent studies [43,46]. They are available online as bipartite graphs.2
Our main object of study is then a metabolic network representation of E. coli compiled from the cytosolic components of the genome-scale metabolic model iAF1260 [50] that was manually curated such that connections to currency metabolites were removed, except in cases where these metabolites are the main reactants as, for example, in ATP synthesis [51]. In addition, the functional subsystem categories included in Feist et al. [50], i.e. core, amino acid, lipid, nucleotide or unspecific metabolism were used for the module-aware randomization described later on.
3. Finding motifs in metabolic topologies
The starting point for our work is the TSP published in Eom et al. [46], which we recomputed from the original networks and show in figure 3 in the subgraph ordering used in Milo et al. [1]. Most noteworthy about this result is the rather small overall magnitude of the standard deviation and the surprisingly small variation of the standard deviation across the triads. Of course, these are the means over-normalized Z-scores; yet their triad composition appears remarkably similar for networks of vastly different sizes.
Figure 3.
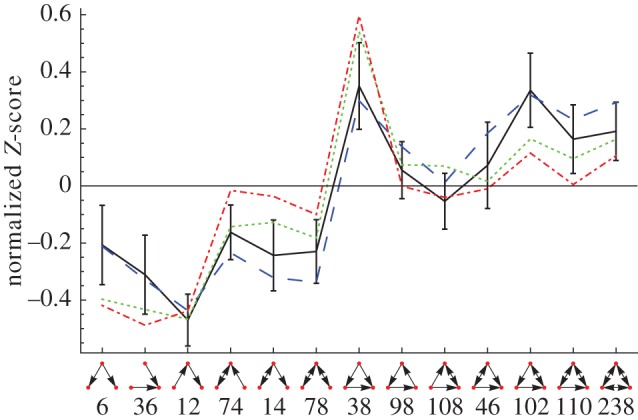
Mean and standard deviation of normalized Z-scores of three-node subgraph frequency in the metabolic networks of 43 different organisms when compared with a standard switch randomization of the metabolite-centric projection. Three examples of well-known organisms that enter the mean are also shown. The networks are the same as used in Eom et al. [46]. Raw Z-scores can be found in electronic supplementary material, figure S4. Solid line, mean 43 organisms; dashed line, E. coli; dotted line, S. cerevisiae; dashed-dotted line, A. thaliana. (Online version in colour.)
There are several problems attached to this database of 43 networks used, for example, in recent studies [43,46] and for computing the TSPs shown in figure 3. They are given as bipartite networks but compounds and reactions are identified only by indices, and so we lack any chemical information about them. Second, and related to the first issue, the networks still contain currency metabolites. Third, the links between compounds and reactions carry no additional information. It is therefore impossible to determine substrates and products for reversible reactions from the network. Why all of these points matter will be shown in the following.
3.1. Currency metabolites
From this point forward, we use the metabolic network of E. coli as described in §2.2. and previously used in Sonnenschein et al. [51]. We compare its TSP employing different null models with the network used in Eom et al. [46]. In figure 4, the curve labelled as ‘unipartite’ shows the TSP of the curated E. coli metabolic network after projecting it onto the compound nodes and using simple switch randomization as a null model.
Figure 4.
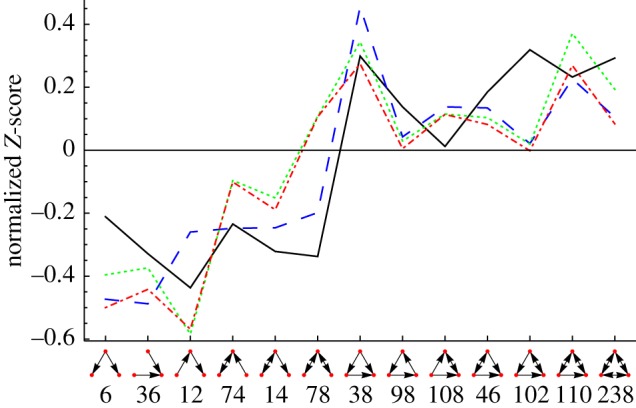
A comparison of the TSP of the metabolite-centric projection of the metabolic network from [46], labelled ‘original’, with the TSPs of the manually curated metabolic network [51] using three different null models that are labelled ‘unipartite’, ‘bipartite’ and ‘modular’. The curve labelled ‘unipartite’ stems from a switch randomization of the network after it has been projected onto its metabolite nodes. The ‘bipartite’ curve denotes that the randomized networks were generated on the level of the bipartite network, treating reversible reactions separately and then counting three-node subgraphs in the metabolite-centric projections. The ‘modular’ curve combines the ‘bipartite’ switch randomization with biological modules. The raw Z-scores can be seen in electronic supplementary material, figure S5. Solid line, original; dashed line, unipartite; dotted line, bipartite; dashed-dotted line, modular. (Online version in colour.)
Over- or under-representations of triads are particularly informative when related to the dynamical function of the system. Depending on the type of dynamic data available either the metabolite-centric or the reaction-centric, metabolic network representation and its motif signature may be the appropriate topological information. To the best of our knowledge for the first time, we show the TSP of the reaction-centric network of E. coli in figure 5. The curve labelled as ‘unipartite’ deviates extremely from the used null model. Most strikingly, the TSP separates clearly into two categories. The first six triads (the chain-like subgraphs) are all extremely under-represented, whereas the latter seven triads (triangular subgraphs) are mostly over-represented. Notably, although magnitudes differ, this is also the case for the metabolite-centric network (figure 4). The extreme values of the Z-scores seen in electronic supplementary material, figure S6 indicate an ill-formed null model.
Figure 5.
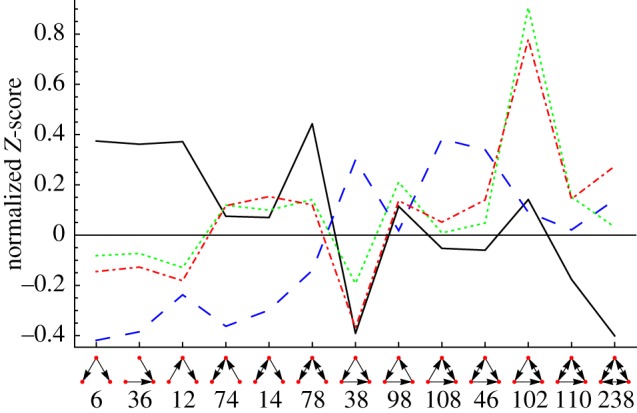
A comparison of the TSP of the reaction-centric projection of the metabolic network from [46], labelled ‘original’ (solid line), with the TSPs of the manually curated metabolic network [51] using three different null models that are labelled ‘unipartite’, ‘bipartite’ and ‘modular’. The curve labelled ‘unipartite’ (dashed line) stems from a switch randomization of the network after it has been projected onto its reaction nodes. ‘Bipartite’ (dotted line) means the randomized networks were generated in the bipartite network, treating reversible reactions separately, and then counting three-node subgraphs in the reaction-centric projections. The ‘modular’ (dashed-dotted line) is obtained from combining the ‘bipartite’ switch randomization with biological modules. The untransformed Z-scores can be seen in electronic supplementary material, figure S6. (Online version in colour.)
3.2. Categorizing bidirectional links
We will now include two more pieces of biochemical information that require us to return to the bipartite network representation of metabolism. First of all, there is mounting evidence that projecting a bipartite graph onto either set of nodes affects a number of topological quantities. In the case of clustering, this has been remarked for metabolism in Monta nez et al. [45] and discussed on a more general level in Latapy et al. [52]. The simplest way of incorporating all those effects into the null model is to perform switch randomization on the level of the bipartite graph. We can then compare statistics of the projected metabolic network with projections of the randomized bipartite counterparts.
Switch randomization on the level of the bipartite graph allows us to address another issue that has received little attention, namely bidirectional links. Typically, the number of bidirectional links is conserved in switch randomization, the argument being that they are a unique property of the network and not just the co-occurrence of two unidirectional links. It should be noted that in real networks, both types of bidirectional links can occur, in principle. It is plausible, for example, to assume that in gene regulatory networks a bidirectional link is rather the co-occurrence of two unidirectional links, while in metabolic networks reversible reactions certainly constitute an example of true bidirectionality as an individual category. In metabolism we also find, however, the case of two distinct enzymes being responsible for the two opposing directions of converting two compounds and, hence, the other interpretation of bidirectional links.
Does the distinction between the two types of bidirectional links and the related distinction between the two interpretations of the classical randomization scheme affect the observed motif signature? In order to motivate this general point, we show the impact of bidirectional links on the TSP of ER graphs (figure 6, also see electronic supplementary material, §S3 for more in-depth information).
Figure 6.
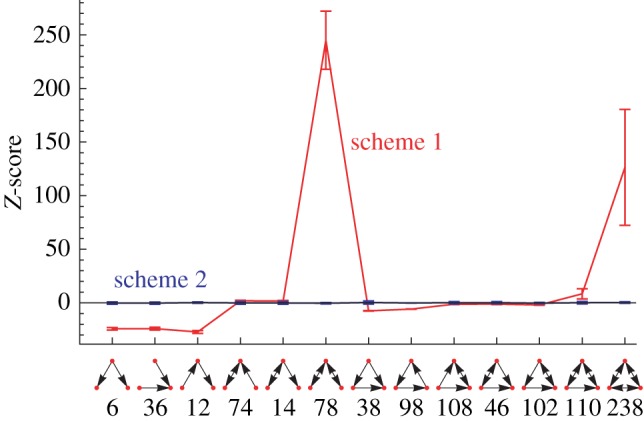
TSP of a graph with an elevated number of bidirectional links compared with the expected value μ. Two different randomization-schemes are applied (i) simple flipping of two link-endpoints, (ii) shuffling uni- and bidirectional links independently thus preserving the number of bidirectional links in the network. As the analysed network is random apart from its number of bidirectional links, the Z-scores using the correct randomization scheme can be expected to be close to zero. Obtained from graphs with N = 100 and M = 400, the number of bidirectional links was forced to 90% instead of the 16% expected for ER graphs at this connectivity. (Online version in colour.)
Returning to metabolic networks, the curves labelled ‘bipartite’ in figures 4 and 5 result from switch randomization on the level of the bipartite graph and a subsequent projection onto the respective set of nodes. Reversible reactions were treated separately from the others, but the co-occurrence of reactions performing opposing conversions of compounds is not an issue in the bipartite graph.
3.3. Modularity
One key observation about biological networks is their organization in modules (communities) that was related to their function and robustness. It was shown [53–55] that metabolism is not an exception. We will now use the insights into modules and their effect on Z-scores described in the electronic supplementary material, §S1.1 to show and explain the effects of modules on the TSP of graphs in general.
We assemble a graph from four dense modules, where each module is a directed ER graph. Additionally, a few inter-module links are introduced. As the graphs for each module as well as the inter-module links are constructed in a motif-blind way, correct randomization should yield a flat TSP, with all individual Z-scores being close to zero. The result of applying standard switch randomization can be seen in figure 8. We also show the result of a modularity-aware randomization scheme that mixes intra-module links and inter-module links separately. In real-world networks, the modular structure is generally not known, and thus the quality of this modularity-aware randomization scheme will depend on the quality of the module-detection algorithm employed. In order to better understand the error made by a randomization scheme without any module information, we will perform an analytical calculation that yields a prediction of the error signature. To obtain predictions for the artefactual TSP arising from switch randomization, we use the simple model of few-node subgraphs from Fretter et al. [38].
Figure 8.
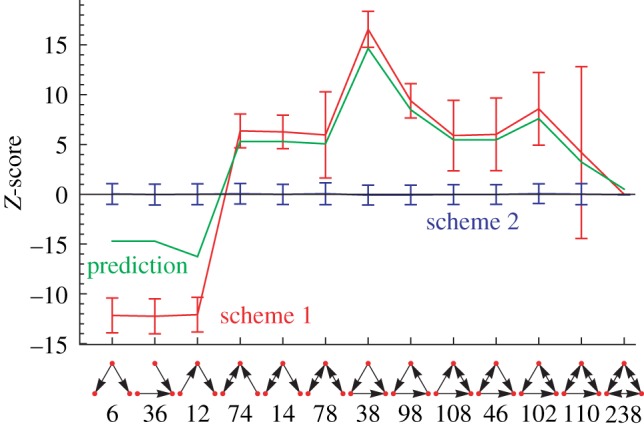
TSP of a graph composed of four strong modules. Two different randomization schemes are applied (i) simple flipping of two link-endpoints; and (ii) flipping while preserving the module structure. As the analysed network is random apart from its modularity, the Z-score using the correct randomization scheme must be 0. Additionally, the analytical prediction of the Z-score is drawn. Network parameters: N = 400, M = 1600, 8% inter-modular links. (Online version in colour.)
It is essential to note that, when the modules are destroyed, the effective local intra-module density of the network is reduced by a factor of the number of modules. This is because compared with a network with N nodes and M links a network of twice the size with N*=2N nodes and M*=2M links has a density of  .
.
Let N and M be the number of nodes and links of the whole modular network consisting of four modules, as shown in figure 7. Then, the count of a specific subgraph cm in the original graph can be estimated by  , the expectation value of that count in the random graphs by μm=cm(N,M) and the standard deviation of the counts by σm by σm(N,M). For details, please refer to electronic supplementary material, §S1.1 and Fretter et al. [38]. The module-unaware null model corresponds to taking the subgraph counts in the four modules, modelled as independent networks and comparing them with the total network containing all nodes and links. The resulting prediction is plotted in figure 8 and fits the numerical results very well. When all links are inter-modular, the effect of the modularity should vanish; electronic supplementary material, figure S3 shows that this is the case both in the experiment and in the prediction.
Figure 7.
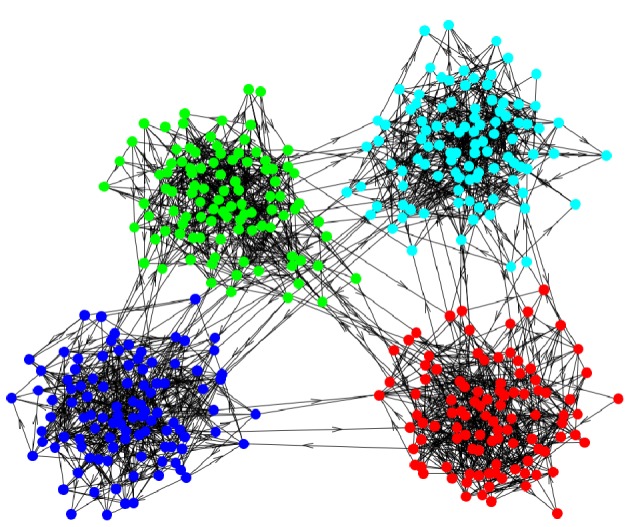
A graph composed of four strong modules. (Online version in colour.)
The results of figure 8 and electronic supplementary material, figure S3 clearly show that switch randomization performed on graphs with regions of varying densities leads to pathological signals in the TSP. Community detection algorithms work well as a remedy in this case, because they assess the quality of their module partition by comparing the number of links within a module with an expectation value as, for example, defined in eqn 5 of Newman & Girvan [12]. Thus, the quality measure, modularity, of the detected communities takes into account the relevant densities. However, community detection is a broad field of network science, and no perfect algorithms exist. A detailed discussion of community detection is beyond the scope of this study, but the reader is encouraged to look into relevant reviews such as Fortunato [56].
We would like to point out that Z-scores of triads in metabolic networks used in studies such as [46,57,58] have not accounted for the strong modularity that was discussed earlier. The curves labelled ‘modular’ in figures 4 and 5 show the respective TSPs using switch randomization that is module-aware on the level of the bipartite network. In figures 4 and 5, the Z-scores are shifted closer to zero, which could result from a more restricted search space of the null model.
Each reaction was manually assigned to a module based on its biological function. In Ravasz et al. [53], it has been shown that topological modules largely overlap with metabolic functional categories. Automated assignment of reactions to modules, based, e.g. on gene ontology classes, is therefore plausible. The functional groups are mentioned in §2.2.
Comparing the TSPs with figure 4 and also figure 5, some general trends can be observed. A change from the complete network to one without links by currency metabolites leads to greatly increased absolute Z-scores, and in the case of the reaction-centric projection to an inversion of the general trend of the curve. Proceeding to a switch randomization on the level of the bipartite graph causes another change in the trend of the TSP, yet, the absolute Z-scores are lower than on the unipartite level. Using a module-aware randomization scheme then further lowers the absolute values of the Z-scores.
It should be noted that in cases where both modularity and a (corresponding) non-zero TSP are observed in a real network, it is not clear as to how to assign causality. The only statement we can make is that part of an observed motif signature (or TSP) can be explained by modularity. It would be helpful to have appropriate statistical methods for two tests addressing the intrinsic causality among these inter-related network properties: could a non-modular (or less modular) graph host the same motif signature? Does the graph's modularity explain only part of the ‘signal strength’ observed in the motif signature or is the amplitude (or average Z-score) of the motif signature fully accounted for by the given modularity? In addition, overlapping modules, where nodes cannot be unambiguously assigned to individual modules, will have different impacts on the TSP than described here.
3.4. Networks with hierarchies
Similar to modularity, a hierarchical organization can cause distortions in a simple switch randomization.
Here, we will provide an example of a toy model that has some basic properties of metabolic networks. In metabolism, we can distinguish an input layer provided by the set of uptake reactions (with the input provided by the available nutrients in the environment), a set of middle layers, where reactions process the nutrients and an output layer consisting of all reactions directly contributing to cell growth (i.e. the ‘biomass vector’ often encountered in constrained-based modelling of metabolic systems). In the following, we will discuss layered random networks (inspired by the Kaluza–Mikhailov model of evolved flow networks; [59]).
The input layer is defined by a set of nodes with zero in-degree; the output layer is given by the set of nodes with zero out-degree. Middle nodes may receive a link from the input layer. They may also be interconnected with other middle nodes and they may be connected to the output nodes. The only topological restriction is that input nodes may not directly be connected to output nodes. An example of such a layered random network is shown in figure 9. In figure 10, we illustrate the effect of a hierarchical structure on the TSP using such a graph with three layers. Depicted are TSPs for standard switch randomization and for a randomization disallowing links from input to output nodes. Note that all the randomization methods keep the degree of nodes constant, i.e. input nodes (output nodes) retain their zero in-degree (zero out-degree). Because no additional motif bias (beyond the bias introduced by the layer structure) has entered the network generation, the correct null model ought to yield a flat TSP with all Z-scores close to zero.
Figure 9.
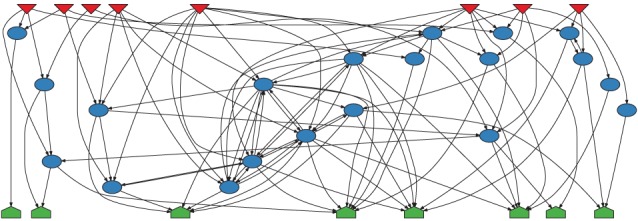
An example of the layered random network inspired by Kaluza et al. [59]. (Online version in colour.)
Figure 10.
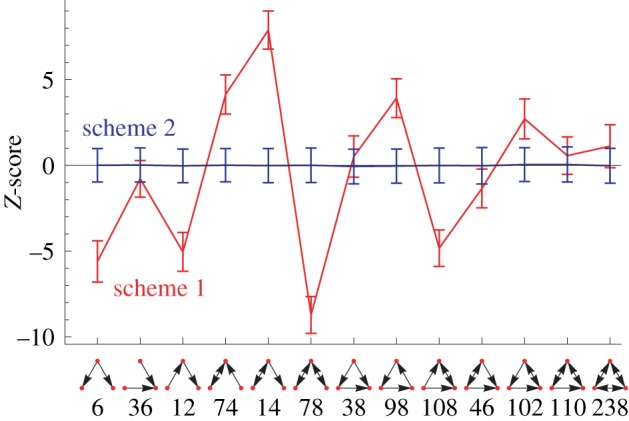
Average Z-scores over 1000 layered random networks. The networks contain 20 input nodes, 50 middle nodes, 20 output nodes and with the probability of a link being present of 0.3. We show Z-scores resulting from a random ensemble that was created using standard switch randomization (scheme 1) and a curve obtained from switch randomization with the additional constraint of disallowing direct links between the input and the output layer (scheme 2). (Online version in colour.)
4. Dynamic data on motifs
Beyond the purely structural issues, a completely new set of complications arises when dynamic information on graphs is added. The significance profiles discussed so far are obtained from contrasting the few-node subgraph counts in the given graph with subgraph counts from a suitable pool of randomized graphs. It yields statistical indicators pointing only to graph features that might be of functional relevance. In biological networks, this is particularly tangible, as deviations from randomness (with the right null model) can be interpreted as the influence of the evolutionary shaping of the network. However, this statistical observation needs to be linked back to the functional level in a more direct manner in subsequent investigations. Alon and co-workers have carried out this convincingly in the case of several three-node subgraphs (in particular, the feed-forward loop motif) by explicitly modelling dynamic processes on such a motif and classifying the signal processing capacities of such a few-node device [60,61].
A powerful alternative to this direct modelling is to analyse the systematics of dynamic data within a motif, i.e. on each individual node in a motif or distributed across the motif occurrences in the network. This has, for example, been performed in Krumov et al. [62] for citation frequencies on (undirected) co-authorship networks, in Marr et al. [63] for gene expression data on transcriptional regulatory networks, and in Sonnenschein et al. [64] for reaction essentiality categories.
In this work, we apply FBA to identify essential reactions in the metabolic network of E. coli. Within this elegant framework [28,65], the optimal steady-state distribution of metabolic fluxes can be predicted using linear programming, given the structure of the environment (i.e. the availability of nutrients) and the cellular objective function (e.g. biomass production or ATP maximization). All reactions whose elimination proved lethal in a wide range of different environmental conditions were considered essential. Please refer to electronic supplementary material, §S1.2 for specifics.
We use two schemes for analysing the distribution of dynamic data across motifs: (i) a single counting scheme, where a node can contribute its dynamic information (the value attached to this node, when mapping dynamic data onto the graph) only once to each subgraph type or (ii) a multiple counting scheme, which counts a node's dynamic information multiple times, if this node is part of multiple subgraphs of one type. The normalization differences between the two counting schemes, when averaging the dynamic information, often yield different results, in particular in cases where the dynamic information and the number of subgraphs a node participates in both scale non-trivially with the node's degree.
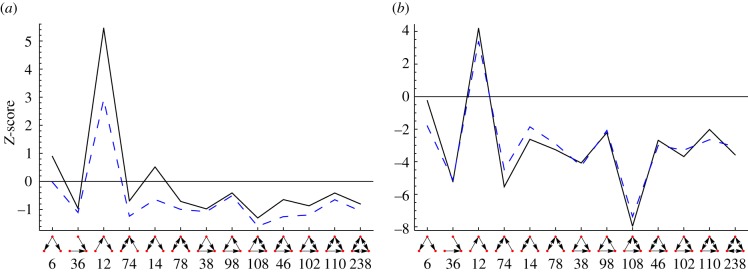
In figure 11, we show the Z-score of the probability of the occurrence of an essential reaction for each triad in the network when compared with a random distribution of essential reactions on the network. The surprising result is that essential reactions occur less frequently than expected in all types of three-node subgraphs with the exception of the ‘chain’ (id 12). This shows that essential reactions occur in non-random situations in the metabolic network. The exceptional situation of triads with id 12 remains to be explored further.
Figure 11.
Using two different methods of artificial growth media generation for flux balance analysis, all plots show Z-scores of the probability of finding essential reactions in certain triads when compared with 1000 random distributions of the same number of essential reactions on the network. The artificial growth media are called ‘Random’ for viable selections among all possible nutrients, and ‘Combinatorial’ for all minimal combinations of nutrients that sustain growth. (a) The frequency of exactly three essential reactions is a stringent measure and occurs almost as often as in the random models. The only exception is the ‘chain’-like triad with id 12. There is an agglomeration of three essential reactions on that triad. (b) Z-scores for essential reactions using a single counting scheme which also shows the particular role of the triad with id 12 but shows that in the accumulated case, i.e. an exact number of essential reactions participating in the subgraph is not required, essential reactions occur rather less frequently when compared with the null model. More scenarios can be seen in electronic supplementary material, figure S7. Solid line, random; dashed line, combinatorial. (Online version in colour.)
Next, we use the results from electronic supplementary material, figure S7 to relate the functional role of the triads back to the motif signature. The details can be found in electronic supplementary material, §S4. Compared with the TSP from Eom et al. [46] (positive correlations with the essentiality distribution curves), we find systematically negative correlations for our refined TSPs. The ‘unipartite’ TSP (enhanced treatment of currency metabolites) shows the strongest (negative) correlation, but also the ‘bipartite’ (randomization on the level of the bipartite graph) and the ‘modular’ TSP (module-aware randomization) display negative correlations.
5. Conclusions
We have systematically explored biases introduced into motif signatures by variations of the random background, i.e. of the set of reference graphs serving as null models. Making visible the cross-talk between global and local network properties is, in our opinion, an important prerequisite of any interpretation of motif signatures.
We want to point out that although sometimes real artefacts can be found, most of the time the boundary between a relevant result and an artefact is rather ambiguous. General features of networks with a simple explanation will sometimes be most visible in the motif signature. For example, in the case of modularity, a clear motif signature is easily obtained, while the modular structure of the network is much more difficult to detect and to understand. The motif signature can thus serve as a marker for non-random network features on diverse topological scales.
A major conceptual step in systems biology is to reveal systematic and significant deviations of a biological system from randomness, and subsequently relate these deviations to specific functional features. Both, our own analyses and the few attempts found in the literature of exploring network motifs in metabolism show the immense difficulty of disentangling contributions to motif signatures coming from the mere network construction and those coming from the evolutionary shaping of the system towards an optimized function.
Even though our refined TSPs can be regarded as better approximations to the true enhancement or suppression of three-node subgraphs metabolic systems may have evolutionarily acquired, it is clear that additional refinement steps should be taken into account. In recent publications, Basler et al. [42,47] have presented and motivated a novel method for generating chemically sensible, mass-balanced randomized metabolisms. The main idea being that physico-chemical constraints are part of the null model so that any remaining deviations must result from evolutionary pressure and are thus worth studying. Basler et al. [42] discuss a number of structural properties that show changed results when compared with this new null model.
Some dynamical systems are highly sensitive to motifs as small functional devices. A whole range of investigations have identified a deep relationship between network motifs and the robust functioning of systemic processes [7,59,60,66,67]. In order to understand the generality and fundamental nature of these links between topology and dynamics, one needs better knowledge of the intrinsic statistical properties of few-node subgraphs as well as the most minimal dynamical situations, in which such a relationship between topology and dynamics can occur. With the present investigation, we want to contribute to this understanding of statistical signals obtained from motif analyses. We advocate carefully chosen null models designed with a profound grasp of the system under investigation. This also means that once more facts about the system are discovered, the chosen null model may have to be adapted.
Throughout the paper, we emphasized the importance of these considerations for understanding metabolic systems as our main case study. However, a proper treatment of the cross-talk among various topological properties of complex networks (and in particular, an evaluation of larger-scale properties influencing subgraph statistics) has a much broader range of application. We thus believe that this small catalogue of topological features influencing the interpretation of subgraph counts in complex networks can be used for refining and correcting empirical observations of TSPs and also as starting points to expand our theoretical understanding of the crosstalk between different topological properties of complex networks.
Acknowledgments
M.T.H. and M.M.H. acknowledge support from Volkswagen Foundation (grant nos I/82 717 and I/83435). M.E.B. and C.F. are supported by Deutsche Forschungsgemeinschaft grants to MTH (grant nos HU-937/6 and HU-937/7).
Footnotes
The database changed its name and location to ERGO, see https://ergo.integratedgenomics.com/
References
- 1.Milo R., Shen-Orr S., Itzkovitz S., Kashtan N., Chklovskii D., Alon U. 2002. Network motifs: simple building blocks of complex networks. Science 298, 824–827 10.1126/science.298.5594.824 (doi:10.1126/science.298.5594.824) [DOI] [PubMed] [Google Scholar]
- 2.Milo R., Itzkovitz S., Kashtan N., Levitt R., Shen-Orr S., Ayzenshtat I., Sheffer M., Alon U. 2004. Superfamilies of evolved and designed networks. Science 303, 1538–1542 10.1126/science.1089167 (doi:10.1126/science.1089167) [DOI] [PubMed] [Google Scholar]
- 3.Shen-Orr S. S., Milo R., Mangan S., Alon U. 2002. Network motifs in the transcriptional regulation network of Escherichia coli. Nat. Genet. 31, 64–68 10.1038/ng881 (doi:10.1038/ng881) [DOI] [PubMed] [Google Scholar]
- 4.Alon U. 2007. Network motifs: theory and experimental approaches. Nat. Rev. Genet. 8, 450–461 10.1038/nrg2102 (doi:10.1038/nrg2102) [DOI] [PubMed] [Google Scholar]
- 5.Konagurthu A., Lesk A. 2008. On the origin of distribution patterns of motifs in biological networks. BMC Syst. Biol. 2, 73. 10.1186/1752-0509-2-73 (doi:10.1186/1752-0509-2-73) [DOI] [PMC free article] [PubMed] [Google Scholar]
- 6.Artzy-Randrup Y., Fleishman S. J., Ben-Tal N., Stone L. 2004. Comment on ‘network motifs: simple building blocks of complex networks’ and ‘superfamilies of evolved and designed networks’. Science 305, 1107. 10.1126/science.1099334 (doi:10.1126/science.1099334) [DOI] [PubMed] [Google Scholar]
- 7.Mazurie A., Bottani S., Vergassola M. 2005. An evolutionary and functional assessment of regulatory network motifs. Genome Biol. 6, R35. 10.1186/gb-2005-6-4-r35 (doi:10.1186/gb-2005-6-4-r35) [DOI] [PMC free article] [PubMed] [Google Scholar]
- 8.Ginoza R., Mugler A. 2010. Network motifs come in sets: correlations in the randomization process. Phys. Rev. E 82, 011921. 10.1103/PhysRevE.82.011921 (doi:10.1103/PhysRevE.82.011921) [DOI] [PubMed] [Google Scholar]
- 9.Berger A., Müller-Hannemann M. 2010. Uniform sampling of digraphs with a fixed degree sequence. In Graph theoretic concepts in computer science (ed. Thilikos D.). Lecture Notes in Computer Science, no. 6410, pp. 220–231 Heidelberg, Germany: Springer [Google Scholar]
- 10.Birmelé E. 2012. Detecting local network motifs. Electronic J. Stat. 6, 908–933 10.1214/12-EJS698 (doi:10.1214/12-EJS698) [DOI] [Google Scholar]
- 11.Girvan M., Newman M. E. J. 2002. Community structure in social and biological networks. Proc. Natl Acad. Sci. USA 99, 7821–7826 10.1073/pnas.122653799 (doi:10.1073/pnas.122653799) [DOI] [PMC free article] [PubMed] [Google Scholar]
- 12.Newman M. E. J., Girvan M. 2004. Finding and evaluating community structure in networks. Phys. Rev. E 69, 026113. 10.1103/PhysRevE.69.026113 (doi:10.1103/PhysRevE.69.026113) [DOI] [PubMed] [Google Scholar]
- 13.Guimerà R., Sales-Pardo M., Amaral L. A. N. 2004. Modularity from fluctuations in random graphs and complex networks. Phys. Rev. E 70, 25101. 10.1103/PhysRevE.70.025101 (doi:10.1103/PhysRevE.70.025101) [DOI] [PMC free article] [PubMed] [Google Scholar]
- 14.Guimerà R., Sales-Pardo M., Amaral L. A. N. 2007. Module identification in bipartite and directed networks. Phys. Rev. E 76, 036102. 10.1103/PhysRevE.76.036102 (doi:10.1103/PhysRevE.76.036102) [DOI] [PMC free article] [PubMed] [Google Scholar]
- 15.Barabási A.-L., Ravasz E., Vicsek T. 2001. Deterministic scale-free networks. Phys. A Stat. Mech. Appl. 299, 559–564 10.1016/S0378-4371(01)00369-7 (doi:10.1016/S0378-4371(01)00369-7) [DOI] [Google Scholar]
- 16.Jung S., Kim S., Kahng B. 2002. Geometric fractal growth model for scale-free networks. Phys. Rev. E 65, 056101. 10.1103/PhysRevE.65.056101 (doi:10.1103/PhysRevE.65.056101) [DOI] [PubMed] [Google Scholar]
- 17.Dorogovtsev S. N., Goltsev A. V., Mendes J. F. F. 2002. Pseudofractal scale-free web. Phys. Rev. E 65, 066122. 10.1103/PhysRevE.65.066122 (doi:10.1103/PhysRevE.65.066122) [DOI] [PubMed] [Google Scholar]
- 18.Vázquez A., Pastor-Satorras R., Vespignani A. 2002. Large-scale topological and dynamical properties of the internet. Phys. Rev. E 65, 066130. 10.1103/PhysRevE.65.066130 (doi:10.1103/PhysRevE.65.066130) [DOI] [PubMed] [Google Scholar]
- 19.Ravasz E., Barabási A. 2003. Hierarchical organization in complex networks. Phys. Rev. E 67, 026112. 10.1103/PhysRevE.67.026112 (doi:10.1103/PhysRevE.67.026112) [DOI] [PubMed] [Google Scholar]
- 20.Newman M. E. 2003. The structure and function of complex networks. SIAM Rev. 45, 167–256 10.1137/S003614450342480 (doi:10.1137/S003614450342480) [DOI] [Google Scholar]
- 21.Callaway D. S., Hopcroft J. E., Kleinberg J. M., Newman M. E. J., Strogatz S. H. 2001. Are randomly grown graphs really random? Phys. Rev. E 64, 041902. 10.1103/PhysRevE.64.041902 (doi:10.1103/PhysRevE.64.041902) [DOI] [PubMed] [Google Scholar]
- 22.Newman M. E. J. 2002. Assortative mixing in networks. Phys. Rev. Lett. 89, 208701. 10.1103/PhysRevLett.89.208701 (doi:10.1103/PhysRevLett.89.208701) [DOI] [PubMed] [Google Scholar]
- 23.Jamakovic A., Mahadevan P., Vahdat A., Boguna M., Krioukov D. How small are building blocks of complex networks? (http://arxiv.org/abs/0908.1143) [Google Scholar]
- 24.Vazquez A., Dobrin R., Sergi D., Eckmann J. P., Oltvai Z., Barabási A. L. 2004. The topological relationship between the large-scale attributes and local interaction patterns of complex networks. Proc. Natl Acad. Sci. USA 101, 17 940–17 945 10.1073/pnas.0406024101 (doi:10.1073/pnas.0406024101) [DOI] [PMC free article] [PubMed] [Google Scholar]
- 25.Holme P., Zhao J. 2007. Exploring the assortativity-clustering space of a network's degree sequence. Phys. Rev. E 75, 046111. 10.1103/PhysRevE.75.046111 (doi:10.1103/PhysRevE.75.046111) [DOI] [PubMed] [Google Scholar]
- 26.Ingram P., Stumpf M., Stark J. 2006. Network motifs: structure does not determine function. BMC Genomics 7, 108. 10.1186/1471-2164-7-108 (doi:10.1186/1471-2164-7-108) [DOI] [PMC free article] [PubMed] [Google Scholar]
- 27.Avetisov V., Nechaev S., Shkarin A. 2010. On the motif distribution in random block-hierarchical networks. Phys. A Stat. Mech. Appl. 389, 5895–5902 10.1016/j.physa.2010.09.016 (doi:10.1016/j.physa.2010.09.016) [DOI] [Google Scholar]
- 28.Varma A., Palsson B. O. 1994. Metabolic flux balancing: basic concepts, scientific and practical use. Nat. Biotechnol. 12, 994–998 10.1038/nbt1094-994 (doi:10.1038/nbt1094-994) [DOI] [Google Scholar]
- 29.Del Genio C. I., Kim H., Toroczkai Z., Bassler K. E. 2010. Efficient and exact sampling of simple graphs with given arbitrary degree sequence. PLoS ONE 5, e10012. 10.1371/journal.pone.0010012 (doi:10.1371/journal.pone.0010012) [DOI] [PMC free article] [PubMed] [Google Scholar]
- 30.McKay B., Wormald N. C. 1990. Uniform generation of random regular graphs of moderate degree. J. Algorithms 11, 52–67 [Google Scholar]
- 31.McKay B., Wormald N. C. 1991. Asymptotic enumeration by degree sequence of graphs with degrees o(n1/2). Combinatorica 11, 369–382 10.1007/BF01275671 (doi:10.1007/BF01275671) [DOI] [Google Scholar]
- 32.Cooper C., Dyer M., Greenhill C. 2007. Sampling regular graphs and a peer-to-peer network. Comb. Probab. Comput. 16, 557–593 10.1017/S0963548306007978 (doi:10.1017/S0963548306007978) [DOI] [Google Scholar]
- 33.Bayati M., Kim J. H., Saberi A. 2010. A sequential algorithm for generating random graphs. Algorithmica 58, 860–910 10.1007/s00453-009-9340-1 (doi:10.1007/s00453-009-9340-1) [DOI] [Google Scholar]
- 34.Itzkovitz S., Milo R., Kashtan N., Ziv G., Alon U. 2003. Subgraphs in random networks. Phys. Rev. E 68, 026127. 10.1103/PhysRevE.68.026127 (doi:10.1103/PhysRevE.68.026127) [DOI] [PubMed] [Google Scholar]
- 35.Wernicke S. 2005. FANMOD: a tool for fast network motif detection. Bioinformatics 22, 1152–1153 10.1093/bioinformatics/btl038 (doi:10.1093/bioinformatics/btl038) [DOI] [PubMed] [Google Scholar]
- 36.Schreiber F., Schwöbbermeyer H. 2005. MAVisto: a tool for the exploration of network motifs. Bioinformatics 21, 3572–3574 10.1093/bioinformatics/bti556 (doi:10.1093/bioinformatics/bti556) [DOI] [PubMed] [Google Scholar]
- 37.Batagelj V., Mrvar A. 2001. A subquadratic triad census algorithm for large sparse networks with small maximum degree. Soc. Netw. 23, 237–243 10.1016/S0378-8733(01)00035-1 (doi:10.1016/S0378-8733(01)00035-1) [DOI] [Google Scholar]
- 38.Fretter C., Müller-Hannemann M., Hütt M. T. 2012. Subgraph fluctuations in random graphs. Phys. Rev. E 85, 056119. 10.1103/PhysRevE.85.056119 (doi:10.1103/PhysRevE.85.056119) [DOI] [PubMed] [Google Scholar]
- 39.Albert R. 2005. Scale-free networks in cell biology. J. Cell Sci. 118, 4947–4957 10.1242/jcs.02714 (doi:10.1242/jcs.02714) [DOI] [PubMed] [Google Scholar]
- 40.Zhou W., Nakhleh L. 2011. Properties of metabolic graphs: biological organization or representation artifacts? BMC Bioinf. 12, 132. 10.1186/1471-2105-12-132 (doi:10.1186/1471-2105-12-132) [DOI] [PMC free article] [PubMed] [Google Scholar]
- 41.Papp B., Teusink B., Notebaart R. A. 2009. A critical view of metabolic network adaptations. HFSP J. 3, 24–35 10.2976/1.3020599 (doi:10.2976/1.3020599) [DOI] [PMC free article] [PubMed] [Google Scholar]
- 42.Basler G., Grimbs S., Ebenhöh O., Selbig J., Nikoloski Z. 2011. Evolutionary significance of metabolic network properties. J. R. Soc. Interface 9, 1168–1176 (doi:10.1098/rsif.2011.0652) [DOI] [PMC free article] [PubMed] [Google Scholar]
- 43.Jeong H., Tombor B., Albert R., Oltvai Z. N., Barabasi A. 2000. The large-scale organization of metabolic networks. Nature 407, 651–654 10.1038/35036627 (doi:10.1038/35036627) [DOI] [PubMed] [Google Scholar]
- 44.Wagner A., Fell D. A. 2001. The small world inside large metabolic networks. Proc. R. Soc. Lond. B 268, 1803–1810 10.1098/rspb.2001.1711 (doi:10.1098/rspb.2001.1711) [DOI] [PMC free article] [PubMed] [Google Scholar]
- 45.Montanez R., Medina M. A., Solé R. V., Rodríguez-Caso C. 2010. When metabolism meets topology: reconciling metabolite and reaction networks. BioEssays 32, 246–256 10.1002/bies.200900145 (doi:10.1002/bies.200900145) [DOI] [PubMed] [Google Scholar]
- 46.Eom Y., Lee S., Jeong H. 2006. Exploring local structural organization of metabolic networks using subgraph patterns. J. Theor. Biol. 241, 823–829 10.1016/j.jtbi.2006.01.018 (doi:10.1016/j.jtbi.2006.01.018) [DOI] [PubMed] [Google Scholar]
- 47.Basler G., Ebenhöh O., Selbig J., Nikoloski Z. 2011. JMassBalance: mass-balanced randomization of metabolic networks. Bioinformatics 27, 1397–1403 10.1093/bioinformatics/btr145 (doi:10.1093/bioinformatics/btr145) [DOI] [PMC free article] [PubMed] [Google Scholar]
- 48.Riehl W. J., Krapivsky P. L., Redner S., Segrè D. 2010. Signatures of arithmetic simplicity in metabolic network architecture. PLoS Comput. Biol. 6, e1000725. 10.1371/journal.pcbi.1000725 (doi:10.1371/journal.pcbi.1000725) [DOI] [PMC free article] [PubMed] [Google Scholar]
- 49.Ma H., Zeng A. 2003. The connectivity structure, giant strong component and centrality of metabolic networks. Bioinformatics 19, 1423–1430 10.1093/bioinformatics/btg177 (doi:10.1093/bioinformatics/btg177) [DOI] [PubMed] [Google Scholar]
- 50.Feist A. M., Henry C. S., Reed J. L., Krummenacker M., Joyce A. R., Karp P. D., Broadbelt L. J., Hatzimanikatis V., Palsson B. Ø. 2007. A genome-scale metabolic reconstruction for Escherichia coli K-12 MG1655 that accounts for 1260 ORFs and thermodynamic information. Mol. Syst. Biol. 3, 121. 10.1038/msb4100155 (doi:10.1038/msb4100155) [DOI] [PMC free article] [PubMed] [Google Scholar]
- 51.Sonnenschein N., Geertz M., Muskhelishvili G., Hütt M. T. 2011. Analog regulation of metabolic demand. BMC Syst. Biol. 5, 40. 10.1186/1752-0509-5-40 (doi:10.1186/1752-0509-5-40) [DOI] [PMC free article] [PubMed] [Google Scholar]
- 52.Latapy M., Magnien C., Vecchio N. D. 2008. Basic notions for the analysis of large two-mode networks. Soc. Netw. 30, 31–48 10.1016/j.socnet.2007.04.006 (doi:10.1016/j.socnet.2007.04.006) [DOI] [Google Scholar]
- 53.Ravasz E., Somera A. L., Monaru D. A., Oltvai Z. N., Barabási A. 2002. Hierarchical organization of modularity in metabolic networks. Science 297, 1551–1555 10.1126/science.1073374 (doi:10.1126/science.1073374) [DOI] [PubMed] [Google Scholar]
- 54.Guimera R., Amaral L. 2005. Functional cartography of complex metabolic networks. Nature 433, 895–900 10.1038/nature03288 (doi:10.1038/nature03288) [DOI] [PMC free article] [PubMed] [Google Scholar]
- 55.Samal A., Singh S., Giri V., Krishna S., Raghuram N., Jain S. 2006. Low degree metabolites explain essential reactions and enhance modularity in biological networks. BMC Bioinformatics 7, 118. 10.1186/1471-2105-7-118 (doi:10.1186/1471-2105-7-118) [DOI] [PMC free article] [PubMed] [Google Scholar]
- 56.Fortunato S. 2010. Community detection in graphs. Phys. Rep. 486, 75–174 10.1016/j.physrep.2009.11.002 (doi:10.1016/j.physrep.2009.11.002) [DOI] [Google Scholar]
- 57.Jeong H. 2009. Analysis of E. coli network. In Systems biology and biotechnology of Escherichia coli (ed. Lee S.Y.), pp. 113–132 The Netherlands: Springer [Google Scholar]
- 58.Chang X., Wang Z., Hao P., Li Y., Li Y. 2010. Exploring mitochondrial evolution and metabolism organization principles by comparative analysis of metabolic networks. Genomics 95, 339–344 10.1016/j.ygeno.2010.03.006 (doi:10.1016/j.ygeno.2010.03.006) [DOI] [PubMed] [Google Scholar]
- 59.Kaluza P., Vingron M., Mikhailov A. S. 2008. Self-correcting networks: function, robustness, and motif distributions in biological signal processing. Chaos 18, 026113. [DOI] [PubMed] [Google Scholar]
- 60.Mangan S., Alon U. 2003. Structure and function of the feed-forward loop network motif. Proc. Natl Acad. Sci. USA 100, 11 980–11 985 10.1073/pnas.2133841100 (doi:10.1073/pnas.2133841100) [DOI] [PMC free article] [PubMed] [Google Scholar]
- 61.Kaplan S., Bren A., Dekel E., Alon U. 2008. The incoherent feed-forward loop can generate non-monotonic input functions for genes. Mol. Syst. Biol. 4, 203. 10.1038/msb.2008.43 (doi:10.1038/msb.2008.43) [DOI] [PMC free article] [PubMed] [Google Scholar]
- 62.Krumov L., Fretter C., Müller-Hannemann M., Weihe K., Hütt M. T. 2011. Motifs in co-authorship networks and their relation to the impact of scientific publications. Eur. Phys. J. B 84, 535–540 10.1140/epjb/e2011-10746-5 (doi:10.1140/epjb/e2011-10746-5) [DOI] [Google Scholar]
- 63.Marr C., Theis F. J., Liebovitch L. S., Hütt M. 2010. Patterns of subnet usage reveal distinct scales of regulation in the transcriptional regulatory network of Escherichia coli. PLoS Comput. Biol. 6, e1000836. 10.1371/journal.pcbi.1000836 (doi:10.1371/journal.pcbi.1000836) [DOI] [PMC free article] [PubMed] [Google Scholar]
- 64.Sonnenschein N., Marr C., Hütt M. T. Submitted A topological characterization of medium-dependent essential metabolic reactions. Metabolites. [DOI] [PMC free article] [PubMed] [Google Scholar]
- 65.Price N. D., Reed J. L., Palsson B. Ø. 2004. Genome-scale models of microbial cells: evaluating the consequences of constraints. Nat. Rev. Microbiol. 2, 886–897 10.1038/nrmicro1023 (doi:10.1038/nrmicro1023) [DOI] [PubMed] [Google Scholar]
- 66.Klemm K., Bornholdt S. 2005. Topology of biological networks and reliability of information processing. Proc. Natl Acad. Sci. USA 102, 18 414–18 419 10.1073/pnas.0509132102 (doi:10.1073/pnas.0509132102) [DOI] [PMC free article] [PubMed] [Google Scholar]
- 67.Kittisopikul M., Süel G. M. 2010. Biological role of noise encoded in a genetic network motif. Proc. Natl Acad. Sci. USA 107, 13 300–13 305 10.1073/pnas.1003975107 (doi:10.1073/pnas.1003975107) [DOI] [PMC free article] [PubMed] [Google Scholar]


