Abstract
For dental implants, it is vital that an initial soft tissue seal is achieved as this helps to stabilize and preserve the peri-implant tissues during the restorative stages following placement. The study of the implant–soft tissue interface is usually undertaken in animal models. We have developed an in vitro three-dimensional tissue-engineered oral mucosal model (3D OMM), which lends itself to the study of the implant–soft tissue interface as it has been shown that cells from the three-dimensional OMM attach onto titanium (Ti) surfaces forming a biological seal (BS). This study compares the quality of the BS achieved using the three-dimensional OMM for four types of Ti surfaces: polished, machined, sandblasted and anodized (TiUnite). The BS was evaluated quantitatively by permeability and cell attachment tests. Tritiated water (HTO) was used as the tracing agent for the permeability test. At the end of the permeability test, the Ti discs were removed from the three-dimensional OMM and an Alamar Blue assay was used for the measurement of residual cells attached to the Ti discs. The penetration of the HTO through the BS for the four types of Ti surfaces was not significantly different, and there was no significant difference in the viability of residual cells that attached to the Ti surfaces. The BS of the tissue-engineered oral mucosa around the four types of Ti surface topographies was not significantly different.
Keywords: permeability, tissue-engineered oral mucosa, implant–soft tissue interface, biological seal, three-dimensional in vitro model
1. Introduction
The soft tissue providing the biological seal (BS) around implants has a number of features in common with the soft tissue attached to teeth [1,2]. The clinical importance of the BS around the implant has been identified as a dominant factor to determine the long-term success of peri-implant health [3,4]. However, it has been suggested that the quality of the BS of peri-implant tissue is weaker than that of the junctional epithelium on the natural teeth [1,5,6]. This could be due to the attachment of the non-keratinized peri-implant epithelium (PIE) onto the implant surface via the internal basal lamina, hemidesmosomes [5,7] being limited to the apical region of the PIE [5]. In addition, the orientation of the peri-implant connective tissue collagen fibres, which are mainly in a circular or oblique direction to the implant surface [8,9], forms a weaker barrier compared with the Sharphey's fibres that attach perpendicular to the tooth surface [10].
The description of the quality of the BS of the peri-implant mucosa (PIM) has been based on histomorphometric features observed in animal models [1,2,5,6,8,9]. For example, an animal study by Ikeda [6] evaluated qualitatively the BS around implants by tracing the penetration of horseradish peroxidase through the peri-implant tissue interface using light and transmission electron microscopy [6]. However, the literature relating to quantification of the BS of the PIM is very limited.
In contrast, when using an in vitro cell culture model, more quantitative information can be extracted, such as cell proliferation [11], cell activity [12,13] and cell adhesive strength [3,13]. However, the cell culture models used currently are primarily based on two-dimensional monolayer cell culture systems, which are known to have several limitations such as a lack of polarized cell phenotype and cell–cell contacts, as well as poor cell differentiation [14,15].
We have developed and optimized an in vitro three-dimensional oral mucosal model (3D OMM) for biological evaluation of dental materials and oral healthcare products [16–18] and more recently have modified it into a transmucosal implant model for the investigation of the implant–soft tissue interface [7,19]. The three-dimensional transmucosal model is a tissue-engineered oral mucosa equivalent (OME) consisting of both epithelium and connective tissue layers. This OME is able to form a peri-implant-like epithelium attached to titanium (Ti) surfaces similar to the peri-implant epithelium structure seen in animal models. To our knowledge, the BS of the soft tissue around implant surfaces with variable roughnesses has not been investigated using permeability and attachment tests in a three-dimensional in vitro model. Hence, the aim of this study was to evaluate quantitatively the effectiveness of the BS for four types of Ti surface topographies using an in vitro three-dimensional OMM.
2. Material and methods
2.1. Construction of the three-dimensional oral mucosal model
Ethical approval was obtained from the Institutional Review Board to carry out this study. An acellular cadaveric dermis (Alloderm, LifeCell Corporation, Branchburg, USA) was used as a scaffold and was placed in a 12-mm diameter insert (BIOCOAT Cell Environments, Becton Dickinson Labware, Bedford, UK). The three-dimensional OMM was constructed by co-culturing both oral keratinocyte cell line (TR146 from Cancer Research UK) and human gingival fibroblasts (HF) (passage 2–4) at a density of 0.5 × 10⁶ ml−1 each onto the basement membrane side of the acellular scaffold. The model was cultured in complete Dulbecco's modified Eagle's medium (DMEM) containing 50 U ml−1 penicillin, 50 U ml−1 streptomycin, 625 ng ml−1 fungizone (Sigma-Aldrich, Dorset, UK) and 10 per cent foetal calf serum (Biowest, East Sussex, UK). The model was incubated in an atmosphere of 95 per cent air/5 per cent carbon dioxide (Galaxy R, Scientific Laboratory Supplies Ltd, East Riding, Yorkshire, UK) at 37°C. On the 4th day of the culture, a 4-mm disposable tissue biopsy punch (Stiefel Laboratories Ltd, UK) was used to make a hole in the middle of the model. A 5-mm diameter × 2.5-mm height Ti disc was then inserted into the hole. The OME was clamped between the two components of the insert to form a seal at the periphery of the OME. This model was further cultured in a submerged condition with complete DMEM for another 6 days. It was left at an almost air–liquid interface in the last 2–3 days of the culture period.
2.2. Ti disc preparation
Four types of Ti surface topographies were tested: polished, machined, sandblasted and anodized surfaces. The polished, machined and sandblasted Ti surfaces were prepared in-house from a grade IV 5-mm diameter Ti rod (a gift from Nobel Biocare), while the anodized (TiUnite) surface discs were provided by Nobel Biocare. The Ti rods were polished with silicon carbide papers (Struers, Gothenburg, Sweden) in the following sequence before being cut into a disc:
— polished Ti rod: P240–P400–P600–P800–P1200—diamond paste of 6 µm and 1 µm particle size on polishing cloths;
— machined Ti rod: P240–P400–P800;
— sandblasted Ti rod: P240–P400–P800—sandblasted in a grit blasting machine (Renfert, Vario Jet) using 70 µm aluminium oxide (alumina) powder; and
— anodized (TiUnite) discs were prepared by the manufacturer (Nobel Biocare Holding AG, Zürich-Flughafen, Switzerland).
The surface topography of the four types of Ti surfaces was evaluated by a scanning electron microscope (SEM) (Leo Ultra 55 FEG, Leo Electron Microscopy Ltd, Cambridge, UK). The Ti surface roughness parameters were obtained with a light interferometer (Wyko NT1100, Veeco Instruments Inc., Tucson, USA). The surface roughness was measured as Sa values (the average of height in micrometres deviated from the mean plane) [20] and Sdr values (known as the developed surface area ratio, representing the ratio as a percentage between the real surface area measured and a hypothetical entirely flat area) [20].
2.3. Permeability test
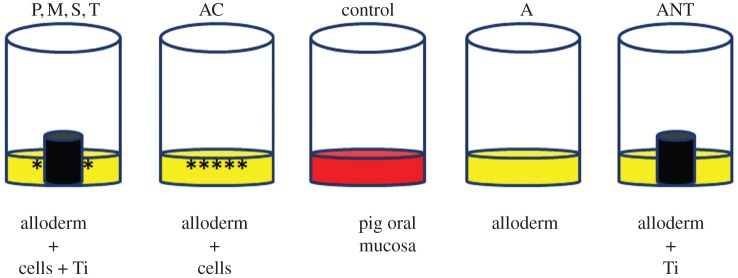
The permeability test was carried out at the end of the 10-day culture period. Figure 1 summarizes the test groups (n = 6).
Figure 1.
Schematic summarizing the test groups for the permeability test. P, polished; M, machined; S, sandblasted; T, anodized (TiUnite); AC, alloderm with cells; A, alloderm without cells; ANT, alloderm without cells +Ti; control, pig oral mucosa. (Online version in colour.)
Groups with cells:
— OME with a polished Ti disc (P);
— OME with a machined Ti disc (M);
— OME with a sandblasted Ti disc (S);
— OME with an anodized (TiUnite) Ti disc (T);
— acellular dermis with cells (AC); and
— pig oral mucosa (control).
Groups without cells:
— acellular dermis without cells (A); and
— acellular dermis without cells but with a Ti disc (ANT)—this group was set up in the same way as test group (ii), i.e. a Ti disc (machined surface) was inserted into the model on the 4th day and further cultured for another 6 days.
Except for the control group, all the groups were cultured for 10 days prior to the permeability experiment. The pig's oral mucosa was biopsied from the lingual alveolar mucosa on the experimental day. A thin layer of cyanoacrylate adhesive was applied at the periphery of the pig's mucosa to form a peripheral seal in the insert.
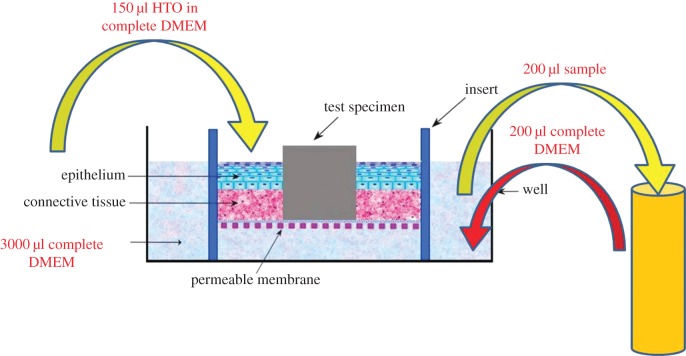
Radioactive HTO (Water, [3H] PerkinElmer Health Sciences Inc., Boston, MA, USA) was used as a tracing agent to evaluate the permeability of the model. The permeability test was performed at room temperature on the inserts, which were placed in a six-well plate. The medium in the insert was removed and then transferred to a new six-well plate containing 3 ml of new complete DMEM in each well. Then, an aliquot of 150 µl of 2 µCi ml−1 HTO was inoculated into each insert. A 200 µl sample of HTO that had penetrated through the models into the well below was obtained at 30 min, 1, 1.5, 2 and 3 h. Immediately after each sampling, an aliquot of 200 µl complete DMEM was added in order to maintain the level of medium in the well (figure 2). The samples were mixed with 2.5 ml scintillation cocktail (Emulsifier Safe, Packard Instrument Company, Meriden, CT, USA) and the radioactivity of the samples was counted using a liquid scintillation counter (Scintillation system LS6500, Beckman Counter Inc., Analytical Instrument Systems Development Center, Fullerton, CA, USA).
Figure 2.
Schematic of the procedures done in the permeability test. A 150 µl of radioactive water (HTO) was inoculated into the three-dimensional OMM. A sample of 200 µl of HTO that had penetrated through the models were collected after 30 min, 1, 1.5, 2 and 3 h. (Online version in colour.)
The raw data obtained from the scintillation counter were the amount of the radioactivity of HTO in counts per minute that has penetrated through the OME model. These data were obtained at five exposure times, and labelled as r1–r5 (table 1). As some radioactivity was removed during each sampling at each time interval, this was compensated for by adding the removed radioactivity to the corresponding raw data at each time point and labelled as a1–a5. Thus, a1 has the same value as r1, which is the first sample obtained, while a2 has the total radioactivity collected at 1 h exposure time by adding the r1 (30 min) with r2 (60 min), providing the accumulated count (table 1). The percentage of the HTO that had penetrated through the model was also calculated and labelled as Pa1–Pa5 (table 1). Based on Fick's first law of diffusion, steady-state flux (Jss) [21] was calculated using the following formula.
Table 1.
A summary of the data calculation. r1–r5 = raw data, a1–a5 = added raw data values, Pa1–Pa5 = percentage of leaking, at 30, 60, 90, 120 and 180 min, respectively. Co, the original radioactivity of 150 µl HTO in the insert; Jx, the steady-state flux value for Ti (P, M, S, T) and ANT groups, in which the surface area of the Ti disc was deducted from the total surface area of the oral mucosa equivalent; t, time of exposure.
| data presentation (unit) | data calculation for five exposure times |
|---|---|
| raw data, r (cpm) | r1 = radioactivity count at 30 min |
| r2 = radioactivity count at 60 min | |
| r3 = radioactivity count at 90 min | |
| r4 = radioactivity count at 120 min | |
| r5 = radioactivity count at 180 min | |
| added raw data, a (cpm) | a1 = r1 |
| a2 = r1 + r2 | |
| a3 = r1 + r2 + r3 | |
| a4 = r1 + r2 + r3 + r4 | |
| a5 = r1 + r2 + r3 + r4 + r5 | |
| percentage of leaking, Pa (%) | Pa1 = a1/Co × 100 |
| Pa2 = a2/Co × 100 | |
| Pa3 = a3/Co × 100 | |
| Pa4 = a4/Co × 100 | |
| Pa5 = a5/Co × 100 | |
| steady-state flux, Jss (cpm cm−2 min−1) | J1 = a1/[(22/7 × 0.6 × 0.6) × 30] |
| J2 = a2/[(22/7 × 0.6 × 0.6) × 60] | |
| J3 = a3/[(22/7 × 0.6 × 0.6) × 90] | |
| J4 = a4/[(22/7 × 0.6 × 0.6) × 120] | |
| J5 = a5/[(22/7 × 0.6 × 0.6) × 180] | |
| *Jx = a1/[(22/7 × 0.6 × 0.6) − (22/7 × 0.25 × 0.25) × t] |
where Q is the radioactivity of HTO penetrating through the model (counts per minute, cpm), A is area of exposed tissue (cm2) [π × radius2] and t = exposure time (min). The unit of Jss is cpm cm−2 min−1. The mean differences of the permeability (Jss) for the eight test groups at five exposure times were analysed using analysis of variance (ANOVA), Tukey's post hoc test at p-value less than 0.05.
2.4. Attachment test
At the end of the permeability tests, the models were washed three times with PBS to remove the radioactive HTO. Subsequently, the Ti discs were gently pulled out from the OME and incubated in 10 per cent Alamar Blue (Biosource, Camarilo, CA, USA) in a 24-well plate. The Alamar Blue assay measured the viability of residual cells that remained attached to the Ti discs. The fluorescence intensity was measured at 530 nm excitation wavelength and 590 nm emission wavelength using a microplate reader (Infinite 200, Tecan Group Ltd, Switzerland).
In order to confirm the presence of cells that were still attached to the Ti discs, the Ti discs were processed for SEM examination. After the Alamar Blue assay, the discs were fixed in 2.5 per cent glutaraldehyde for 2 days, post-fixed in 1 per cent OSO4 for 2 h and then dehydrated in a series of ascending ethanol concentrations and critical-point dried. Finally, the discs were sputter coated with gold before being examined under the SEM.
After the removal of the Ti discs, the OMEs were processed for histological examination to confirm the presence of the epithelium layer. The correlation between the Alamar Blue assay in the attachment test and the Jss values in the permeability test was analysed using the bivariate Pearson correlation test.
2.5. Monolayer cell culture test
In order to determine the affinity of cells attached to different surface topographies, a monolayer cell culture model was set up. A mixture of TR146 and HF at 0.025 × 10⁶ ml−1 density each was first co-cultured in a 24-well plate. The cells were incubated in complete DMEM at 37°C. After they became confluent (fourth day), four types of Ti discs (six samples each) were placed onto the confluent 24-well plate and cultured for 2 days. As before, the four types of Ti discs tested had a polished, machined, sandblasted or anodized surface. After 2-day of culture, the viability of the cells that had attached to the Ti surfaces was analysed using Alamar Blue assay.
3. Results
3.1. Histological features of the oral mucosal equivalents
Figure 3 shows a histological section of the OME. In all the samples used in the permeability test, the OME consisted of a 50–100 µm thick, well-formed, stratified squamous epithelium of four to six layers of epithelial cells (figure 3b). This confirmed that an intact oral epithelium was formed in the OME. However, at the interface area, the peri-implant-like epithelium was disturbed due to the removal of the Ti disc from the OME (figure 3a). Also, it was found that at the clamped site of the OME, the epithelial layer was not intact (figure 3a).
Figure 3.
Haematoxylin and eosin staining of a cell line oral mucosal equivalent (OME) after the removal of Ti disc at the end of the permeability test. (a) The epithelium layer at the interface was disturbed after the removal of the Ti disc. An incomplete epithelium layer was noticed at the clamped site of the OME. (b) A well-formed four to six layers of stratified squamous epithelium on the OME was noted. (Online version in colour.)
3.2. Characterization of titanium discs
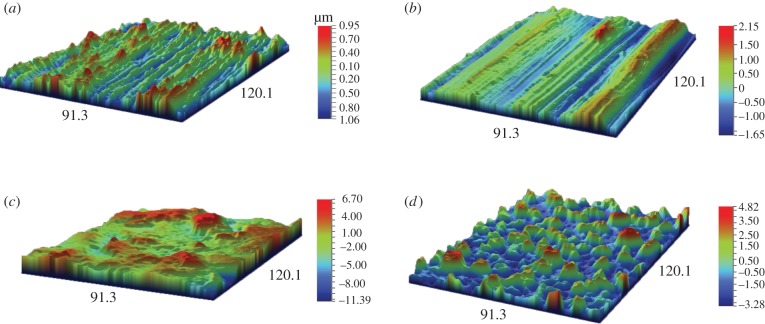
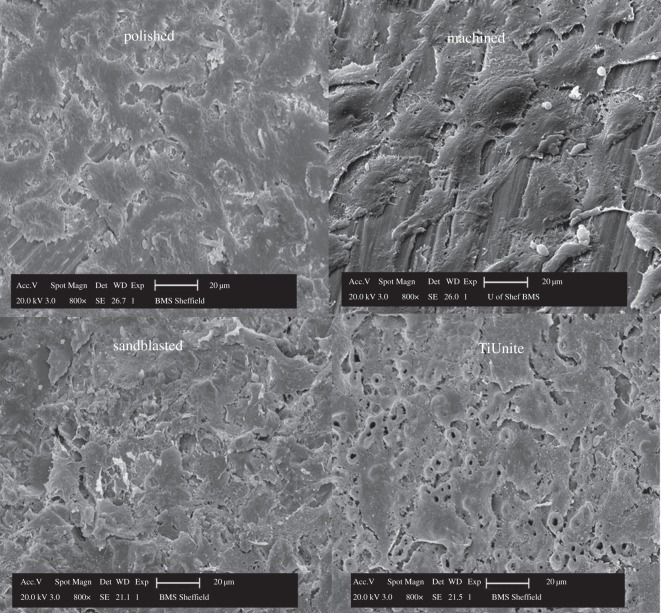
The images of the surface topography for the four types of Ti discs, i.e. polished, machined, sandblasted and anodized, obtained with light interferometry and SEM are shown in figures 4 and 5, respectively. Both the polished and machined Ti discs had obvious anisotropic features, i.e. a well-defined orientation of the surface topography, whereas the sandblasted and anodized surfaces have an isotropic structure, i.e. without any dominant direction. The anodized surface is characterized by numerous pores or ‘volcanos’ measuring from 1 to 10 µm in diameter as shown in figure 5.
Figure 4.
A light interferometry micrograph showing the surface topography of the four types of Ti surfaces. (a) Polished; (b) machined; (c) sandblasted and (d) TiUnite. Scale bar: (a) −1.06–0.95 µm, (b) −1.65–2.15 µm, (c) −11.39–6.70 µm, (d) −3.28–4.82 µm. (Online version in colour.)
Figure 5.
Scanning electron micrographs of the four types of Ti surface topographies. Note the anisotropic surface structure present in polished and machined groups, while isotropic feature in sandblasted and TiUnite groups.
The Sa values for the four types of Ti surface topographies, i.e. polished, machined, sandblasted and anodized (TiUnite), were 0.18, 0.50, 1.70 and 1.20 µm, respectively, whereas the values of Sdr were 8.63 per cent, 14.17 per cent, 114.86 per cent and 132.90 per cent, respectively.
3.3. Permeability and attachment tests
Table 2 shows the mean percentages of the permeability at five exposure times for the test groups. It was found at the end of the experiment (Pa5) that less than 20 per cent of the HTO had actually penetrated through the experimental models. The control group (pig oral mucosa) showed the lowest penetration of HTO throughout the five exposure times (p < 0.05), in which only 0.25 per cent of HTO having penetrated through the mucosa at the beginning (Pa1) and less than 5 per cent towards the end of exposure time (Pa5). In contrast, the ANT group showed the highest percentage of permeability (p < 0.05) throughout the 2 h exposure time (i.e. Pa1–Pa4), ranging from 2 to 12 per cent. In the other groups, the percentage of HTO that penetrated through the models was approximately 1–2% initially and 16 per cent at the end of the experiment.
Table 2.
The mean percentage of leaking at 30, 60, 90, 120 and 180 min (Pa1, Pa2, Pa3, Pa4 and Pa5, respectively); P, polished; M, machined; S, sandblasted; T, TiUnite or anodized; AC , alloderm with cells; A, alloderm without cells; ANT, alloderm without cells +Ti; control, pig oral mucosa.
| test group | means of percentage of leaking (%) |
||||
|---|---|---|---|---|---|
| Pa1 | Pa2 | Pa3 | Pa4 | Pa5 | |
| P | 1.32 | 4.02 | 7.51 | 11.04 | 15.05 |
| M | 1.36 | 4.08 | 7.55 | 11.20 | 15.33 |
| S | 1.53 | 4.15 | 7.45 | 11.23 | 15.46 |
| T | 1.46 | 4.20 | 7.61 | 11.04 | 15.04 |
| AC | 1.63 | 4.77 | 8.04 | 11.65 | 15.76 |
| pig oral mucosa | 0.25a | 0.80a | 1.77a | 3.00a | 4.75a |
| A | 1.78 | 4.70 | 7.83 | 11.31 | 15.23 |
| ANT | 2.22b | 5.21b | 8.54b | 12.06b | 15.87 |
aA significant lowest percentage of permeability in control group.
bA significant highest percentage of permeability in ANT group.
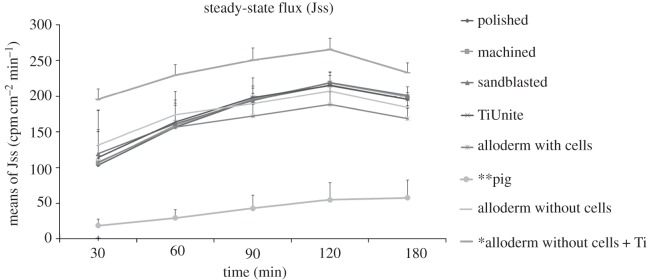
Figure 6 shows that the steady-state flux of all the test groups increased with time but decreased after 2 h. The control (pig oral mucosa) and the ANT groups had the lowest and highest steady-state flux, respectively, throughout the five exposure times and these differences were significant (p < 0.05).
Figure 6.
A line graph of the HTO permeability for eight test groups at five exposure times (n = 6). Note the highest permeability was observed in the model without cells but with Ti (ANT, single asterisk), while the lowest permeability was observed in the pig oral mucosa (double asterisks).
Figure 7 compares the means of the steady-state flux (Jss) of the eight groups at a 2 h exposure time and there was no significant difference between the four types of Ti surfaces. However, the Ti groups did have a significantly lower permeability than the ANT group (positive control group) and a higher permeability than the pig oral mucosa group (negative control group) (p < 0.05). Interestingly, no significant difference was observed between the Ti groups (P, M, S, T) and the OME (AC), which had an intact epithelium without a punch hole. This may indicate that the seal at the Ti–OME interface is as good as the OME (AC) itself. This finding suggests that without the presence of an epithelium attachment on the Ti surfaces as in the ANT group, the HTO penetrated easily through the gap at the interface. In contrast, when epithelium attachment is present, as on the Ti surfaces, this forms a barrier to the penetration of the HTO.
Figure 7.

Comparison of means of steady-state flux for eight groups after 2 h of exposure. P, polished; M, machined; S, sandblasted; T, anodized (TiUnite); AC, alloderm with cells; A, alloderm without cells; ANT, alloderm without cells +Ti; Pig, pig oral mucosa. The error bar represents 1 s.d. (n = 6). The Ti groups were statistically different compared with ANT (hash symbols) and Pig (asterisk; p < 0.05).
The results of the Alamar Blue assay are presented in figure 8, indicating the viability of cells that remained attached on the Ti surfaces after removal from the OME. There was no significant difference between the cells remaining attached for the four types of Ti surface topographies. It was also found that the permeability of HTO for the five exposure times did not correlate (p > 0.05) with the Alamar Blue assay (attachment test).
Figure 8.
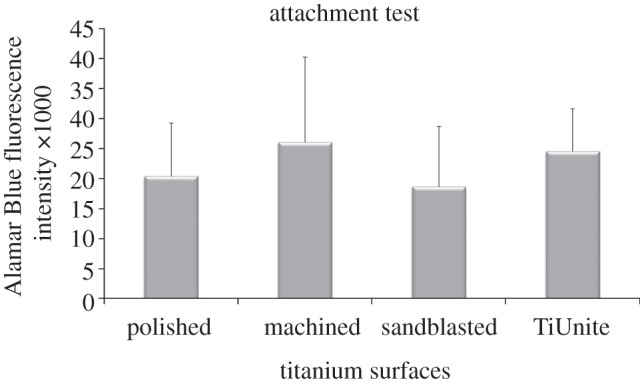
Alamar Blue assay of cells that remained attached to the Ti surface after its removal from the oral mucosal equivalent. The error bar represents 1 s.d. (n = 6).
3.4. Scanning electron microscopy
SEM examination of the Ti discs confirmed that there were cells attached to the Ti surfaces. The cells can be seen to have spread out to form a cell network on all the Ti surfaces (figure 9). This indicates that the cells of the OME formed an attachment to the Ti surfaces regardless of the surface roughness. It was also noted that the attached cells followed the shape of the underlying surface topography. For example, the cells appeared to be flat and spread out on the polished and machined surfaces, but were more irregular in shape on the sandblasted surface. It was somewhat difficult to identify the cells in the sandblasted group because of the irregular background of the surface topography (figure 9). On the anodized (TiUnite) surface, the cells grew over the ‘volcanoes’. A single cell, measuring approximately 20–30 µm, covered on an average of 8–10 ‘volcanoes’.
Figure 9.
Scanning electron micrographs of cell attachment on the four types of Ti surfaces after their removal from the oral mucosal equivalent.
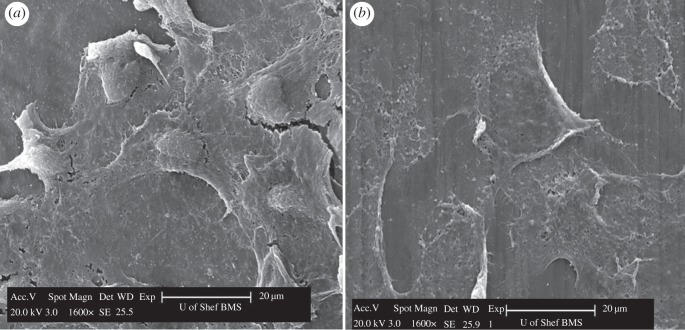
Interestingly, the cells attached to the Ti surfaces were found not only at the interface but also in the area above the interface. It can be seen that the cells above the interface area appear more flattened in shape and were mainly monolayer cells (figure 10b) compared with the cell at the interface area (figure 10a).
Figure 10.
Scanning electron micrographs of a polished Ti disc after its removal from the oral mucosal equivalent. Cells with a more rounded shaped were observed at the interface area (a), compared with flatter-shaped cells noted at a site above the interface area (b).
3.5. Monolayer cell culture test
Figure 11 presents the data on the viability of cells (TR146 and HF) that had migrated from the bottom of the confluent well to the Ti surfaces and had then proliferated on the surfaces. The polished Ti surface has the highest viability of attached cells and was significantly higher than the anodized surface (p < 0.05).
Figure 11.

Alamar Blue assay of cells that had migrated and proliferated on four types of Ti surfaces in the monolayer cell culture model. The error bar represents 1 s.d. (n = 6), *p < 0.05.
4. Discussion
To date, most investigations of the BS at the implant–soft tissue interface have been based on qualitative analyses (i.e. histomorphometric analysis) of the BS but not on any quantitative analysis. In this study, an in vitro three-dimensional OMM was used for quantitative analysis of the BS of the Ti–OME interface. Permeability tests have been used in studies such as the investigation of the barrier properties of different tissues for drug delivery routes [21,22]. To our knowledge, this is the first time a permeability test has been used to evaluate the BS of different Ti surface topographies using a three-dimensional OMM. The four types of Ti surfaces used in this study have a range of surface roughnesses from smooth to moderate. Since the in vitro three-dimensional OMM was constructed using a standard protocol, this model has the benefit that it has less variability when compared with animal models. With the availability of an in vitro three-dimensional OMM, which more closely mimics the in vivo situation when compared with the in vitro monolayer cell culture model, it is hoped that the use of three-dimensional OMM will help to reduce the usage of animal models for quantitative analysis of the BS.
Permeability tests are usually performed in a perfusion chamber, which consists of two compartments such as the donor and the receiver compartment [21–23]. The test substance, such as radioactive tritiated water, is inoculated in the donor compartment and then the HTO penetrates through the model, which is then collected in the receiver compartment. The samples are normally positioned vertically in the perfusion chamber [22,23]. This is not suitable in our study, as the weight of the Ti disc could damage the interface if it were placed vertically. Some studies have reported performing the permeability test directly on the insert of the cell culture plate, as used in the present study, in which the sample was placed horizontally on the insert without disturbing the interface [24,25].
In order to achieve a peripheral seal, all the samples were clamped between the two compartments of an insert, a method used in other studies [21–23]. The use of adhesive to form the peripheral seal has been reported in another study on biopsied tissues [23]. Although extra precautions were taken during the clamping of the two components of the inserts, it is possible that the penetration of HTO through the periphery of the inserts could not be completely eliminated. Therefore, any penetration of HTO in the study model may not only have been through the interface between the OME and Ti, but also through the periphery of the inserts.
The steady-state flux (Jss) measured the amount of HTO radioactivity that had diffused through a standard surface area of the study model at different time points. The surface area of those groups, containing Ti discs (P, M, S, T, ANT), was taken into consideration by deducting the surface area of the Ti discs from the exposed surface area, as the Ti disc was an impermeable surface.
At the beginning of the exposure to HTO (J1), the penetration of HTO in all the groups was rather fast compared with the rate after 30 min of exposure but decreased after 2 h (J4) of exposure (figure 6). This could be due to the medium between the inserts and the wells trying to reach an equilibrium at the start of the experiment. However, towards the end of exposure, the medium from the wells had diluted the concentration of the HTO in the inserts, which resulted in the decrease in the penetration rate. Hence, the data between the 60 and 120 min exposures are considered to be more representative of the permeability process in the test groups.
All the OMEs used in this experiment contained an epithelium layer (figure 3). The acellular dermis with cells (AC) had a lower permeability than the acellular dermis without cells (A), but this only became significantly different after the 1 h of exposure (data not shown). In the AC group, the cells cultured on the scaffold had some barrier effect on the OME but not to the extent of completely preventing the permeation of the HTO. This incomplete barrier property of the OME is also found in the normal oral mucosa, where it has been suggested as an alternative route for drug delivery due to this permeability property [22].
The permeability of the Ti test groups and the AC group was not significantly different. In the Ti groups, there were holes punched in the OMEs before the placement of the Ti discs. After incorporating the Ti discs, the models were further cultured for another 6 days, when the OME cells grew around the Ti surfaces forming the BS. This finding suggests that the seal around the four types of Ti surfaces was rather good, the data being comparable to the AC group which had an intact epithelium layer. The quality of the BS around the Ti discs is further supported when the permeability data are compared with the ANT group, which did not contain any epithelium layer on the scaffold and thus no cell-mediated seal around the Ti surface, consequently showing a statistically higher permeability than the Ti groups (figure 7). In comparing the quality of BS of the four types of Ti surface topographies based on the permeability of HTO, no significant differences were observed.
In the attachment test, the Ti discs were removed as carefully as possible by holding the Ti discs with a pair of tweezers, so as not to disturb the cells at the interface. The cells that were still attached to the Ti discs at the interface were quantified in Alamar Blue assay. The results of the attachment test show that there was no significant difference in the number of cells attached at the interface for the four types of Ti surface topographies (figure 8). These findings suggest that the surface topography of the Ti surfaces did not influence soft tissue attachment and consequently had no influence on the BS.
The SEM findings provide supporting evidence that the OME formed an attachment onto all the Ti surfaces tested in this study (figure 9). The finding that cells remained attached to the Ti surfaces after removing the Ti discs from the OME suggests that the bond between the cells and Ti surface was stronger than between the cells of the OME.
The monolayer cell culture (MCC) model was set up to evaluate the affinity of TR146 and HF to the four different Ti surfaces. However, the MCC model used in this study was different from other MCC studies, which were usually carried out by inoculating cell suspension directly onto the tested surfaces [11–13,26,27]. In this study, the Ti discs were placed only onto the cells after the cells became confluent in the well. Nevertheless, extra attention was needed to ensure that there was no movement of the Ti discs on the confluent well during incubation, as any movement could damage the cells around the Ti disc. The short incubation period minimizes the possibility of Ti disc movement. Thus, after 2 days of incubation, the Alamar Blue assay measured the viability of cells that had migrated from the well to the Ti surfaces.
When comparing the results of the Alamar Blue assay of the three-dimensional OMM with the MCC model of the four types of Ti surfaces, different findings were observed. On the three-dimensional OMM, both the machined and anodized groups had a higher Alamar Blue fluorescent intensity than the polished and sandblasted groups (figure 11). Interestingly, when the experiment was done on the MCC model, the opposite finding was observed, i.e. the machined and anodized groups had a lower Alamar Blue assay than the other two groups (figure 11). However, it should be noted that there was no statistically significant difference among the four types of Ti surfaces tested in the OME model, whereas a significant difference was observed between the polished and anodized groups in the MCC model. It means that the results from a three-dimensional study model can be contrary to those from a two-dimensional model (i.e. MCC model). In addition, the SEM images also indicated that the morphology of the cells of the OME model was different from the MCC model (figure 10).
Although this new in vitro three-dimensional OMM provided more information than the MCC model, it still lacks other cell components in the in vivo model that might be involved in the peripheral immunological defence system. Thus, researchers need to be aware of the limitations of both study models.
Taken together, the results from the permeability, attachment, MCC tests and SEM examination suggest that the four types of Ti surface topographies do not result in obvious differences in their soft tissue attachment. The BS on polished, machined, sandblasted and anodized surfaces appear to be similar, regardless of the difference in surface roughness and topography. This is in agreement with an animal study, which reported that no histomorphometric differences were detected between machined and dual, thermal acid-etched (‘Osseotite’) abutments [20]. Nevertheless, although the surface roughness may not have a significant influence on soft tissue attachment, it may affect plaque formation. As a general rule, a smooth polished implant surface is a better plaque control surface, which will reduce the risk of developing peri-implantitis that will lead to the destruction of the BS and the underlying tissue.
5. Conclusion
The biological seal of the tissue-engineered oral mucosa around the polished, machined, sandblasted and anodized Ti surfaces were not significantly different. The use of permeability and attachment tests in conjunction with the three-dimensional OMM can be a suitable and relevant method of quantitative evaluation of the biological seal of the soft tissue around implants.
Acknowledgements
The first author expresses her gratitude towards the University of Malaya, for sponsoring her PhD study in University of Sheffield, UK, and being granted a research grant (UM.C/625/1/HIR/MOHE/DENT/05) for furthering the research in University of Malaya. The researchers would also like to extend their appreciation to Prof Ian Douglas, the Director of Research of the School of Clinical Dentistry, University of Sheffield for his invaluable advice on using the radioactive isotopes. We are grateful to Nobel Biocare, who kindly provided us with the TiUnite Ti discs and commercial pure Ti (grant no. 2009-757) in this study. The authors declare that there is no conflict of interest in this study.
References
- 1.Berglundh T., Lindhe J., Ericsson I., Marinello C. P., Liljenberg B., Thomsen P. 1991. The soft tissue barrier at implants and teeth. Clin. Oral Implants Res. 2, 81–90 10.1034/j.1600-0501.1991.020206.x (doi:10.1034/j.1600-0501.1991.020206.x) [DOI] [PubMed] [Google Scholar]
- 2.Fujiseki M., Matsuzaka K., Yoshinari M., Shimono M., Inoue T. 2003. An experimental study on the features of peri-implant epithelium: immunohistochemical and electron-microscopic observations. Bull. Tokyo Dent. Coll. 44, 185–199 10.2209/tdcpublication.44.185 (doi:10.2209/tdcpublication.44.185) [DOI] [PubMed] [Google Scholar]
- 3.Kawahara H., Kawahara D., Hashimoto K., Takashima Y., Ong J. L. 1998. Morphologic studies on the biologic seal of titanium dental implants. Report I. In vitro study on the epithelialization mechanism around the dental implant. Int. J. Oral Maxillofac. Implants 13, 457–464 [PubMed] [Google Scholar]
- 4.Yeung S. C. 2008. Biological basis for soft tissue management in implant dentistry. Aust. Dent. J. 53(Suppl. 1) S39–S42 10.1111/j.1834-7819.2008.00040.x (doi:10.1111/j.1834-7819.2008.00040.x) [DOI] [PubMed] [Google Scholar]
- 5.Atsuta I., Yamaza T., Yoshinari M., Goto T., Kido M. A., Kagiya T., Mino S., Shimono M., Tanaka T. 2005. Ultrastructural localization of laminin-5 (gamma2 chain) in the rat peri-implant oral mucosa around a titanium-dental implant by immuno-electron microscopy. Biomaterials 26, 6280–6287 10.1016/j.biomaterials.2005.03.046 (doi:10.1016/j.biomaterials.2005.03.046) [DOI] [PubMed] [Google Scholar]
- 6.Ikeda H., Shiraiwa M., Yamaza T., Yoshinari M., Kido M. A., Ayukawa Y., Inoue T., Koyano K., Tanaka T. 2002. Difference in penetration of horseradish peroxidase tracer as a foreign substance into the peri-implant or junctional epithelium of rat gingivae. Clin. Oral Implants Res. 13, 243–251 10.1034/j.1600-0501.2002.130303.x (doi:10.1034/j.1600-0501.2002.130303.x) [DOI] [PubMed] [Google Scholar]
- 7.Chai W. L., Brook I. M., Emanuelsson L., Palmquist A., van Noort R., Moharamzadeh K. 2012. Ultrastructural analysis of implant–soft tissue interface on a three dimensional tissue-engineered oral mucosal model. J. Biomed. Mater. Res. A 100, 269–277 10.1002/jbm.a.33245 (doi:10.1002/jbm.a.33245) [DOI] [PubMed] [Google Scholar]
- 8.Ruggeri A., Franchi M., Marini N., Trisi P., Piatelli A. 1992. Supracrestal circular collagen fiber network around osseointegrated nonsubmerged titanium implants. Clin. Oral Implants Res. 3, 169–175 10.1034/j.1600-0501.1992.030403.x (doi:10.1034/j.1600-0501.1992.030403.x) [DOI] [PubMed] [Google Scholar]
- 9.Tetè S., Mastrangelo F., Bianchi A., Zizzari V., Scarano A. 2009. Collagen fiber orientation around machined titanium and zirconia dental implant necks: an animal study. Int. J. Oral Maxillofac. Implants 24, 52–58 [PubMed] [Google Scholar]
- 10.Schupbach P., Glauser R. 2007. The defense architecture of the human periimplant mucosa: a histological study. J. Prosthet. Dent. 97, S15–S25 10.1016/S0022-3913(07)60004-3 (doi:10.1016/S0022-3913(07)60004-3) [DOI] [PubMed] [Google Scholar]
- 11.Pendegrass C. J., Gordon D., Middleton C. A., Sun S. N., Blunn G. W. 2008. Sealing the skin barrier around transcutaneous implants: in vitro study of keratinocyte proliferation and adhesion in response to surface modifications of titanium alloy. J. Bone Joint Surg. Br. 90, 114–121 10.1302/0301-620X.90B1.19580 (doi:10.1302/0301-620X.90B1.19580) [DOI] [PubMed] [Google Scholar]
- 12.Oates T. W., Maller S. C., West J., Steffensen B. 2005. Human gingival fibroblast integrin subunit expression on titanium implant surfaces. J. Periodontol. 76, 1743–1750 10.1902/jop.2005.76.10.1743 (doi:10.1902/jop.2005.76.10.1743) [DOI] [PubMed] [Google Scholar]
- 13.Sauberlich S., Klee D., Richter E. J., Hocker H., Spiekermann H. 1999. Cell culture tests for assessing the tolerance of soft tissue to variously modified titanium surfaces. Clin. Oral Implants Res. 10, 379–393 10.1034/j.1600-0501.1999.100505.x (doi:10.1034/j.1600-0501.1999.100505.x) [DOI] [PubMed] [Google Scholar]
- 14.Moharamzadeh K., Brook I. M., van Noort R., Scutt A. M., Thornhill M. H. 2007. Tissue-engineered oral mucosa: a review of the scientific literature. J. Dent. Res. 86, 115–124 10.1177/154405910708600203 (doi:10.1177/154405910708600203) [DOI] [PubMed] [Google Scholar]
- 15.Radyuk S. N., Mericko P. A., Popova T. G., Grene E., Alibek K. 2003. In vitro-generated respiratory mucosa: a new tool to study inhalational anthrax. Biochem. Biophys. Res. Commun. 305, 624–632 10.1016/S0006-291X(03)00830-1 (doi:10.1016/S0006-291X(03)00830-1) [DOI] [PubMed] [Google Scholar]
- 16.Moharamzadeh K., Brook I. M., van Noort R., Scutt A. M., Smith K. G., Thornhill M. H. 2008. Development, optimization and characterization of a full-thickness tissue engineered human oral mucosal model for biological assessment of dental biomaterials. J. Mater. Sci. Mater. Med. 19, 1793–1801 10.1007/s10856-007-3321-1 (doi:10.1007/s10856-007-3321-1) [DOI] [PubMed] [Google Scholar]
- 17.Moharamzadeh K., Brook I. M., Scutt A. M., Thornhill M. H., van Noort R. 2008. Mucotoxicity of dental composite resins on a tissue-engineered human oral mucosal model. J. Dent. 36, 331–336 10.1016/j.jdent.2008.01.019 (doi:10.1016/j.jdent.2008.01.019) [DOI] [PubMed] [Google Scholar]
- 18.Moharamzadeh K., Franklin K. L., Brook I. M., van Noort R. 2009. Biologic assessment of antiseptic mouthwashes using a three-dimensional human oral mucosal model. J. Periodontol. 80, 769–775 10.1902/jop.2009.080610 (doi:10.1902/jop.2009.080610) [DOI] [PubMed] [Google Scholar]
- 19.Chai W. L., Moharamzadeh K., Brook I. M., Emanuelsson L., Palmquist A., van Noort R. 2010. Development of a novel model for the investigation of implant–soft tissue interface. J. Periodontol. 81, 1187–1195 10.1902/jop.2010.090648 (doi:10.1902/jop.2010.090648) [DOI] [PubMed] [Google Scholar]
- 20.Abrahamsson I., Zitzmann N. U., Berglundh T., Linder E., Wennerberg A., Lindhe J. 2002. The mucosal attachment to titanium implants with different surface characteristics: an experimental study in dogs. J. Clin. Periodontol. 29, 448–455 10.1034/j.1600-051X.2002.290510.x (doi:10.1034/j.1600-051X.2002.290510.x) [DOI] [PubMed] [Google Scholar]
- 21.Sassi A. B., McCullough K. D., Cost M. R., Hillier S. L., Rohan L. C. 2004. Permeability of tritiated water through human cervical and vaginal tissue. J. Pharm. Sci. 93, 2009–2016 10.1002/jps.20107 (doi:10.1002/jps.20107) [DOI] [PubMed] [Google Scholar]
- 22.Selvaratnam L., Cruchley A. T., Navsaria H., Wertz P. W., Hagi-Pavli E. P., Leigh I. M., Squier C. A., Williams D. M. 2001. Permeability barrier properties of oral keratinocyte cultures: a model of intact human oral mucosa. Oral Dis. 7, 252–258 10.1034/j.1601-0825.2001.70409.x (doi:10.1034/j.1601-0825.2001.70409.x) [DOI] [PubMed] [Google Scholar]
- 23.Lesch C. A., Squier C. A., Cruchley A., Williams D. M., Speight P. 1989. The permeability of human oral mucosa and skin to water. J. Dent. Res. 68, 1345–1349 10.1177/00220345890680091101 (doi:10.1177/00220345890680091101) [DOI] [PubMed] [Google Scholar]
- 24.Cumpstone M. B., Kennedy A. H., Harmon C. S., Potts R. O. 1989. The water permeability of primary mouse keratinocyte cultures grown at the air–liquid interface. J. Invest. Dermatol. 92, 598–600 10.1111/1523-1747.ep12712043 (doi:10.1111/1523-1747.ep12712043) [DOI] [PubMed] [Google Scholar]
- 25.Nielsen H. M., Rassing M. R. 2000. TR146 cells grown on filters as a model of human buccal epithelium. IV. Permeability of water, mannitol, testosterone and beta-adrenoceptor antagonists. Comparison to human, monkey and porcine buccal mucosa. Int. J. Pharm. 194, 155–167 10.1016/S0378-5173(99)00368-3 (doi:10.1016/S0378-5173(99)00368-3) [DOI] [PubMed] [Google Scholar]
- 26.Eisenbarth E., Velten D., Schenk-Meuser K., Linez P., Biehl V., Duschner H., Breme J., Hildebrand H. 2002. Interactions between cells and titanium surfaces. Biomol. Eng. 19, 243–249 10.1016/S1389-0344(02)00032-1 (doi:10.1016/S1389-0344(02)00032-1) [DOI] [PubMed] [Google Scholar]
- 27.Lauer G., Wiedmann-Al-Ahmad M., Otten J. E., Hubner U., Schmelzeisen R., Schilli W. 2001. The titanium surface texture effects adherence and growth of human gingival keratinocytes and human maxillar osteoblast-like cells in vitro. Biomaterials 22, 2799–2809 10.1016/S0142-9612(01)00024-2 (doi:10.1016/S0142-9612(01)00024-2) [DOI] [PubMed] [Google Scholar]


