

Abstract
An endogenous probe for CYP3A activity would be useful for early identification of in vivo CYP3A4 inhibitors. The aim of this study was to determine whether formation clearance (CLf) of the sum of 6β-hydroxycortisol and 6β-hydroxycortisone is a useful probe of CYP3A4 inhibition in vivo. In human liver microsomes, formation of 6β-hydroxycortisol and 6β-hydroxycortisone was catalyzed by CYP3A4, and itraconazole inhibited these reactions with IC50,u of 3.1nM and 3.4nM, respectively. The in vivo IC50,u of itraconazole towards the combined CLf of 6β-hydroxycortisone and 6β-hydroxycortisol was 1.6nM. The greater inhibitory potency in vivo is likely due to circulating inhibitory itraconazole metabolites. The maximum in vivo inhibition was 59% suggesting that fm,CYP3A4 for cortisol and cortisone 6β-hydroxylation is approximately 60%. Based on significantly decreased CLf of 6β-hydroxycortisone and 6β-hydroxycortisol after 200mg and 400mg single doses of itraconazole, this endogenous probe can be used to detect moderate and potent CYP3A4 inhibition in vivo.
Keywords: cortisol, cortisone, 6β-hydroxylation, CYP3A4, endogenous probe
INTRODUCTION
Cytochrome P450 3A4 (CYP3A4) metabolizes more than 50% of clinically used drugs1, 2 and hence inhibitory drug-drug interactions with CYP3A4 have broad implications with respect to labeling of a new drug entity. A biomarker for detection of in vivo CYP3A4 inhibition in early phase I and phase II studies would be useful in drug development and provide data to assist in design of subsequent in vivo interaction studies. 4β-hydroxycholesterol3 and 6β-hydroxycortisol4 have been suggested as endogenous biomarkers for CYP3A4 induction and inhibition but their sensitivity and selectivity is controversial. During treatment with a potent CYP3A4 inhibitor itraconazole, a weak effect on 4β-hydroxycholesterol concentrations (21-29% decrease) was observed and total cholesterol decreased by 10%3 suggesting that 4β-hydroxycholesterol is not a sensitive probe of CYP3A4 activity. The urinary 6β-hydroxycortisol to cortisol ratio has been used to detect CYP3A4 induction in studies with rifampin4-7, but the use of this urinary ratio to detect CYP3A4 inhibition is still controversial8. Some P450 inhibitors, such as clarithromycin, danazol, and amiodarone9-11 have been shown to decrease the urinary 6β-hydroxycortisol to cortisol-ratio by 15-65 % whereas no significant inhibitory effect was observed following indinavir, ritonavir and amprenavir administration.12 The lack of inhibitory effects by HIV protease inhibitors could be explained by induction of hepatic CYP3A4 or increased synthesis of cortisol, but the weak effects observed with potent CYP3A4 inhibitors do not support use of the urinary ratio as an in vivo probe.
The 6β-hydroxycortisol to cortisol urinary ratio depends on the renal clearance (CLr) of both compounds as well as on the formation clearance of 6β-hydroxycortisol. Therefore, the urinary 6β-hydroxycortisol to cortisol ratio is a valid index of CYP3A4 activity only in the absence of significant intra- and inter-individual variation in cortisol CLr13. Hence the formation clearance (CLf) of 6β-hydroxycortisol has been proposed as a more accurate probe of CYP3A4 activity13, but this measure has not been validated. Use of cortisol as a CYP3A4 probe can also be confounded because cortisol and 6β-hydroxycortisol are reversibly converted to cortisone and 6β-hydroxycortisone by 11-β-hydroxysteroid dehydrogenase (11β-HSD)14, 15. Due to this interconversion, it is likely that the CLf’s of 6β-hydroxycortisol and 6β-hydroxycortisone have to be combined to measure CYP3A4 activity in vivo. The aim of this study was to determine whether measurement of both 6β-hydroxycortisol and 6β-hydroxycortisone CLf could be used as a selective, sensitive and reliable endogenous probe for hepatic CYP3A4 activity.
RESULTS
Validation of cortisol and cortisone 6β-hydroxylation as CYP3A4 probes and inhibition by itraconazole in vitro
Formation of 6β-hydroxycortisol and 6β-hydroxycortisone was detected in recombinantly-expressed CYP3A4 microsomes and in human liver microsomes (HLMs). The conversion between cortisol and cortisone, and between the 6β-hydroxy metabolites was observed only in HLMs. To determine the contribution of individual P450 isoforms to cortisol and cortisone hydroxylation, a panel of specific P450 inhibitors was incubated with cortisol and cortisone (Figure 1). Troleandomycin and ketoconazole, two CYP3A4 inhibitors, decreased the 6β-hydroxylation of cortisol by 88 and 79%, respectively, and the 6β-hydroxylation of cortisone by 93%, suggesting that CYP3A4 is the major contributor to both reactions. Orphenadrine, a CYP2B6 inhibitor, decreased cortisol and cortisone 6β-hydroxylation by 45% and 52% respectively whereas sulfaphenazole (CYP2C9) and quinidine (CYP2D6) inhibited cortisone hydroxylation by about 50% but had no effect on cortisol hydroxylation. Benzylnirvanol (CYP2C19), montelukast (CYP2C8) and furafylline (CYP1A2, cortisol only) had no effect on either cortisol or cortisone 6β-hydroxylation. The role of CYP3A4 in cortisol and cortisone hydroxylation in HLMs was also determined using a CYP3A4 specific inhibitor itraconazole. Itraconazole inhibited the formation of 6β-hydroxycortisol and 6β-hydroxycortisone in HLMs with IC50 values of 68 nM and 73 nM, respectively, and with maximum inhibition of 78-85% (Figure 1). The IC50,u values of 3.1 and 3.4 nM towards 6β-hydroxycortisol and 6β-hydroxycortisone formation, respectively, were calculated using an unbound fraction of itraconazole in HLMs of 4.6 ± 1% (independent of itraconazole concentration).
Figure 1. Inhibition of cortisol and cortisone 6β-hydroxylation by CYP isoform specific inhibitors and itraconazole in human liver microsomes.
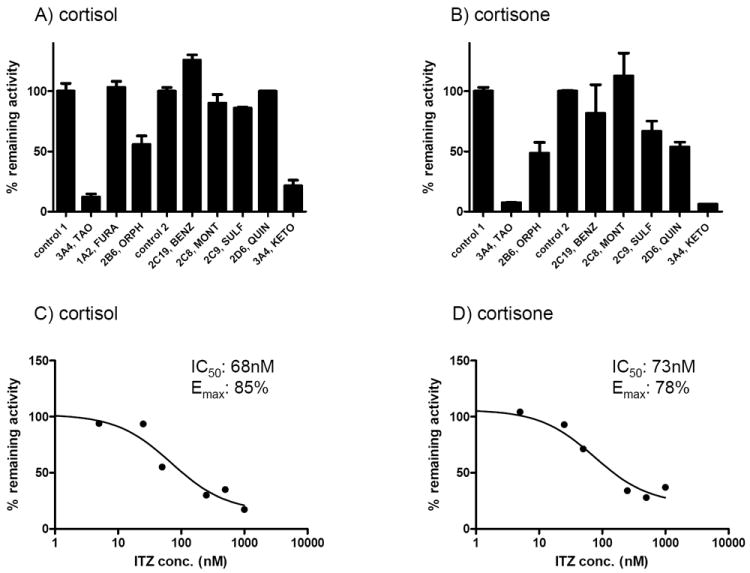
The percent activity remaining in comparison to control in human liver microsomes (HLMs) is shown when HLMs were incubated with 1.4μM cortisol (panel A) or cortisone (panel B) in the presence of the indicated specific CYP inhibitors. The error bars indicate the range of individual measurements. Control 1 refers to the control used for preincubation with mechanism-based inhibitors and Control 2 refers to the control for reversible inhibitors. The abbreviation are as follows: troleandomycin (TAO), furafylline (FURA), orphenadrine (ORPH), (+)-N-3-benzylnirvanol (BENZ), montelukast (MONT), sulfaphenazole (SULF), quinidine (QUIN) and ketoconazole (KETO). The IC50–values for itraconazole (ITZ) towards cortisol (panel C) and cortisone (panel D) hydroxylation (1.4 μM) were determined in human liver microsomes and the obtained IC50 value and the maximum % inhibition (Emax value) are shown in the insets of each panel.
The 6β-hydroxylation of cortisol and cortisone by CYP3A4, CYP2B6, CYP2C19 and CYP2C9 was further investigated using recombinantly-expressed enzymes. Cortisol 6β-hydroxylation by CYP2B6 was observed whereas cortisone 6β-hydroxylation was detected with CYP2D6 but not with CYP2B6, CYP2C19 or CYP2C9. The 6β-hydroxylation kinetics of cortisol and cortisone by CYP3A4 were similar (Figure 2) with Km values of 148±25 μM and 89±9 μM and Vmax values of 27±2 pmol/min/pmol CYP3A4 and 15.2±0.7 pmol/min/pmol CYP3A4, respectively. No difference was observed in the intrinsic clearances (CLint), which were 0.18 mL/min/nmol CYP3A4 for cortisol and 0.17 mL/min/nmol CYP3A4 for cortisone. The CYP3A4 mediated CLint for cortisol hydroxylation was 40-fold greater than the apparent CYP2B6 mediated intrinsic clearance (0.0045 mL/min/nmol P450, Figure 2B; v=0.11 pmol/min/pmol, [S, cortisone]=25 μM) and no saturation of CYP2B6 was observed. Similarly, the CYP3A4 mediated CLint for 6β-hydroxycortisone formation was 106-fold greater than the CYP2D6 mediated clearance (0.0016 mL/min/nmol, v=0.04 pmol/min/pmol, [S, cortisone]=25 μM). When the specific content of CYP3A4, CYP2B6 and CYP2D6 in the liver is taken into account, the contribution of CYP2B6 and CYP2D6 to the 6β-hydroxylation of cortisol and cortisone is predicted to be insignificant. These results suggest that both cortisol and cortisone 6β-hydroxylations are primarily mediated by CYP3A4 in the human liver.
Figure 2. Kinetic characterization of cortisol 6β-hydroxylation by CYP3A4 (A) and CYP2B6 (B), and cortisone 6β-hydroxylation by CYP3A4 (C).
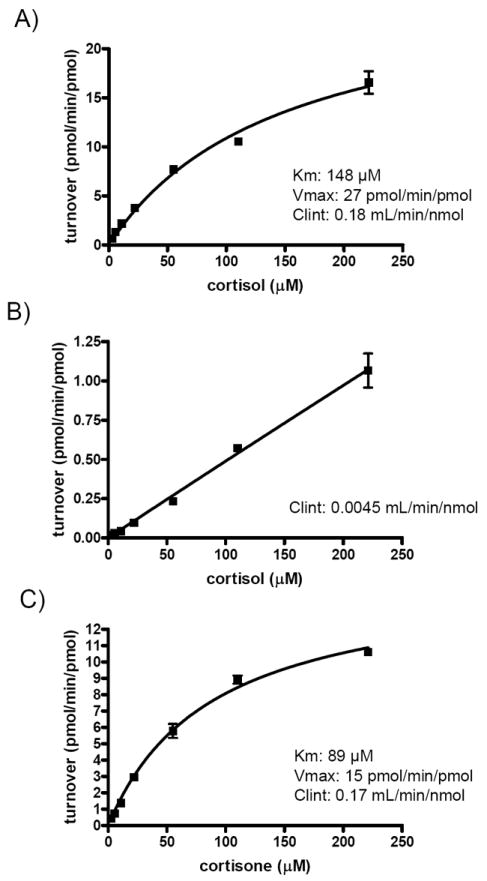
Cortisol (A and B) or cortisone (C) was incubated with CYP3A4 (panel A and C) or CYP2B6 (panel B) supersomes and the formation of 6β-hydroxylation products was measured. No interconversion between cortisol and cortisone or the 6β -hydroxy-metabolites was observed. The Michaelis-Menten equation was fitted to the data to obtain the indicated kinetic parameters (inset in A and C). For CYP2B6 no saturation was observed and hence only the intrinsic clearance was calculated from the slope of the plot (panel B).
Inhibition of 6β-hydroxycortisol and 6β-hydroxycortisone formation by itraconazole in vivo
Administration of single doses of itraconazole (50, 200 and 400 mg po) resulted in an itraconazole dose dependent decrease in the CLf of 6β-hydroxycortisol and 6β-hydroxycortisone (Table 1), and no effect on the plasma concentrations of cortisol or cortisone (Figure 3). No significant decrease in the CLf processes was observed after 50 mg dose of itraconazole (Table 1), however the 200 or 400 mg itraconazole doses caused significant decreases in the combined CLf of 6β-hydroxycortisone and 6β-hydroxycortisol (40-49%, p<0.017) and 6β-hydroxycortisone CLf (34-41%, p<0.017). The 6β-hydroxycortisol CLf was decreased significantly (51%, p=0.017) only after the 400 mg itraconazole dose (Table 1). No significant difference in the magnitude of inhibition between 200 and 400 mg itraconazole doses was observed for any of the CLf processes.
Table 1.
The effect of escalating itraconazole (ITZ) doses on the formation CL (CLf) of 6β-hydroxycortisol (CLf, 6β-OHF), 6β-hydroxycortisone (CLf, 6β-OHE) and their combination (CLf, 6β-OHF+6β-OHE). The values in brackets show the calculated p-value using two-tailed paired t-test.
| Study session | CLf, 6β-OHF, (24hr) (mL/hr) | CLf, 6β-OHE, (24hr) (mL/hr) | CLf, 6β-OHF+6β-OHE, (24hr) (mL/hr) |
|---|---|---|---|
| control | 125 ± 65 | 56 ± 14 | 107 ± 41 |
| ITZ, 50 mg | 91 ± 40 (0.139) | 50 ± 16 (0.113) | 81 ± 31 (0.111) |
| ITZ, 200 mg | 72 ± 37 (0.020) | 36 ± 9 (0.006)* | 64 ± 29 (0.008)* |
| ITZ, 400 mg | 61 ± 30 (0.017)* | 31 ± 6 (0.006)* | 55 ± 25 (0.005)* |
indicates a p-value ≤0.017
Figure 3. Plasma concentration-time curves of cortisol (A) and cortisone (B) in the presence and absence of itraconazole (ITZ).
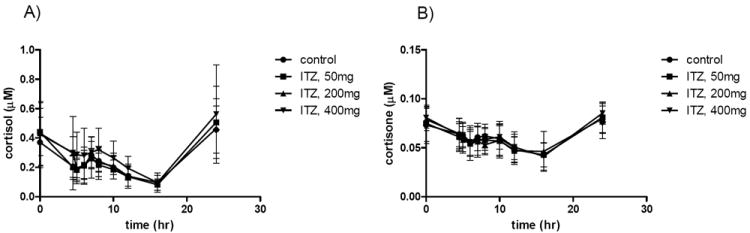
The average plasma concentration (6 subjects) of cortisol (panel A) and cortisone (panel B) during the 24-hours after itraconazole administration are shown after control session and after 50, 200 and 400 mg administration of itraconazole. The error bars show the standard deviation of the concentration in the six subjects.
The in vivo IC50 values for itraconazole towards CYP3A4-mediated cortisol and cortisone 6β-hydroxylation were calculated using previously measured circulating concentrations of itraconazole and the observed %-decrease in Clf (Figure 4). Large inter-individual variability in the in vivo IC50 values and the maximum % inhibition was evident. The mean in vivo IC50 of itraconazole towards the combined 6β-hydroxycortisol and 6β-hydroxycortisone CLf was 111±170 nM (n=6) resulting in an IC50,u of 3.9 nM (plasma fu=3.6). One of the subjects (male S2, in vivo IC50=448nM) was determined to be an outlier (p<0.05) and was excluded from the analysis. When the outlier was excluded, the average in vivo IC50 was 44±50 nM resulting in IC50,u of 1.6 nM. There was no apparent difference in itraconazole or its metabolite exposures in S2 compared to the other subjects but he had the highest midazolam oral clearance in all four study sessions. The in vivo IC50 values of itraconazole towards Clf of 6β-hydroxycortisol or 6β-hydroxycortisone alone were 44±54 nM and 91±65 nM, respectively (n=5), resulting in IC50,u values of 1.6 nM and 3.3 nM, respectively. The maximum inhibition obtained from the in vivo IC50 fits was 59% for the combined CLf, 61% for 6β-hydroxycortisol and 52% for 6β-hydroxycortisone CLf suggesting that the in vivo fm for cortisol and cortisone 6β-hydroxylation by CYP3A4 is 50-60%.
Figure 4. Determination of in vivo IC50 of itraconazole towards the formation clearance of 6β-hydroxycortisone and 6β-hydroxycortisol and estimation of the maximum extent of inhibition.
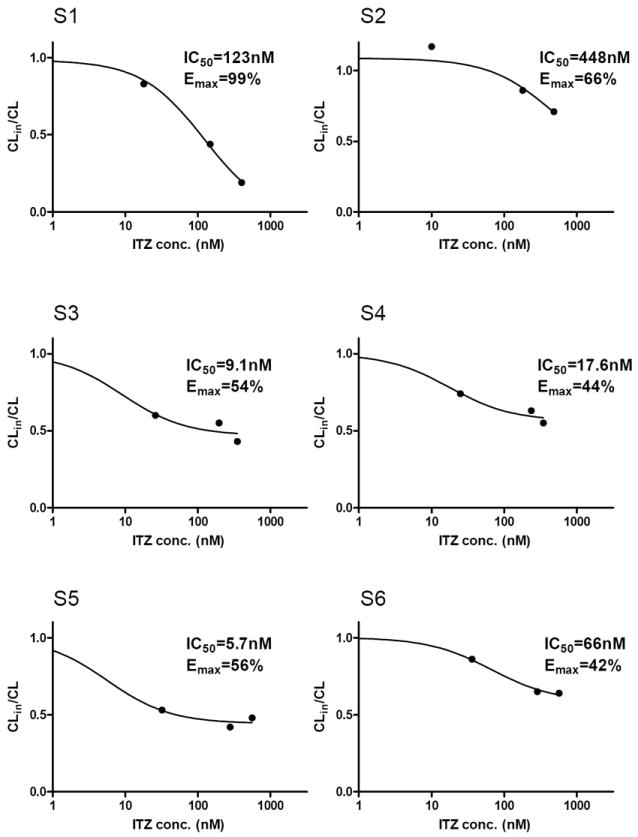
The CLin/CL was calculated for each subject following escalating itraconazole (ITZ) doses using the formation clearance (CLf) values for combined cortisol and cortisone hydroxylation according to equation 1. The plasma concentrations of ITZ were measured in each individual and the CLin/CL –values were plotted as a function of ITZ concentration. The IC50 and Emax values were determined by fitting equation 4 to the data.
An apparent CLf of 6β-hydroxycortisol, 6β-hydroxycortisone and their sum, measured by substituting the AUCs of cortisol and cortisone with the product of the plasma concentration at the end of the urine collection interval (24 hour endpoint) and the 24 hour urine collection interval, was used to study the time-course and persistence of CYP3A4 inhibition by itraconazole (Table 2). The 6β-hydroxycortisol/cortisol urinary ratio was also measured (Table 3). The apparent Clf values were measured during the 24 hour control session, for 24 hours after 50, 200 and 400 mg doses of itraconazole and for 24 hour sessions 2, 4 and 7 days after administration of 400 mg itraconazole. Similar to the more rigorous CLf measures, a significant decrease (40-48%, p<0.017) in each apparent CLf was observed after 200 and 400 mg doses of itraconazole, but not after the 50 mg dose (Table 2). Significant CYP3A4 inhibition (48-56%) was still observed 24-48 hours after administration of itraconazole (400 mg) and the magnitude of inhibition was similar between 0-24 and 24-48 hour time intervals after itraconazole administration. This inhibition gradually disappeared by 4 and 7 days after itraconazole administration. The renal clearance of cortisol (17 mL/hr) was unchanged after escalating itraconazole doses (Table 3) and the 6β-hydroxycortisol/cortisol urinary ratio decreased significantly (p<0.017) on the days of itraconazole administration (200 and 400 mg). However, no significant effect on the urinary ratio was detected after the 50 mg dose of itraconazole or 48 hours after the 400 mg itraconazole dose (Table 3).
Table 2.
The effect of escalating single doses of itraconazole (ITZ) on apparent formation CL of 6β-hydroxycortisol (CLf, 6β-OHF), 6β-hydroxycortisone (CLf, 6β-OHE) and their sum (CLf, 6β-OHF+6β-OHE), measured as the ratio of the urinary excretion of the metabolite divided by the plasma concentration of the parent at the end of the urine collection interval. The persistence of CYP3A4 inhibition was measured on day 2, day 4 and day 7 after 400 mg dose of itraconazole. The values in brackets show the calculated p-values using two-tailed paired t-test.
| Study session | CLf, 6β-OHF, (24hr) (mL/hr) | CLf, 6β-OHE, (24hr) (mL/hr) | CLf, 6β-OHF+6β-OHE, (24hr) (mL/hr) |
|---|---|---|---|
| Control | 74 ± 36 | 46 ± 9 | 68 ± 28 |
| ITZ, 50 mg | 53 ± 21 (0.1) | 38 ± 10 (0.022) | 49 ± 18 (0.070) |
| ITZ, 200 mg | 44 ± 20 (0.011)* | 28 ± 8 (0.001)* | 40 ± 17 (0.004)* |
|
| |||
| ITZ, 400 mg | 42 ± 26 (0.002)* | 24 ± 5 (0.002)* | 38 ± 21 (0.001)* |
| Day 2 | 31 ± 10 (0.016)* | 24 ± 7 (0.000)* | 30 ± 9 (0.007)* |
| Day 4 | 57 ± 48 (0.08) | 41 ± 22 (0.4) | 53 ± 40 (0.104) |
| Day 7 | 67 ± 42 (0.3) | 38 ± 15 (0.057) | 60 ± 33 (0.187) |
indicates a p-value ≤0.017
Table 3.
The effect of escalating doses of itraconazole (ITZ) on the urinary ratio of 6β-hydroxy-cortisol to cortisol and the renal clearance of cortisol (CLr (cortisol)). The values in brackets show the calculated p-values using two-tailed paired t-test.
| Study session | Cortisol urinary ratio | CLr (cortisol) (mL/hr) |
|---|---|---|
| Control | 7.88 ± 2.0 | 17.0 ± 9.15 |
| ITZ, 50 mg | 6.67 ± 1.8 (0.037) | 16.2 ± 5.14 |
| ITZ, 200 mg | 4.43 ± 1.2 (0.006)* | 18.0 ± 6.17 |
|
| ||
| ITZ, 400 mg | 3.96 ± 0.6 (0.001)* | 18.4 ± 8.12 |
| Day 2 | 4.84 ± 2.2 (0.024) | |
| Day 4 | 6.07 ± 2.4 (0.101) | |
| Day 7 | 8.34 ± 2.7 (0.708) | |
indicates a p-value ≤0.017
DISCUSSION
In vitro experiments using recombinantly expressed enzymes and HLMs showed that CYP3A4 is responsible for majority of the 6β-hydroxylation of cortisol and cortisone in the liver. Inhibition of CYP3A4 resulted in approximately 90% decrease in cortisol and cortisone 6β-hydroxylation in HLMs. This is in agreement with previous studies of CYP mediated metabolism of cortisol in HLMs, and inhibition of metabolism by ketoconazole16. The observed inhibition by orphenadrine, benzylnirvanol, sulfaphenazole and quinidine in HLMs is likely due to nonspecific inhibition of CYP3A417. Despite the extensive inhibition of cortisol and cortisone 6β-hydroxylation in vitro by CYP3A4 inhibitors, the maximum inhibition observed in vivo after itraconazole administration was only 60% suggesting that fm,CYP3A4 for cortisol and cortisone 6β-hydroxylation is only 60%. This lower fm in vivo, in comparison to in vitro, is most likely due to extra-hepatic 6β-hydroxylation of cortisol and cortisone. Cortisol 6β-hydroxylation has been demonstrated in adrenal tissue as well as in the liver, kidney and skeletal muscle18 but the identity of the enzymes contributing to cortisol hydroxylation in the non-hepatic tissues is not known.
Measurement of 6β-hydroxycortisone CLf in vivo was the most sensitive measure of CYP3A4 activity based on baseline variability of the measures and %-decrease in CLf after CYP3A4 inhibition. A power calculation using the t distribution and the baseline variance observed in this study showed that with 90% power, 13 subjects are needed to detect a 50% decrease in the formation clearance with cortisol hydroxylation alone, eight subjects are needed using the combined measure and only 5 are needed using 6β-hydroxycortisone CLf. The use of combined 6β-hydroxycortisone and 6β-hydroxycortisol CLf appears, however, a better justified in vivo measure of CYP3A4 activity than either CLf alone, because of the extensive inter-conversion between species that may be affected by disease states or CYP inhibitors and inducers. At present inter and intra-individual variability in the inter-conversion processes is not known. In vivo, other tissues besides the liver appear to contribute significantly to the interconversion19 making in vitro to in vivo extrapolation of CLf from HLMs difficult, and measurement of specific CLf for 6β-hydroxycortisol or 6β-hydroxycortisone in vivo potentially confounded. For example, the CLf of 6β-hydroxycortisol or 6β-hydroxycortisone are equal in HLMs and CYP3A4 supersomes, but in vivo the CLf of 6β-hydroxycortisol is twice as high as that of 6β-hydroxycortisone. This in vitro to in vivo discrepancy is likely due to net conversion of 6β-hydroxycortisone to 6β-hydroxycortisol in vivo.
The single time point plasma concentration measurement (made at the end of urine collection period) provided a useful surrogate for cortisol and cortisone AUC, enabling a study of the inhibition time-course using the individual apparent CLf or the combination measure. The urinary 6β-hydroxycortisol to cortisol ratio had lower sensitivity when compared to the CLf measures to detect CYP3A4 inhibition and failed to detect the persistent inhibition of CYP3A4. However, in agreement with previous studies with potent CYP3A4 inhibitors9-11 the urinary ratio did detect potent CYP3A4 inhibition.
In a previous study in these same subjects the concentrations of itraconazole and its metabolites was measured for 72 hours after the 400 mg dose of itraconazole and the I/Ki ratios for itraconazole and its metabolites were calculated. Using this data, CYP3A4 inhibition was expected to persist for 48 hours after the 400 mg dose of itraconazole and return to baseline at 72 hours after that itraconzole dose20. Similarly, a 70-90% decrease in CYP3A4 mediated clearance was predicted during the first 24 hours after 400 mg itraconazole dosing and a 50-70% decrease at 24-48 hours after itraconazole dosing20. The observed time course of inhibition of apparent Clf for cortisol and cortisone 6β-hydroxylation is in good agreement with the previously reported predicted time-course of CYP3A4 inhibition.
In the previous study in these same subjects an RKi (IC50,in vitro/IC50,in vivo) of 14.5 for itraconazole-oral MDZ interaction was measured20 and it was suggested that itraconazole is a more potent inhibitor of CYP3A4 in vivo than in vitro due to circulating metabolites20. The RKi for CLf of cortisone and cortisol 6β-hydroxylation calculated from the IC50,in vitro/IC50,in vivo-ratio was 2.0, demonstrating a much better in vitro to in vivo prediction accuracy than for the itraconazole-MDZ interaction. The observed 2-fold difference between in vitro and in vivo inhibition agrees well with the predicted 50% contribution of itraconazole metabolites to the in vivo interaction. This improved prediction accuracy is likely obtained because cortisol and cortisone hydroxylation measure only hepatic interactions, whereas the interaction with oral MDZ involves inhibition of both intestinal and hepatic CYP3A4. Based on circulating concentrations of ITZ and its metabolites and in vitro IC50 values, 21% and 67% decrease in hepatic midazolam clearance was predicted after 50 mg and 200 mg doses of ITZ, and 30% and 77% in oral midazolam clearance, respectively. Indeed, the MDZ CL/F was decreased 50% after the 50 mg dose of itraconazole and 80% after 200 and 400 mg itraconazole20 whereas the 24% decrease in CLf of cortisol and cortisone hydroxylation after 50 mg itraconazole was not significant and up to 60% decrease in CLf was detected after 200 mg and 400 mg itraconazole. The smaller in vivo fm attributed to CYP3A4 for cortisol hydroxylation in comparison to midazolam metabolism (60% vs 84%) also makes cortisol and cortisone less sensitive probes for CYP3A4 inhibition than oral midazolam. A weak inhibition of CYP3A4 (up to 50% decrease in CYP3A4 mediated formation clearance) would result in only 30% decrease in the formation clearance of 6β-hydroxycortisol and 6β-hydroxycortisone. Due to this fm, which has not been previously reported, any interaction data should be interpreted only after correction for the fm.
In conclusion, these results show that the CLf of 6β-hydroxycortisol and 6β-hydroxycortisone combined or the apparent CLf using endpoint plasma measures can be used as a minimally invasive probe to detect hepatic CYP3A4 inhibition in vivo. The use of 6β-hydroxycortisone provided the most sensitive measure of CYP3A4 inhibition but due to the interconversion with cortisone, this measure may be confounded in clinical studies. The magnitude of interactions and the potency of the inhibitor should be rationalized using an fm of 60% for these probes. These results also suggest that underprediction of an intestinal interaction between itraconazole and oral midazolam, is the main reason for underpredicting AUC changes with the inhibitor and should be further studied.
METHODS
Chemicals and Reagents
Itraconazole was purchased from Janssen Biotech, Research Diagnostics (Flanders, NJ), 6β-hydroxycortisol, cortisol, 6β-hydroxycortisone, cortisone, troleandomycin, furafylline, (+)-N-3-benzylnirvanol, orphenadrine hydrochloride, sulfaphenazole, quinidine and ketoconazole from Sigma-Aldrich (St. Louis, MO), and montelukast sodium from Santa Cruz Biotechnology (Santa Cruz, CA). Ammonium chloride was obtained from Mallinckrodt Baker (Phillipsburg, NJ), and HPLC-grade methanol, acetonitrile (ACN) and ethyl acetate from Fisher Scientific (Fairlawn, NJ). Supersomes™ containing CYP enzymes coexpressed with cytochrome P450 reductase and cytochrome b5 were purchased from BD Biosciences (Woburn, MO). Pooled HLMs were prepared from three CYP3A5*3/*3 donors, using equal microsomal protein amounts from each liver to make the pooled stock HLM.
Microsomal incubations
All samples were done in duplicate, and the activity was linear with incubation time and protein concentrations used. Unless otherwise stated, 1.38 μM of cortisol or cortisone was incubated with 0.5 mg/mL HLM or 20 pmol CYP3A4 supersomes in 100 mM KPi buffer (pH 7.4) with 1 mM EDTA in total volume of 1 mL or 0.5 mL, respectively. The incubation mixtures were preincubated for 5 minutes at 37 °C and the reactions initiated by addition of NADPH (final concentration of 1 mM). After 15 minutes, reactions were quenched by the addition of 3 mL ethyl acetate.
A panel of selective inhibitors was used with pooled HLMs to determine the contribution of individual CYP enzymes to cortisol and cortisone hydroxylation. The inhibitors used were: troleandomycin (CYP3A4, 50 μM), furafylline (CYP1A2, 10 μM), orphenadrine (CYP2B6, 250 μM), (+)-N-3-benzylnirvanol (CYP2C19, 2 μM), montelukast (CYP2C8, 1.5 μM), sulfaphenazole (CYP2C9, 30 μM), quinidine (CYP2D6, 4 μM) and ketoconazole (CYP3A4, 1 μM). The mechanism-based inhibitors of CYP3A4 (troleandomycin), CYP1A2 (furafylline), and CYP2B6 (orphenadrine) were preincubated with HLMs in the presence of NADPH for 15 minutes prior to the addition of cortisol or cortisone. For reversible inhibitors, the reactions were initiated with the addition of NADPH. The kinetic parameters (Km and Vmax) for 6β-hydroxycortisol and 6β-hydroxycortisone in Supersomes were determined using cortisol and cortisone concentrations of 2.76, 5.53, 11.1, 22.1, 55.3, 111, 221 μM.
The IC50 value for itraconazole in pooled HLMs was measured using 6β-hydroxycortisol or 6β-hydroxycortisone formation from cortisol and cortisone (1.38 μM ≪Km for CYP3A4) respectively as probe reactions. Itraconazole concentrations in the incubations were 0 (ACN vehicle control), 5, 25, 50, 250, 500, 1000 nM.
LC-MS assay for cortisol, cortisone and their metabolites
Cortisol, cortisone, 6β-hydroxycortisol and 6β-hydroxycortisone were assayed using a previously described method21. Briefly, 250 μL plasma samples were diluted with 750 μL deionized water. Internal standard (50 μL of 1 μg/mL 6α-methylprednisolone) was added to the diluted samples, incubation samples or to 1 mL urine and each sample was extracted once with 3 mL of ethyl acetate. The organic fractions were evaporated and reconstituted in 100 μL of 1:1 methanol/water (v/v). The samples were analyzed by Shimadzu LC-10AD HPLC system coupled with a Micromass Quattro Micro API tandem quadrupole mass spectrometer (Waters, Milford, MA), using an Inertsil ODS-3 5 μm 50 × 2.1-mm column (MetaChem technologies, Torrance). A gradient elution at 0.25 mL/min from 15% methanol in 85% aqueous 1 mM NH4Cl (pH 9.0) to 80% methanol over 5 minutes and a further isocratic elution for two minutes was used. The following MRM transitions in the negative ion mode were monitored [M+35Cl-]: m/z 397>35 for cortisol, m/z 395>35 for cortisone; m/z 413>35 for 6β-hydroxycortisol, m/z 411>35 for 6β-hydroxycortisone and m/z 409>35 for 6α-methylprednisolone. The calibration curve for cortisol/cortisone and 6β-hydroxycortisol/6β-hydroxycortisone was constructed between 1.95-500 ng/mL. The inter-day variability were: cortisol < 3.1%, 6β-hydroxycortisol < 5.7%, cortisone < 4.3% and 6β-hydroxycortisone < 4.8%. The limit of quantification was 2 ng/mL for all analytes.
Measurement of fraction unbound (fu) in HLM
The unbound fraction of itraconazole in pooled HLMs was determined using a previously described ultracentrifugation method22. In brief, pooled HLMs at 0.5 mg/mL were spiked to 5, 50, or 1000 nM itraconazole in duplicate and the samples were split into two 100 μL aliquots. One aliquot was subject to ultracentrifugation and the other was incubated for the duration of the centrifugation at 37°C. A Thermo Scientific Sorvall ultracentrifuge (Thermo Fisher Scientific, Waltham, MA) operating at 445,760 g for 140 minutes at 37 °C was employed. A 50 μL volume of both centrifuged (upper, clear layer) and uncentrifuged samples were taken into 50 μL ACN and 10 μL 710 nM itraconazole-d5 was added as an internal standard. The mixtures were centrifuged at 16,100 g for 10 minutes and the supernatant was analyzed as previously described23 using a Waters Micromass Platform LCZ: Quadrupole Mass Spectrometer QMS (Waters, Milford, MA) operated on the positive ion electrospray mode. Ions monitored were m/z 705 for itraconazole and m/z 712 for D5 –labeled itraconazole. The compounds were separated by a Waters Alliance 2690 Analytical HPLC using an Agilent Zorbax XDB-C8 5 μm column (2.1 mm i.d. × 50 mm; Agilent Technologies, Palo Alto, CA) and gradient elution (0.25 mL/min) from 60% aqueous 5 mM ammonium acetate and 40% ACN to 70% ACN over 3 minutes followed by increases to 85% over 1 minute and to 95% ACN over 1 minute.
Inhibition of 6β-hydroxycortisol and 6β-hydroxycortisone formation by itraconazole in vivo
Six healthy adult subjects (one female and five males; age range of 22-42 years (mean 34 years), and within 20% of optimal body mass index participated in the study. The clinical protocol has been described in detail previously20. Individuals with a CYP3A5*1 allele were excluded from the study. CYP3A4 activity was analyzed in four sessions: a control session and three sessions with escalating itraconazole doses (50, 200, 400 mg) separated by a two week washout between sessions. Itraconazole was administered approximately at 7:30 am. As an independent CYP3A4 activity measure, subjects received a single 2 mg oral dose of midazolam at 11:30 am, 4 hours after itraconazole doses. Blood samples (5 mL) were collected into heparinized tubes at 0, 4.5, 5, 6, 7, 8, 10, 12, 16 and 24 h in each session with the 16 hour point lacking in the control session, and additionally at 48, 96 and 168 hours after 400 mg dosing of itraconazole. Plasma was isolated from blood by centrifugation. Urine samples were obtained at 24 h (approximately 7:30 am to 7:30 am) before and 12 (7:30 am – 7:30 pm) and 12-24 h (7:30 pm – 7:30 am) after itraconazole dosing and the volume of the urine was recorded. In addition, urine was collected for three additional 24 hour intervals, 24-48, 72-96 and 120-144 hours after 400 mg itraconazole dose together with plasma samples obtained at the end of the urine collection interval. The plasma and urine samples were stored at -20 °C until analysis. The effect of itraconazole on MDZ clearance has been previously reported20.
Pharmacokinetic analysis
Several different in vivo CYP3A4 activity metrics were evaluated. For cortisol and cortisone, plasma AUC over a 24 hour interval was obtained using the linear trapezoidal method. 6β-hydroxycortisol and 6β-hydroxycortisone formation clearance were then calculated from equation 1.
| (1) |
where which A is the total amount of 6β-hydroxy metabolite in urine during the 24 hour urine collection and AUC(X) is the area under the plasma concentration time curve of cortisol or cortisone during the urine collection interval. The combined CLf of 6β-hydroxycortisol and 6β-hydroxycortisol was calculated from the sum of cortisol and cortisone and the sum of 6β-hydroxycortisol and 6β-hydroxycortisone according to equation 2:
| (2) |
The plasma concentration measured at the end of the urine collection interval was evaluated as a surrogate for cortisol and cortisone AUC according to equation 3:
| (3) |
in which A is the amount of the 6β-hydroxy metabolite or their sum excreted in urine during the 24 hour urine collection; [X] is the plasma concentration of cortisol, cortisone or their combination at the end of the 24-hour urine collection; and time is equal to 24-hours. Mathematically, this method assumes that the endpoint concentrations reflect the average concentration during the 24-hour interval. The urinary ratio between cortisol and 6β-hydroxycortisol was also calculated using the amounts of both compounds excreted.
Determination of in vivo IC50 and 6β-hydroxylation fm
The in vivo IC50 for itraconazole was calculated using GraphPad Prism (La Jolla, CA) as described previously20. The ratio of CLf under inhibited (CLin) and control (CL) conditions was calculated for all subjects in four sessions. IC50 and Emax were then obtained by fitting the dose-response (inhibition) model to the data according to equation 4
| (4) |
where CLin/CL is a function of the total log itraconazole Cave and Emax represented by (CLin/CL)min. The maximum inhibition is taken to be the fm, assuming that all CYP3A4 is inhibited.
Data and Statistical analysis
The Km, Vmax, and CLint for 6β-hydroxycortisol and 6β-hydroxycortisone formation in CYP3A4 and CYP2B6 supersomes were obtained by fitting the Michaelis–Menten equation to the data using GraphPad Prism (La Jolla, CA). The IC50 values were obtained using sigmoid dose-response (inhibition) model. Data are expressed as mean±SD. Statistical analysis was performed with Excel (Microsoft Office 2007, Redmond, Washington). A paired t-test was used to evaluate the significance of the average change in cortisol and cortisone kinetics between control, 50 mg, 200 mg and 400 mg study sessions. A two-tailed p-value ≤ 0.017 was considered significant based on a Bonferroni correction (0.05/3) for multiple comparisons.
Acknowledgments
This work was supported in part by NIH grants P01GM32165 and T32GM007750 and the Clinical and Translational Science Award (CTSA) UL1 RR025014. ChiChi Peng was supported by the Elmer M. and Joy B. Plein Fellowship for the research and teaching training grant at the School of Pharmacy, University of Washington.
The authors wish to thank Ms Angela Hein for her assistance in study coordination and Dr. Weili Huang for her work in developing the cortisol, cortisone and the 6β-metabolite assays.
References
- 1.Watkins PB. Noninvasive tests of CYP3A enzymes. Pharmacogenetics. 1994;4(4):171–84. doi: 10.1097/00008571-199408000-00001. [DOI] [PubMed] [Google Scholar]
- 2.Wilkinson GR. Cytochrome P4503A (CYP3A) metabolism: prediction of in vivo activity in humans. J pharmacokinet biopharm. 1996;24(5):475–90. doi: 10.1007/BF02353475. [DOI] [PubMed] [Google Scholar]
- 3.Lütjohann D, Marinova M, Schneider B, Oldenburg J, von Bergmann K, Bieber T, Björkhem I, Diczfalusy U. 4beta-hydroxycholesterol as a marker of CYP3A4 inhibition in vivo - effects of itraconazole in man. Int J Clin Pharmacol Ther. 2009;47(12):709–15. doi: 10.5414/cpp47709. [DOI] [PubMed] [Google Scholar]
- 4.Ged C, Rouillon JM, Pichard L, Combalbert J, Bressot N, Bories P, Michel H, Beaune P, Maurel P. The increase in urinary excretion of 6.beta.-hydroxycortisol as a marker of human hepatic cytochrome P450IIIA induction. Br J Clin Pharmacol. 1989;28(4):373–87. doi: 10.1111/j.1365-2125.1989.tb03516.x. [DOI] [PMC free article] [PubMed] [Google Scholar]
- 5.Borin M, Chambers J, Carel B, Gagnon S, Freimuth W. Pharmacokinetic study of the interaction between rifampin and delavirdine mesylate. Clin Pharmacol Ther. 1997;61(5):544–53. doi: 10.1016/S0009-9236(97)90134-X. [DOI] [PubMed] [Google Scholar]
- 6.Saima S, Furuie K, Yoshimoto H, Fukuda J, Hayashi T, Echizen H. The effects of rifampicin on the pharmacokinetics and pharmacodynamics of orally administered nilvadipine to healthy subjects. Br J Clin Pharmacol. 2002;53(2):203–206. doi: 10.1046/j.0306-5251.2001.01545.x. [DOI] [PMC free article] [PubMed] [Google Scholar]
- 7.Roby CA, Anderson GD, Kantor E, Dryer DA, Burstein AH. St John’s Wort: effect on CYP3A4 activity. Clin Pharmacol Ther. 2000;67(5):451–457. doi: 10.1067/mcp.2000.106793. [DOI] [PubMed] [Google Scholar]
- 8.Fleishaker JC, Pearson PG, Wienkers LC, Pearson LK, Peters GA. Biotransformation of Tirilazad in Human: 2. Effect of Ketoconazole on Tirilazad Clearance and Oral Bioavailability. J Pharmacol Exp Ther. 1996;277:991–998. [PubMed] [Google Scholar]
- 9.Ushiama H, Echizen H, Nachi S, Ohnishi A. Dose-dependent inhibition of CYP3A activity by clarithromycin during Helicobacter pylori eradication therapy assessed by changes in plasma lansoprazole levels and partial cortisol clearance to 6beta-hydroxycortisol. Clin Pharmacol Ther. 2002;72(1):33–43. doi: 10.1067/mcp.2002.125559. [DOI] [PubMed] [Google Scholar]
- 10.Konishi H, Takenaka A, Minouchi T, Yamaji A. Impairment of CYP3A4 capacity in patients receiving danazol therapy: examination on oxidative cortisol metabolism. Horm Metab Res. 2001;33(10):628–630. doi: 10.1055/s-2001-17912. [DOI] [PubMed] [Google Scholar]
- 11.Micuda S, Hodac M, Sispera L, Parízek P, Pleskot M, Zimova G, Cerman J, Martínková J, Pidrman V. Influence of amiodarone on urinary excretion of 6beta-hydroxycortisol in humans. Physiol Res. 2001;50(2):191–6. [PubMed] [Google Scholar]
- 12.Gass R, Gal J, Fogle P, Detmar-Hanna D, Gerber J. Neither dapsone hydroxylation nor cortisol 6beta-hydroxylation detects the inhibition of CYP3A4 by HIV-1 protease inhibitors. Eur J Clin Pharmacol. 1998;54(9-10):741–7. doi: 10.1007/s002280050545. [DOI] [PubMed] [Google Scholar]
- 13.Furuta T, Suzuki A, Mori C, Hibasaki H, Yokokawa A, Kasuya Y. Evidence for the validity of cortisol 6.beta.-hydroxylation clearance as a new index for in vivo cytochrome P450 3A phenotyping in humans. Drug Metab Dispos. 2003;31(11):1283–1287. doi: 10.1124/dmd.31.11.1283. [DOI] [PubMed] [Google Scholar]
- 14.Tomlinson JW, Walker EA, Bujalska IJ, Draper N, Lavery GG, Cooper MS, Hewison M, Stewart PM. 11β-Hydroxysteroid Dehydrogenase Type 1: A Tissue-Specific Regulator of Glucocorticoid Response. Endocr Rev. 2003;25(5):831–866. doi: 10.1210/er.2003-0031. [DOI] [PubMed] [Google Scholar]
- 15.Abel SM, Maggs JL, Back DJ, Park BK. Cortisol metabolism by human liver in vitro. I. Metabolite identification and inter-individual variability. J Steroid Biochem Mol Biology. 1992;43(7):713–19. doi: 10.1016/0960-0760(92)90297-v. [DOI] [PubMed] [Google Scholar]
- 16.Abel SM, Back DJ. Cortisol metabolism in vitro-III. Inhibition of microsomal 6.beta.-hydroxylase and cytosolic 4-ene-reductase. J Steroid Biochem Mol Biology. 1993;46(6):827–32. doi: 10.1016/0960-0760(93)90325-q. [DOI] [PubMed] [Google Scholar]
- 17.Sai Y, Dai R, Yang T, Krausz K, Gonzalez F, Gelboin H, Shou M. Assessment of specificity of eight chemical inhibitors using cDNA-expressed cytochromes P450. Xenobiotica. 2000;30(4):327–43. doi: 10.1080/004982500237541. [DOI] [PubMed] [Google Scholar]
- 18.Katz FH, Lipman MM, Frantz AG, Jailer JW. The physiologic significance of 6.beta.-hydroxycortisol in human corticoid metabolism. J Clin Endocrinol Metab. 1962;22:71–7. doi: 10.1210/jcem-22-1-71. [DOI] [PubMed] [Google Scholar]
- 19.Tomlinson JW, Stewart PM. Cortisol metabolism and the role of 11beta-hydroxysteroid dehydrogenase. Clin Endocrinol Metab. 2001;15(1):61–78. doi: 10.1053/beem.2000.0119. [DOI] [PubMed] [Google Scholar]
- 20.Templeton I, Peng C-C, Thummel KE, Davis C, Kunze KL, Isoherranen N. Accurate Prediction of Dose-Dependent CYP3A4 Inhibition by Itraconazole and Its Metabolites From In Vitro Inhibition Data. Clin Pharmacol Ther. 2010;88(4):499–505. doi: 10.1038/clpt.2010.119. [DOI] [PMC free article] [PubMed] [Google Scholar]
- 21.Huang W, Kalhorn TF, Baillie M, Shen DD, Thummel KE. Determination of free and total cortisol in plasma and urine by liquid chromatography-tandem mass spectrometry. Ther Drug Monitoring. 2007;29(2):215–224. doi: 10.1097/FTD.0b013e31803d14c0. [DOI] [PubMed] [Google Scholar]
- 22.Nakai D, Kumamoto K, Sakikawa C, Kosaka T, Tokui T. Evaluation of the protein binding ratio of drugs by a micro-scale ultracentrifugation method. J Pharm Sci. 2004;93(4):847–854. doi: 10.1002/jps.20012. [DOI] [PubMed] [Google Scholar]
- 23.Isoherranen N, Kunze KL, Allen KE, Nelson WL, Thummel KE. Role of itraconazole metabolites in CYP3A4 inhibition. Drug Metab Dispos. 2004;32(10):1121–1131. doi: 10.1124/dmd.104.000315. [DOI] [PubMed] [Google Scholar]