

The plasma and tumor dispositions of a commonly used antimelanoma agent, carboplatin, were evaluated in patients with cutaneous melanoma and compared with four different murine melanoma models (one genetically engineered mouse model, one human cell line xenograft, and two orthotopic syngeneic transplant models). The tumor pharmacokinetics of carboplatin in the a genetically engineered mouse model most closely resembled the tumor disposition in patients with melanoma.
Keywords: GEMM, Microdialysis, Carboplatin pharmacokinetics, Mouse tumor models, Melanoma models, Genetically engineered mouse models
Abstract
Background.
Rodent studies are a vital step in the development of novel anticancer therapeutics and are used in pharmacokinetic (PK), toxicology, and efficacy studies. Traditionally, anticancer drug development has relied on xenograft implantation of human cancer cell lines in immunocompromised mice for efficacy screening of a candidate compound. The usefulness of xenograft models for efficacy testing, however, has been questioned, whereas genetically engineered mouse models (GEMMs) and orthotopic syngeneic transplants (OSTs) may offer some advantages for efficacy assessment. A critical factor influencing the predictability of rodent tumor models is drug PKs, but a comprehensive comparison of plasma and tumor PK parameters among xenograft models, OSTs, GEMMs, and human patients has not been performed.
Methods.
In this work, we evaluated the plasma and tumor dispositions of an antimelanoma agent, carboplatin, in patients with cutaneous melanoma compared with four different murine melanoma models (one GEMM, one human cell line xenograft, and two OSTs).
Results.
Using microdialysis to sample carboplatin tumor disposition, we found that OSTs and xenografts were poor predictors of drug exposure in human tumors, whereas the GEMM model exhibited PK parameters similar to those seen in human tumors.
Conclusions.
The tumor PKs of carboplatin in a GEMM of melanoma more closely resembles the tumor disposition in patients with melanoma than transplanted tumor models. GEMMs show promise in becoming an improved prediction model for intratumoral PKs and response in patients with solid tumors.
Introduction
Rodent studies are a vital step in the development of novel anticancer therapeutics and are employed to study the pharmacokinetics (PKs), pharmacodynamics, toxicology, and efficacy of potential anticancer agents. Rodent models of cancer include xenograft models (transplant of cells from one species into another species, e.g., human into mouse), orthotopic syngeneic transplant (OST) models (orthotopic transplant of syngeneic passaged tumor cells into the relevant tissue of genetically identical recipients), and genetically engineered mouse models (GEMMs), in which tumors arise autochthonously. Traditionally, the standard anticancer drug development pipeline has relied on xenograft implantation of human cancer cell lines in immunocompromised mice as the primary in vivo screen to determine initial PKs, safety, efficacy, and mechanism of action of a candidate compound. However, with too few predictable achievements and many notable failures, the usefulness of xenograft models for determining the therapeutic activity of a novel compound has begun to be questioned [1–4]. More recently, the use of cancer GEMMs is gaining popularity as an alternative to xenograft models for biological and therapeutic investigation. Although GEMMs are proven tools for elucidating the molecular determinants of tumor genesis, their ability to predict an agent's clinical activity is less clear, but some studies have shown notable successes [5–8].
There are several relevant physiological differences among GEMMs, OSTs, and xenograft tumors with regard to their utility in efficacy testing. For example, in contrast to xenograft models, OST and GEMM tumors occur in animals with an intact immune system and unperturbed DNA repair mechanisms. Additionally, because GEMMs rely on the accumulation of stochastic genetic events for tumor progression, these models may better recapitulate the stepwise progression and tumor heterogeneity of human solid tumors. Furthermore, because cancers occur autochthonously in these models, GEMMs accurately maintain the physiologic tumor–stroma interactions found in human cancer. Throughout the processes of tumor initiation, progression, and maintenance, the microenvironment plays a critical role in tumor development [9, 10]. Additional differences include the relationship between host and tumor cells, tumor vascularity, capillary permeability, and tumor interstitial pressure.
These differences between tumor development in xenografts and GEMMs have been suggested to explain differences observed in the role of hypoxia and inhibitor of DNA-binding/differentiation (Id) proteins in tumor angiogenesis [11, 12], which may have important implications for drug delivery and response. Similarly, differences in the gene expression of tumor-associated macrophages (TAMs) in xenograft versus GEMMs have been observed [13]. In the context of evaluating drug response, these differences are likely to have a significant impact because TAMs have been suggested to augment tumor angiogenesis, invasion, and matrix remodeling, modulate drug delivery, and modulate the host antitumor immune response. Given these multiple differences in the reaction of diverse stromal elements, the ability to more faithfully model the stroma–tumor interaction appears to be a particular strength of GEMMs over xenograft assays. OST models have not been as well characterized, and their predictive ability compared with those of GEMMs and xenografts is an area of ongoing investigation.
Given these important differences among these various preclinical models, we tested the ability of xenograft models, OST models, and GEMMs of melanoma to accurately recapitulate the tumor disposition of carboplatin, a widely used anticancer agent with activity in melanoma. The use of microdialysis probes placed within tumors allowed us to evaluate the concentration-versus-time profile of carboplatin within each individual tumor in patients and animal models following i.v. administration of carboplatin. Results from these tumor models were compared with tumor disposition of carboplatin in human patients with cutaneous melanoma. This strategy allowed for a determination of which preclinical murine models best predicted intratumoral carboplatin PKs in humans.
Materials and Methods
Mice
All mice were handled in accordance with the National Research Council's Guide to the Care and Use of Laboratory Animals (1996), and studies were approved by the Institutional Animal Care and Use Committee at the University of North Carolina (UNC) at Chapel Hill. Four mouse models of melanoma were used for this study including a tyrosinase-H-RasG12V INK4A−/−/ARF−/− (TRIA) GEMM of melanoma (on an FVB/N background) [14], a TRIA OST mouse model (TRIA tumor cells implanted into the flank of male FVB/N mice), a B16 murine melanoma OST model, and an A375 xenograft model. The term OST is defined in this study as a mouse melanoma cell line implanted into an immunocompetent mouse and is used to distinguish from a true xenograft. C57BL/6 mice (Jackson Laboratory, Bar Harbor, ME) were used for the B16 murine melanoma OST model. FVB/N mice (Jackson Laboratory) were used for the TRIA OST model. NU-Foxn1nu homozygous (nu/nu) immunodeficient mice were used for the A375 xenograft model (Charles River, Wilmington, MA). All mice were allowed to acclimate to the animal facilities at UNC for 1 week prior to initiation of the study. All mice were housed in microisolator cages and allowed Teklad LM-484 autoclavable rodent chow (Harlan Tekla Diets, Madison, WI) or ISDPRO RMH3000 irradiated rodent chow (PMI Nutrition International, Inc., Brentwood, MO) and water ad libitum. Tumor size and body weight were determined twice weekly and clinical observations were made twice daily.
Tumor Lines and GEMM Tumors
B16 murine melanoma cells and A375 human melanoma cells were obtained from the American Type Culture Collection. The TRIA cell line was described previously and was grown under routine sterile cell culture conditions until subconfluent [15]. B16 and TRIA tumor cells were grown in Dulbecco's Modified Eagle Medium (Life Technologies, Grand Island, NY), supplemented with 10% heat-inactivated fetal bovine serum, and incubated at 37°C in 5% CO2. Cells were allowed to grow to 80% confluence and were harvested with 0.25% trypsin/1 mM EDTA. In total, 2 × 10⁶ cells in 200 μL were implanted s.c. into the right flank of C57BL/6, FVB, and nu/nu mice. The size of the tumor and rate of growth were monitored by calipers until reaching the desired size (1,000–1,500 mm3) for inclusion in the study. Tumor volume was calculated using the equation: length × (width)2/2, where length is the largest diameter and width is the smallest diameter perpendicular to the length. In all models, PK and microdialysis studies were performed when tumors were ∼1,000–1,500 mm3 in size.
Plasma and Tumor PK Studies in Mice
Carboplatin was administered at 50 mg/kg i.v. × 1 via the tail vein to all mouse models. Because of limited blood volume, plasma and plasma ultrafiltrate PK studies were performed in one cohort of mice and microdialysis studies were performed in a separate cohort of mice, matched for strain, age, sex, and weight. For plasma PK studies of the B16 OST model, blood samples (n = 3 mice at each time point) were collected at 0, 0.083, 0.25, 0.5, 0.75, 1, 1.5, 2, 4, 6, 17, and 24 hours after administration. For plasma PK studies of the A375 xenograft model, GEMM, and TRIA OST model, blood samples (n = 3 mice at each time point) were collected at 0, 0.083, 0.5, 1, 3, and 6 hours after administration. Sample collection was changed following the B16 OST plasma PK studies to preserve mice because plasma levels at hours 17 and 24 were virtually undetectable. Additionally, other sample time points that did not provide added value in estimating the PK parameters were eliminated. For all studies, blood samples were collected via cardiac puncture in lithium-heparin tubes and centrifuged at 1,200g at 4°C × 15 minutes. A 150-μL aliquot of the resulting plasma was ultrafiltered by centrifuging in Amicon Centrifree micropartition devices (Amicon Division, W.R. Grace, Beverly, MA) at 2,000g at 20°C × 30 minutes as described by our lab previously [16]. Plasma ultrafiltrate and plasma samples were snap frozen in liquid nitrogen and then stored at −80°C until analyzed.
For the microdialysis studies, a total of six mice were analyzed for each mouse model of melanoma, except for the A375 xenograft model, for which seven mice were analyzed. Prior to administration of carboplatin, mice were weighed and anesthetized with ketamine/medetomidine at 100/1 mg/kg and monitored throughout the experiment by UNC veterinary technicians. Commercially available microdialysis probes (CMA20, Stockholm, Sweden) with a molecular cutoff of 20 kDa, membrane length of 4 mm, and outer diameter of 0.5 mm were used [16]. The molecular cutoff of the 20-kDa probe allowed only protein-unbound platinum (Pt) to cross the semipermeable membrane. Microdialysis probes were inserted ∼6 mm into the tumor, held in place with surgical glue, and allowed to equilibrate with the surrounding tumor extracellular fluid (ECF) for 45 minutes prior to carboplatin administration (Fig. 1). Carboplatin was then i.v. administered at 50 mg/kg × 1 via the tail vein in all mouse models. Tumor ECF samples were collected every 40 minutes from 0–4 hours. The samples collected were in tumor ECF and were defined as protein-unbound Pt, which is the active form. The microdialysis probe was perfused using a microdialysis microperfusion pump (CMA 102; CMA, Stockholm, Sweden) at a flow rate of 2 μL/minute. Iridium (Ir) (1,000 ng/mL) in phosphate-buffered saline was used as the marker compound to determine in vivo recovery for all mouse models. Dialysate samples were collected using a microfraction collector (CMA 142; CMA, Stockholm, Sweden).
Figure 1.
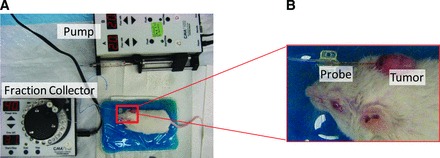
Depiction of in vivo microdialysis setup. (A): Microdialysis pump, fraction collector robot, and test animal. (B): Close-up view of microdialysis probe placement in a tyrosinase-H-RasG12V INK4A−/−/ARF−/− genetically engineered mouse model ear tumor.
Ir was determined to be an appropriate microdialysis recovery standard for carboplatin where Pt was the analyte of interest because of the similar molecular weight relationship between Ir (192 g/mol) and Pt (195 g/mol). Ir concentrations were measured from the perfusate pump syringes and were used to calculate Ir loss fraction. Corrected Pt concentrations in mice tumor ECF were calculated by the equation:
Where Ir loss fraction = (Ir measured from syringe − Ir recovered in sample)/Ir measured in pump syringe.
Four hours was determined to be the most feasible sample duration because it was difficult to keep mice anesthetized for longer periods of time and limited drug exposure in tumors remained after 4 hours. Probe placement was visually confirmed at necropsy to ensure that the probe was entirely within the tumor.
The Pt concentration measured in each tumor ECF sample was the average concentration of the collection interval, and thus the midpoint of that interval was used to calculate PK parameters (20 minutes was used for a sample collected from 0–40 minutes). All microdialysis samples were stored at 4°C until analyzed for Pt by inductively coupled plasma mass spectrometry (ICP-MS).
Sample Processing and Analysis
For all mouse models, 50 μL plasma and plasma ultrafiltrate were added to a 70% nitric acid (HNO3) solution containing a 200-ng/mL solution of Ir as the analytical internal standard. In the microdialysis studies, 50 μL tumor ECF sample was added to 70% HNO3 with indium used as the internal standard because Ir was used as the microdialysis recovery standard. The samples were heated at 90°C for 30 minutes. Two milliliters 2% HNO3 was then added to the samples. The samples were analyzed via ICP-MS as described previously [17]. The lower limit of detection of Pt of all forms in plasma and tumor ECF was 0.1 ng/mL.
Plasma and Tumor ECF PK Studies in Patients
The data in our current study are expanded from the first study in patients performed by Blöchl-Daum et al. [18]. Briefly, patients (n = 6) with cutaneous metastatic melanoma were treated with carboplatin at a dose of 400 mg/m2 i.v. over 20 minutes on day 1 of cycle 1. Plasma PK studies and microdialysis were completed within the same patients. Three-milliliter blood samples were collected prior to administration and at 0.25, 0.5, 0.75, 1, 1.25, 1.5, 1.75, 2, 2.25, 2.5, 2.75, 3, 3.25, 3.5, 3.75, and 4 hours after the start of the infusion. Tumor ECF samples were collected every 15 minutes for 4 hours. Plasma samples were processed for the determination of total Pt concentration as described previously using flameless atomic absorption spectroscopy (FAAS) [19, 20]. Microdialysis was used to evaluate the disposition of Pt in tumor ECF using a CMA 10 (CMA, Stockholm, Sweden) microdialysis probe with a molecular cutoff of 20 kDa, outer diameter of 500 μm, and membrane length of 16 mm. A precision infusion pump (Precidor; Ilfors-AG, Basle, Switzerland) with Ringer's solution as the perfusion fluid at a flow rate of 1.5 μL/minute was used to obtain samples at every 15 minutes for 4 hours. The unbound Pt in tumor ECF was measured using FAAS.
PK Analysis
A noncompartmental PK analysis was performed for all tissues in both animal and human melanoma models using WinNonlin Software, version 5.0 (Pharsight Corp., Mountain View, CA). The Pt area under the concentration versus time curve from time 0 to the last measured concentration (AUC0–last) and to infinity (AUC0–∞) were calculated for carboplatin in plasma and tumor ECF. Clearance, volume of distribution, elimination rate (ke), and elimination half-life (t1/2) were also calculated for plasma, plasma ultrafiltrate, and tumor ECF using standard equations. WinNonlin preset programming selected the terminal elimination phase and was used to extrapolate from the last measurable concentration (tlast) to infinity. Tumor penetration was calculated as the ratio of tumor ECF Pt AUC0–last to plasma total Pt AUC0–last and to plasma ultrafiltrate Pt AUC0–∞. In addition to comparing the unscaled PK parameters between mouse models and patients, we also compared allometrically scaled PK parameters. Allometric scaling is a technique used to extrapolate the first-in-human dose during drug development when only animal PK data are available, as well as to compare the disposition of drugs across species [21]. Allometric scaled data were calculated based on the Dedrick time equivalent model [22]. Using standard methods, plasma and tumor concentrations were normalized by dividing by dose in mg/kg, which allows appropriate plot scaling between mice and humans [21]. In addition, using standard methods, time was normalized by dividing actual time by body weight0.25, where 0.25 represents a constant for the conversion from chronological to physiological time.
Statistical Analysis
Descriptive statistics, including the mean ± standard deviation (SD), were performed on plasma and tumor ECF PK parameters of carboplatin in mouse models and in patients with cutaneous melanoma. PK parameters were evaluated with t tests to determine if mouse model PK parameters differed significantly from patient AUC when unscaled and allometrically scaled. Statistical significance was defined as a p-value < .05. All statistical analyses were performed using SAS software, version 9.1 (SAS Institute, Cary, NC).
Results
Mouse Model Plasma PKs
We evaluated the plasma and tumor dispositions of carboplatin in four murine models of melanoma compared with those in patients with cutaneous melanoma. The models used in this analysis were the A375 human melanoma cell line xenografted into SCID (NU-Foxn1nu) mice, the B16 murine melanoma cell line transplanted into syngeneic C57BL/6 mice (OST model), TRIA cell lines transplanted into syngeneic FVB/n mice (OST model), and autochthonous TRIA tumors on an FVB/n background (GEMM). The SCID mice lack normal B- and T-lymphocyte function, whereas OST and GEMM mice are immunocompetent. The mean unscaled Pt concentration-versus-time profiles of plasma and plasma ultrafiltrate for each mouse strain and for patients are presented in Figure 2. Additionally, the unscaled plasma PK parameters calculated for each cohort are presented in Table 1.
Figure 2.
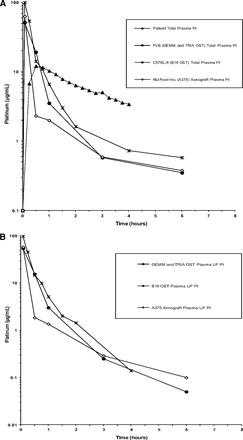
Mean unscaled concentration-versus-time profiles in mouse models of melanoma and patients with cutaneous melanoma. (A): Total Pt in plasma. (B): UF Pt in plasma.
Abbreviations: GEMM, genetically engineered mouse model; OST, orthotopic syngeneic transplant; Pt, platinum; TRIA, tyrosinase-H-RasG12V INK4A−/−/ARF−/−; UF, ultrafiltrate.
Table 1.
PK parameters of Pt after intravenous administration of carboplatin in different models of melanoma
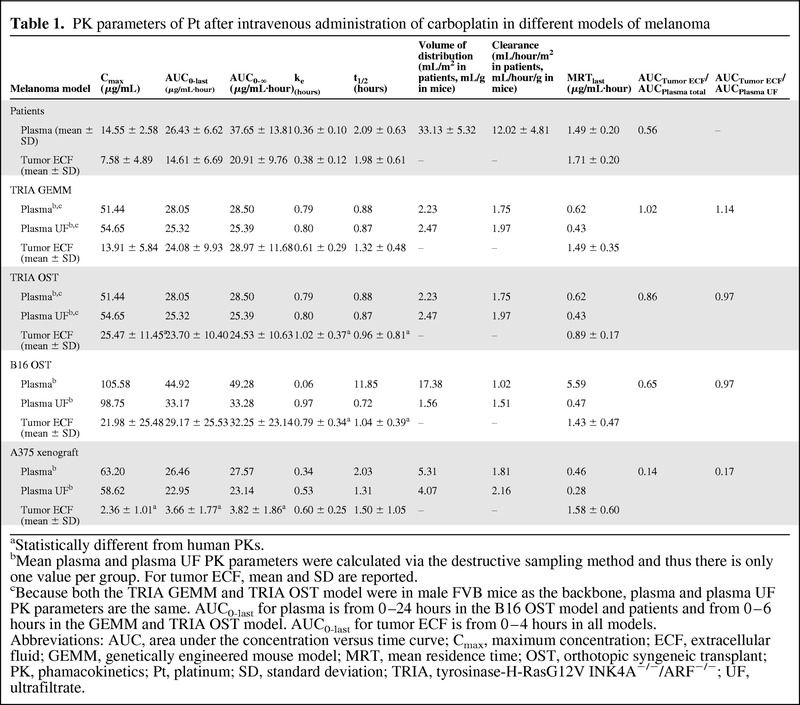
aStatistically different from human PKs.
bMean plasma and plasma UF PK parameters were calculated via the destructive sampling method and thus there is only one value per group. For tumor ECF, mean and SD are reported.
cBecause both the TRIA GEMM and TRIA OST model were in male FVB mice as the backbone, plasma and plasma UF PK parameters are the same. AUC0-last for plasma is from 0–24 hours in the B16 OST model and patients and from 0–6 hours in the GEMM and TRIA OST model. AUC0-last for tumor ECF is from 0–4 hours in all models.
Abbreviations: AUC, area under the concentration versus time curve; Cmax, maximum concentration; ECF, extracellular fluid; GEMM, genetically engineered mouse model; MRT, mean residence time; OST, orthotopic syngeneic transplant; PK, phamacokinetics; Pt, platinum; SD, standard deviation; TRIA, tyrosinase-H-RasG12V INK4A−/−/ARF−/−; UF, ultrafiltrate.
The total (protein bound and protein unbound) Pt maximum concentration (Cmax) values in plasma of NU-Foxn1nu, C57BL/6, and FVB/N (representing both the TRIA GEMM and OST models) were 63.2 μg/mL, 105.6 μg/mL, and 51.4 μg/mL, respectively. The total Pt AUC0–last values in plasma of NU-Foxn1nu, C57BL/6, and FVB/N were 26.5 μg/mL·hour, 44.9 μg/mL·hour, and 28.1 μg/mL·hour, respectively. The plasma ultrafiltrate (protein unbound) Pt concentration-versus-time profile and PK parameters were very similar to the total plasma Pt because the majority of the Pt was not bound to proteins in systemic circulation (Fig. 2B, Table 1).
Mouse Model Tumor Carboplatin Disposition
Microdialysis is an in vivo sampling technique used to study PKs and drug metabolism in the blood and ECF of various tissues [23–25] and is based on the diffusion of nonprotein-bound drugs from interstitial fluid across the semipermeable membrane of the microdialysis probe [23–25]. Microdialysis provides a means to obtain serial samples from tumor ECF, from which a concentration-versus-time profile can be determined within a single tumor [18, 23, 26]. Using the microdialysis technique, the tumor carboplatin disposition in all mouse models was measured (Fig. 1). The mean unscaled Pt concentration-versus-time profiles of tumor ECF for all models of melanoma are presented in Figure 3. Individual concentration-versus-time profiles of tumor ECF in all melanoma models in relation to the mean total plasma Pt concentration-versus-time curves are presented in Figure 4. The mean ± SD Pt Cmax values in tumor ECF for the A375 xenograft model, B16 OST model, TRIA OST model, and GEMM were 2.4 ± 1.0 μg/mL, 22.0 ± 25.5 μg/mL, 25.5 ± 11.5 μg/mL, and 13.9 ± 5.8 μg/mL, respectively. The Pt AUC0–last values in tumor ECF for the A375 xenograft model, B16 OST model, TRIA OST model, and GEMM were 3.7 ± 1.8 μg/mL·hour, 29.2 ± 25.5 μg/mL·hour, 23.7 ± 10.4 μg/mL·hour, and 24.1 ± 9.9 μg/mL·hour, respectively. Tumor ECF AUC and Cmax values were similar across groups, except for the A375 mouse model.
Figure 3.
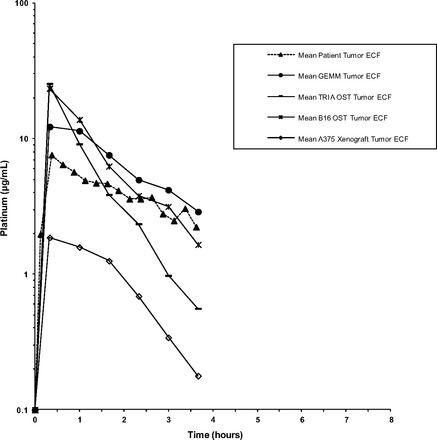
Mean unscaled concentration-versus-time profiles of tumor ECF Pt in mouse models of melanoma and patients with cutaneous melanoma. In total, six mice were evaluated for each mouse model of melanoma, except for the A375 xenograft model, for which seven mice were analyzed. Plasma samples from 6 patients were evaluated.
Abbreviations: ECF, extracellular fluid; GEMM, genetically engineered mouse model; OST, orthotopic syngeneic transplant; Pt, platinum; TRIA, tyrosinase-H-RasG12V INK4A−/−/ARF−/−.
Figure 4.
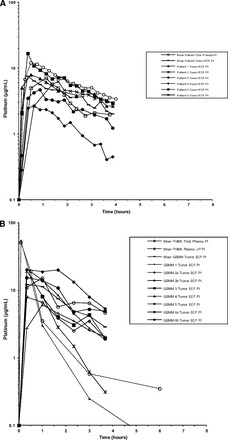
Mean and individual concentration-versus-time profiles of plasma Pt and tumor ECF Pt. (A): Patients with cutaneous melanoma. (B): TRIA GEMMs. (C): TRIA OSTs. (D): B16 OSTs. (E): A375 xenograft tumors.
Abbreviations: ECF, extracellular fluid; GEMM, genetically engineered mouse model; OST, orthotopic syngeneic transplant; Pt, platinum; TRIA, tyrosinase-H-RasG12V INK4A−/−/ARF−/−; UF, ultrafiltrate.
Figure 4.
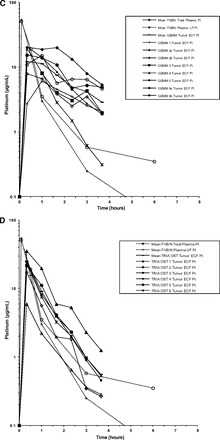
Continued.
Figure 4.

Continued.
Patient Plasma and Tumor PKs
In patients with cutaneous melanoma, the mean ± SD unscaled total Pt Cmax in plasma was 14.6 ± 2.6 μg/mL. The mean unscaled Pt AUC0–last in tumor ECF was 26.4 ± 6.6 μg/mL·hour. The ratios of A375 xenograft, B16 OST, TRIA OST, and GEMM tumor ECF Pt Cmax to patient tumor ECF Pt Cmax were 0.3, 2.9, 3.4, and 1.8, respectively. The ratios of A375 xenograft, B16 OST, TRIA OST, and GEMM tumor ECF Pt AUC0–last to patient tumor ECF Pt AUC0–last were 0.25, 2.00, 1.62, and 1.65, respectively.
Allometrically Scaled Plasma and Tumor PKs
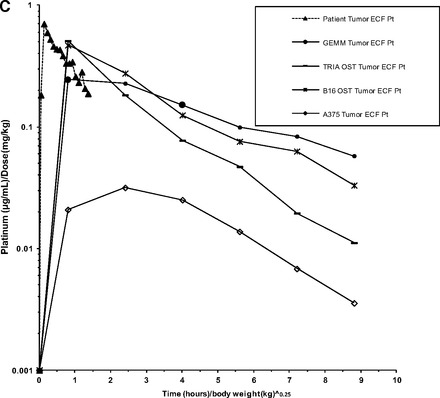
Mean concentration-versus-time curves for allometrically scaled total plasma Pt, plasma ultrafiltrate, and tumor ECF are shown in Figure 5A, 5B, and 5C, respectively. Scaled summary PK data are presented in Table 2. The allometrically scaled total Pt Cmax values in plasma for NU-Foxn1nu, C57BL/6, and FVB/N were 1.26 (μg/mL)/(mg/kg), 2.11 (μg/mL)/(mg/kg), and 1.03 (μg/mL)/(mg/kg), respectively. The allometrically scaled total Pt AUC0–last values in plasma for NU-Foxn1nu, C57BL/6, and FVB/N were 1.27 [(μg/mL)/(mg/kg)]·(hours/kg)], 2.39 [(μg/mL)/(mg/kg)]·(hours/kg)], and 1.35 [(μg/mL)/(mg/kg)]·(hours/kg)], respectively. The mean ± SD allometrically scaled Pt Cmax values in tumor ECF for the A375 xenograft model, B16 OST model, TRIA OST model, and GEMM were 0.05 ± 0.02 (μg/mL)/(mg/kg), 0.44 ± 0.56 (μg/mL)/(mg/kg), 0.43 ± 0.19 (μg/mL)/(mg/kg), and 0.28 ± 0.12 (μg/mL)/(mg/kg), respectively. The allometrically scaled Pt AUC0–last values in tumor ECF for the A375 xenograft model, B16 OST model, TRIA OST model, and GEMM were 0.18 ± 0.85[(μg/mL)/(mg/kg)]·(hours/kg)], 1.40 ± 1.24[(μg/mL)/(mg/kg)]·(hours/kg)], 1.04 ± 0.52[(μg/mL)/(mg/kg)]·(hours/kg)], and 1.16 ± 0.48 [(μg/mL)/(mg/kg)]·(hours/kg)], respectively.
Figure 5.
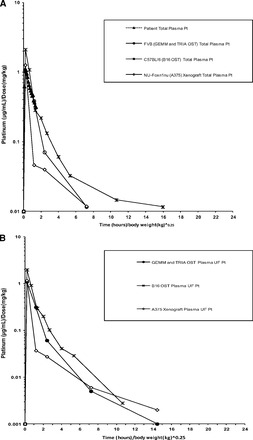
Mean allometrically scaled concentration-versus-time profiles in mouse models of melanoma and patients with cutaneous melanoma. (A): Total plasma Pt. (B): Plasma ultrafiltrate Pt. (C): Tumor ECF Pt.
Abbreviations: ECF, extracellular fluid; GEMM, genetically engineered mouse model; OST, orthotopic syngeneic transplant; Pt, platinum; TRIA, tyrosinase-H-RasG12V INK4A−/−/ARF−/−.
Table 2.
Allometrically scaled PK parameters of Pt after intravenous administration of carboplatin in different models of melanoma
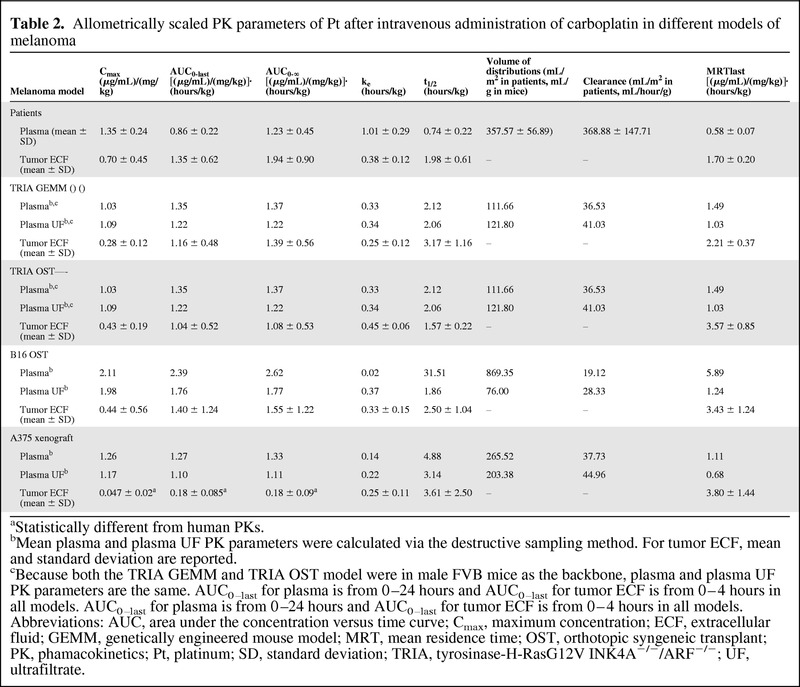
aStatistically different from human PKs.
bMean plasma and plasma UF PK parameters were calculated via the destructive sampling method. For tumor ECF, mean and standard deviation are reported.
cBecause both the TRIA GEMM and TRIA OST model were in male FVB mice as the backbone, plasma and plasma UF PK parameters are the same. AUC0–last for plasma is from 0–24 hours and AUC0–last for tumor ECF is from 0–4 hours in all models. AUC0–last for plasma is from 0–24 hours and AUC0–last for tumor ECF is from 0–4 hours in all models.
Abbreviations: AUC, area under the concentration versus time curve; Cmax, maximum concentration; ECF, extracellular fluid; GEMM, genetically engineered mouse model; MRT, mean residence time; OST, orthotopic syngeneic transplant; PK, phamacokinetics; Pt, platinum; SD, standard deviation; TRIA, tyrosinase-H-RasG12V INK4A−/−/ARF−/−; UF, ultrafiltrate.
Figure 5.
Continued.
In patients with cutaneous melanoma, the mean ± SD allometrically scaled total Pt Cmax in tumor was 0.7 ± 0.45 (μg/mL)/(mg/kg). The mean allometrically scaled Pt AUC0–last in tumor ECF was 1.35 ± 0.62 [(μg/mL)/(mg/kg)]·(hours/kg). The ratios of A375 xenograft, B16 OST, TRIA OST, and GEMM allometrically scaled tumor ECF Pt Cmax to patient tumor ECF Pt Cmax were 0.07 [(μg/mL)/(mg/kg)]·(hours/kg), 0.63 [(μg/mL)/(mg/kg)]·(hours/kg), 0.61 [(μg/mL)/(mg/kg)]·(hours/kg), and 0.40 [(μg/mL)/(mg/kg)]·(hours/kg), respectively. The ratios of A375 xenograft, B16 OST, TRIA OST, and GEMM allometrically scaled tumor ECF Pt AUC0–last to patient tumor ECF Pt AUC0–last were 0.13,1.04, 0.77, and 0.86, respectively.
Statistical Comparison of Mouse Models and Patients
When comparing the tumor ECF PK parameters of Pt in different mouse models with tumor ECF PK parameters of Pt in patients, GEMMs had no PK parameter (allometrically scaled or unscaled) that was significantly different (p < .05) from that of patients. The unscaled and allometrically scaled Pt AUC0–∞, AUC0–last, and Cmax of A375 xenografts were significantly different from those of patients (unscaled: p = .007, .009, and .047, respectively; allometrically scaled: p = .005, .005, and .016, respectively). The mean unscaled Pt ke and t1/2 of B16 OSTs were significantly different from those of patients (p = .04 and .01, respectively). The mean unscaled Pt ke, t1/2, and Cmax of TRIA OSTs were significantly different from those of patients (p = .01, .04, and .02, respectively). No allometrically scaled PK parameters of TRIA or B16 OSTs were significantly different from those of patients.
Discussion
Although multiple differences among GEMMs, OST models, and xenograft models have been described [1–4], there have been no direct comparisons of tumor drug disposition among these models. To date, most of the focus has been on differences in tumor genetics, heterogeneity, and the microenvironment [7, 9–13]. To evaluate potential differences in drug exposure, we evaluated four mouse models of melanoma, representing xenografts (human tumor cells into immunodeficient mice), OSTs (murine cell lines into syngeneic, immunocompetent mice), and GEMMs (de novo tumors studied in situ), and compared their intratumoral drug dispositions with those measured in patients with cutaneous melanoma. As part of the study design, we included two OST models, the B16 OST model and the TRIA OST model. The TRIA OST model was used to control for differences in tumor biology and strain when making comparisons with the TRIA GEMM, and thus allowed us to isolate our analysis to transplanted versus autochthonous tumors.
The allometrically scaled carboplatin plasma PKs of all mouse models and humans were similar (Fig. 5A), suggesting that carboplatin plasma PKs are scalable from mouse to man. Despite this similarity in plasma PKs, the carboplatin concentrations in tumors from the xenograft model (A375) were significantly different from the tumor ECF PKs in the TRIA GEMM and patient melanoma tumors (Fig. 5C). For example, the murine-to-human tumor ECF AUC ratio was 0.13 for the xenograft model, versus 0.86 for the GEMM. The OST results were closer to the human values than those seen in the xenograft model, but the tumor ECF concentration and elimination profile of the GEMM most accurately recapitulated those seen in patients (Fig. 3). It is important to note that no mouse model was able to exactly mirror the human counterpart; however, the GEMM appeared to best approximate human tumor exposure.
Although the objective of the current study was limited to evaluating potential differences in intratumoral drug disposition among mouse models used in preclinical oncology drug development, there are several possible physiological differences among these models that may explain our findings. Particularly, the ability to more faithfully model the stroma–tumor interaction appears to be a considerable strength of GEMMs, which may explain their superior ability to recapitulate tumor drug disposition seen in patients, versus transplanted tumors. It is easy to appreciate that xenograft models do not accurately recapitulate this aspect of cancer biology, because fully transformed cells are injected as a bolus into a stroma that is deranged and disorganized by the ectopic transplant of a large number of foreign cells. In contrast, the neoplastic cells of GEMM tumors form in a stepwise manner in the setting of an appropriately responsive tumor microenvironment, similar to in situ human tumors. Additionally, interactions between tumor cells and various components of the surrounding microenvironment, including inflammatory cells, vascular and lymphatic networks, and the extracellular matrix, are thought to play critical roles in the tumor drug response and, likely, tumor drug disposition [10].
Olive et al. [7] recently showed that pancreatic cancer GEMMs, like human pancreatic cancers, are generally resistant to gemcitabine chemotherapy. In contrast, they found that gemcitabine demonstrated considerable efficacy in a pancreatic OST model established from their GEMM. Upon further investigation, the authors demonstrated that gemcitabine exposure in the tumor correlated with tumor response. GEMM tumors had low exposure and response and OSTs had significantly higher gemcitabine exposure and response. Thus, it was concluded that chemoresistance does not appear to be cell autonomous, because transplantation of cell lines derived from pancreatic cancer GEMMs into a syngeneic flank increased the sensitivity of these tumors to gemcitabine. Instead, the chemoresistance of the autochthonous pancreatic GEMM appears to be a reflection of suboptimal drug delivery into their fibrotic and poorly vascularized tumors.
This result is similar to our results reported here, in that intratumoral drug levels within the GEMM, rather than xenograft tumors, more closely resembled those in patients. However, one important distinction between these two studies is the fact that we found higher drug levels in the GEMM than in the xenograft, whereas, Olive et al. [7] reported lower drug levels in the GEMM than in the xenograft. Although the results from Olive et al. [7] evaluating gemcitabine in pancreatic mouse models and the current study evaluating carboplatin in melanoma mouse models both demonstrate that GEMMs better model intratumoral drug levels, it is unclear if these results can be extrapolated to other drugs and tumor types. Differences in tumor PK results may be a result of the drug (e.g., protein binding with carboplatin), tumor type (pancreatic versus melanoma), or PK measurement (tumor homogenate versus tumor ECF). However, despite these differences, the collective observations suggest that tumor stroma plays an important role in drug delivery and tumor response. In summary, this novel comprehensive analysis of intratumoral PKs suggests dramatic differences between the measured concentrations of an active anticancer agent in murine models and human patients. These data highlight an important limitation of murine models with regard to preclinical efficacy assessment, and ongoing efforts will attempt to determine the physiologic basis for the differences between transplanted and in situ tumors with regard to drug exposure. In particular, these results suggest that GEMMs may be the most faithful predictor of tumor PKs of carboplatin in patients with melanoma. In addition, these studies suggest that ongoing preclinical testing of anticancer agents should be designed with consideration of these models' abilities to represent intratumoral drug disposition in patients with solid tumors.
Acknowledgments
We wish to thank the Lineberger Comprehensive Cancer Center Animal Studies Core at the University of North Carolina for providing their assistance and expertise in performing the animal studies.
This work was supported by the University of North Carolina Lineberger Comprehensive Cancer Center Mouse Phase I Unit and grants from the Golfers Against Cancer Foundation (to N.E.S), the National Institutes of Health (RO1 P01-ES014635) and UO1-CA141576) to N.E.S), the University Cancer Research Fund from the University of North Carolina Lineberger Comprehensive Cancer Center (to N.E.S and W.C.Z), and the American Cancer Society (PF-10–239-01-TBG to P.J.R).
Austin J. Combest and Patrick J. Roberts contributed equally to this work.
Author Contributions
Conception/Design: Austin J. Combest, Patrick J. Roberts, Suzan K. Hanna, Sohrab Habibi, Markus Müller, Martin Brunner, Norman E. Sharpless, William C. Zamboni
Provision of study material or patients: Austin J. Combest, Patrick J. Roberts, Patrick M. Dillon, Suzan K. Hanna, Charlene Ross, Sohrab Habibi, Markus Müller, Martin Brunner, Norman E. Sharpless
Collection and/or assembly of data: Austin J. Combest, Patrick J. Roberts, Patrick M. Dillon, Katie Sandison, Sohrab Habibi
Data analysis and interpretation: Austin J. Combest, Katie Sandison, Sohrab Habibi, Beth Zamboni
Manuscript writing: Austin J. Combest, Patrick J. Roberts, Norman E. Sharpless, William C. Zamboni
Final approval of manuscript: Austin J. Combest, Patrick J. Roberts, Norman E. Sharpless, William C. Zamboni
References
- 1.Sharpless NE, Depinho RA. The mighty mouse: Genetically engineered mouse models in cancer drug development. Nat Rev Drug Discov. 2006;5:741–754. doi: 10.1038/nrd2110. [DOI] [PubMed] [Google Scholar]
- 2.Olive KP, Tuveson DA. The use of targeted mouse models for preclinical testing of novel cancer therapeutics. Clin Cancer Res. 2006;12:5277–5287. doi: 10.1158/1078-0432.CCR-06-0436. [DOI] [PubMed] [Google Scholar]
- 3.Politi K, Pao W. How genetically engineered mouse tumor models provide insights into human cancers. J Clin Oncol. 2011;29:2273–2281. doi: 10.1200/JCO.2010.30.8304. [DOI] [PMC free article] [PubMed] [Google Scholar]
- 4.Singh M, Johnson L. Using genetically engineered mouse models of cancer to aid drug development: An industry perspective. Clin Cancer Res. 2006;12:5312–5328. doi: 10.1158/1078-0432.CCR-06-0437. [DOI] [PubMed] [Google Scholar]
- 5.Carretero J, Shimamura T, Rikova K, et al. Integrative genomic and proteomic analyses identify targets for Lkb1-deficient metastatic lung tumors. Cancer Cell. 2010;17:547–559. doi: 10.1016/j.ccr.2010.04.026. [DOI] [PMC free article] [PubMed] [Google Scholar]
- 6.Engelman JA, Chen L, Tan X, et al. Effective use of PI3K and MEK inhibitors to treat mutant Kras G12D and PIK3CA H1047R murine lung cancers. Nat Med. 2008;14:1351–1356. doi: 10.1038/nm.1890. [DOI] [PMC free article] [PubMed] [Google Scholar]
- 7.Olive KP, Jacobetz MA, Davidson CJ, et al. Inhibition of Hedgehog signaling enhances delivery of chemotherapy in a mouse model of pancreatic cancer. Science. 2009;324:1457–1461. doi: 10.1126/science.1171362. [DOI] [PMC free article] [PubMed] [Google Scholar]
- 8.Singh M, Lima A, Molina R, et al. Assessing therapeutic responses in Kras mutant cancers using genetically engineered mouse models. Nat Biotechnol. 2010;28:585–593. doi: 10.1038/nbt.1640. [DOI] [PubMed] [Google Scholar]
- 9.Liotta LA, Kohn EC. The microenvironment of the tumour-host interface. Nature. 2001;411:375–379. doi: 10.1038/35077241. [DOI] [PubMed] [Google Scholar]
- 10.Mueller MM, Fusenig NE. Friends or foes—bipolar effects of the tumour stroma in cancer. Nat Rev Cancer. 2004;4:839–849. doi: 10.1038/nrc1477. [DOI] [PubMed] [Google Scholar]
- 11.Ruzinova MB, Schoer RA, Gerald W, et al. Effect of angiogenesis inhibition by Id loss and the contribution of bone-marrow-derived endothelial cells in spontaneous murine tumors. Cancer Cell. 2003;4:277–289. doi: 10.1016/s1535-6108(03)00240-x. [DOI] [PubMed] [Google Scholar]
- 12.Sikder H, Huso DL, Zhang H, et al. Disruption of Id1 reveals major differences in angiogenesis between transplanted and autochthonous tumors. Cancer Cell. 2003;4:291–299. doi: 10.1016/s1535-6108(03)00245-9. [DOI] [PubMed] [Google Scholar]
- 13.Ojalvo LS, King W, Cox D, et al. High-density gene expression analysis of tumor-associated macrophages from mouse mammary tumors. Am J Pathol. 2009;174:1048–1064. doi: 10.2353/ajpath.2009.080676. [DOI] [PMC free article] [PubMed] [Google Scholar]
- 14.Chin L, Pomerantz J, Polsky D, et al. Cooperative effects of INK4a and ras in melanoma susceptibility in vivo. Genes Dev. 1997;11:2822–2834. doi: 10.1101/gad.11.21.2822. [DOI] [PMC free article] [PubMed] [Google Scholar]
- 15.Sharpless NE, Bardeesy N, Lee KH, et al. Loss of p16Ink4a with retention of p19Arf predisposes mice to tumorigenesis. Nature. 2001;413:86–91. doi: 10.1038/35092592. [DOI] [PubMed] [Google Scholar]
- 16.Zamboni WC, Gervais AC, Egorin MJ, et al. Systemic and tumor disposition of platinum after administration of cisplatin or STEALTH liposomal-cisplatin formulations (SPI-077 and SPI-077 B103) in a preclinical tumor model of melanoma. Cancer Chemother Pharmacol. 2004;53:329–336. doi: 10.1007/s00280-003-0719-4. [DOI] [PubMed] [Google Scholar]
- 17.Morrison JG, White P, McDougall S, et al. Validation of a highly sensitive ICP-MS method for the determination of platinum in biofluids: Application to clinical pharmacokinetic studies with oxaliplatin. J Pharm Biomed Anal. 2000;24:1–10. doi: 10.1016/s0731-7085(00)00377-0. [DOI] [PubMed] [Google Scholar]
- 18.Blöchl-Daum B, Müller M, Meisinger V, et al. Measurement of extracellular fluid carboplatin kinetics in melanoma metastases with microdialysis. Br J Cancer. 1996;73:920–924. doi: 10.1038/bjc.1996.164. [DOI] [PMC free article] [PubMed] [Google Scholar]
- 19.Egorin MJ, Van Echo DA, Tipping SJ, et al. Pharmacokinetics and dosage reduction of cis-diammine(1,1-cyclobutanedicarboxylato)platinum in patients with impaired renal function. Cancer Res. 1984;44:5432–5438. [PubMed] [Google Scholar]
- 20.Erkmen K, Egorin MJ, Reyno LM, et al. Effects of storage on the binding of carboplatin to plasma proteins. Cancer Chemother Pharmacol. 1995;35:254–256. doi: 10.1007/BF00686557. [DOI] [PubMed] [Google Scholar]
- 21.Mahmood I, Balian JD. The pharmacokinetic principles behind scaling from preclinical results to phase I protocols. Clin Pharmacokinet. 1999;36:1–11. doi: 10.2165/00003088-199936010-00001. [DOI] [PubMed] [Google Scholar]
- 22.Dedrick R, Bischoff KB, Zaharko DS. Interspecies correlation of plasma concentration history of methotrexate (NSC-740) Cancer Chemother Rep. 1970;54:95–101. [PubMed] [Google Scholar]
- 23.Johansen MJ, Newman RA, Madden T. The use of microdialysis in pharmacokinetics and pharmacodynamics. Pharmacotherapy. 1997;17:464–481. [PubMed] [Google Scholar]
- 24.Kehr J. A survey on quantitative microdialysis: Theoretical models and practical implications. J Neurosci Methods. 1993;48:251–261. doi: 10.1016/0165-0270(93)90096-a. [DOI] [PubMed] [Google Scholar]
- 25.Müller M, Schmid R, Georgopoulos A, et al. Application of microdialysis to clinical pharmacokinetics in humans. Clin Pharmacol Ther. 1995;57:371–380. doi: 10.1016/0009-9236(95)90205-8. [DOI] [PubMed] [Google Scholar]
- 26.Müller M, Mader RM, Steiner B, et al. 5-fluorouracil kinetics in the interstitial tumor space: Clinical response in breast cancer patients. Cancer Res. 1997;57:2598–2601. [PubMed] [Google Scholar]