Abstract
Flow field flow fractionation (F4) is an invaluable separation tool for large analytes, including nanoparticles and biomolecule complexes. However, sample loss due to analyte-channel membrane interaction limits extensive usage of F4 at present, which could be strongly affected by the carrier fluid composition. This work studied the impacts of carrier fluid (CF) composition on nanoparticle (NP) recovery in F4, with focus on high ionic strength conditions. Successful analysis of NPs in a biomolecules-friendly environment could expand the applicability of F4 to the developing field of nanobiotechnology. Recovery of the unfunctionalized polystyrene NPs of 199-, 102-, and 45-nm in CFs with various pH (6.2, 7.4 and 8.2), increasing ionic strength (0–0.1 M), and different types of co- and counter-ions, were investigated. Additionally, elution of the 85-nm carboxylate NPs and two proteins, human serum albumin (HSA) and immunoglobulin (IgG), at high ionic strengths (0–0.15 M) was investigated. Our results suggested that; 1) Electrostatic repulsion between the negatively charged NPs and the regenerated cellulose membrane was the main force to avoid particle adsorption on the membrane; 2) Larger particles experienced higher attractive force and thus were influenced more by variation in CF composition; and 3) Buffers containing weak anions or NPs with weak anion as the surface functional groups provided higher tolerance to the increase in ionic strength, owing to more anions being trapped inside the NP porous structure. Protein adsorption onto the membrane was also briefly investigated in salted CFs, using human serum albumin and immunoglobulin. We believe our findings could help to identify the basic carrier fluid composition for higher sample recovery in F4 analysis of nanoparticles in a protein-friendly environment, which will be useful for applying F4 in bioassays and in nanotoxicology studies.
Keywords: Flow field flow fractionation, Nanoparticles, Protein, Sample recovery, Carrier fluid, Ionic strength
1. INTRODUCTION
Flow field flow fractionation (F4) uses an axial channel-flow and a perpendicular cross-flow to separate analytes based on their hydrodynamic radius. Since its invention by Calvin Giddings, F4 has found applications in environmental study[1–4], nanomaterials characterization[5–7], food analysis[4, 8–10], and drug carrier development[11–17], owing to its superior compatibility with analytes larger than a few nanometers. A variety of large substances have been analyzed by F4, including bacterial cells[18], particles, nanocolloids[19], and proteins[20]. Employment of on-line detectors that are able to measure the size and molecular mass of the eluted species further enhances the applicability of F4[12, 18, 21–25]. Moreover, F4 has been proved to be an effective tool for purification of protein complexes before bioassays or downstream analysis[26, 27].
One problem often encountered in F4, however, is analyte-membrane interactions which can result in significant sample loss. Accurate quantitation is then hampered, and after-column collection for subsequent analysis becomes difficult. Large amounts of optimization on flow rates and carrier fluid compositions are needed to minimize sample loss in F4 while maintaining adequate size resolution. Typically, DI water with surfactants added is used for separating particles; and salted buffers are employed for protein analysis, to ensure high sample recovery. However, owing to the high promises nanotechnology provides to biomedical research, co-presence of nanoparticles (NPs) and proteins becomes more and more frequent. For example, using quantum dots, gold or iron oxide NPs for biosensing or as drug carriers requires them to be coupled with antibody or ligands and specifically recognize antigens or cellular receptors [28–30]. Development of nanomedicines or reduction of nanotoxicity demands more understanding of the interaction between proteins in body fluids and NPs[31–33]. Study of NPs distributed in biological matrices, bioconjugated NPs, and NP-protein complexes can be facilitated by F4, because it can accommodate a large range of NP sizes and is a very gentle separation technique with no packing materials in the separation channel and imposing negligible shear force on samples. Though, in order for it to be applied to the aforementioned samples, its capability to manage NPs in a protein-friendly environment with negligible sample loss should be evaluated.
Impacts on sample adsorption from the carrier fluid’s ionic strength and membrane surface polarity were investigated briefly for bacteria as well as standard polystyrene latex particles with sizes ranging from 0.43 to 8 μm[22, 34, 35]. These previous studies used only up to10 mM KCl or NaCl for the effect of ionic strength, and focused more on the impact from membrane properties. A recent study of using asymmetrical F4 to analyze Ag nanoparticles with sizes around 25–30 nm also provided insights on how both NP surface charge and membrane zeta-potential would impact on particle adsorption on the membrane[36]. In our previous report of coupling F4 to flow cytometry for analysis of immuno-complexes captured on microspheres, a brief investigation on the impact of pH on the recovery of the micron-sized beads was carried out, and 50 mM NaCl was employed in that study to maintain complex integrity[27].
In the present work, we studied membrane adsorption of polystyrene NPs that occurred in F4 when the carrier fluid (CF) contained various types of anion and cation at high concentrations. Adsorption behaviors of proteins were also explored for better understanding the difference between these two types of samples. Our study aims to find out the carrier fluid compositions that are suitable for separating NPs and also allow biomolecules like proteins to maintain their native structures. The knowledge obtained from this study can guide future work on using F4 for analysis of bioconjugated nanostructures or complexes formed between NPs and proteins.
2. MATERIAL AND METHODS
2.1 Chemicals
The majority of this investigation was carried out on polystyrene NPs (46 ± 2, 102 ± 3, and 199 ± 6 nm) purchased from Thermo Scientific (NIST traceable particle size standards, 3000 series; Waltham, MA, USA). Based on the manufacturer, these polystyrene particles were produced by emulsion polymerization using an anionic surfactant and had surface sulfate groups which arose from the polymerization initiator. They are called “unfunctionalized NPs” in the following text because their surface groups were not specifically added after synthesis. Polybead® carboxylated polystyrene NPs (42.0 ± 6.3 and 85.1 ± 6.5 nm) were obtained from Polysciences, Inc. (Warrington, PA, USA). These particles were functionalized to carry carboxyl groups on the surface, and thus were referred to “the carboxylate NPs” below. Human serum albumin (HSA) and immunoglobulin (IgG) were obtained from Sigma Aldrich (St. Louis, MO, USA) in the form of lyophilized powders.
All chemicals used in this study, such as hydrogen chloride (HCl), sodium hydroxide (NaOH), sodium dihydrogen phosphate (NaH2PO4), disodium hydrogen phosphate (Na2HPO4), the chloride salts of sodium, potassium, cesium, and magnesium (NaCl, KCl, CsCl, MgCl2), and the 1 M HEPES stock solution (pH 7.3), were acquired from Fisher Scientific (Pittsburgh, PA, USA). The phosphate buffers were prepared from mixing the mono- and dibasic- phosphates at ratios calculated with the buffer design tool available on http://www.currentprotocols.com/WileyCDA/CurPro3Tool/toolId-3.html, to achieve the desired pH and phosphate concentration. The HEPES buffer was diluted from stock to reach the desired 10 mM concentration. Salts were added to 10 mM phosphate or HEPES at corresponding concentrations to prepare solutions with different ionic strengths.
2.2 F4 conditions
The F1000 series from Postnova Analytics (Salt Lake City, UT, USA) was used in our study. In this symmetrical F4 system, the cross-flow is delivered to the channel by a separate pump than the channel flow. The cross-flow enters from the center of the top channel wall, goes across the channel, passes through the membrane, and finally exits via the bottom channel block. This flow mode is called the open mode in F1000. The F1000 can also run in a recirculating mode, in which the cross flow runs in a closed circle without going to the outlet. Recirculating mode is recommended for separation, as it has a more consistent backpressure and channel flow rate. In F1000, sample injection is done in a stop-flow manner (or called equilibrium or relaxation in other places) which allows each sample component to form a steady state zone near the accumulation wall. During the stop-flow mode, the cross-flow continues but the channel stream is bypassing the column. Without the channel flow to carry it further into the channel and being stopped by the cross-flow stream, the sample settles down toward the accumulation wall. After the relaxation time has passed, the channel flow resumes and the samples are carried through the channel, diffusing back towards the center of the channel based on a balance between their diffusion rates and the force of the cross-flow on the nanoparticle diameters[37, 38]. Larger particles have smaller diffusion coefficients and thus spend more time closer to the membrane.
A 254 μm spacer was used to generate the channel thickness, and a 30 kDa MWCO regenerated cellulose (RC) membrane served as the accumulation wall. Regenerated cellulose was chosen as it is the most commonly used membrane material in FFF for bioanalysis. A UV detector, set at 280 nm, was used as the primary means of detection. Membranes were replaced at least every 14 days or as needed. CFs were prepared daily and filtered with 0.2 μm filters before usage. The CF composition used for each individual study and the corresponding flow rates were listed in Table 1. All CFs contained 0.025% Fl-70. In order to maintain the biological relevancy, we chose to use 10 mM phosphate as our base CF to which we added different levels of salt. Phosphate is the buffering ion in the phosphate buffered saline (PBS) that matches the physiological condition and is used most frequently with biological samples. It also provides a wider range of pH around 7 than other buffering ions, facilitating the investigation of impacts from pH. The flow rates used were optimized using the CF of 10 mM phosphate at pH 7.4 to deliver the best resolution of all three unfunctionalized polystyrene NPs, or a symmetrical peak of HSA within a reasonable time. Each CF was allowed to equilibrate in the system for 1 h at the separation flow rates in the open mode before sample injection. Separation was performed in the recirculating mode to maintain stable flow conditions. Instrument control, data acquisition, and initial data analysis were carried out with software provided by Postnova. The fractograms and analysis plots were prepared by OriginPro 8.0 (OriginLab Corporation, Northampton, MA, USA).
Table 1.
List of F4 running conditions used in this study.
| Effect/phenomenon being investigated | Carrier fluid | Flow rates(channel, cross | |
|---|---|---|---|
| Unfunctionalized Polystyrene nanoparticles, diameter of 46-, 102-, 199-nm | Sample adsorption assessment within the same day or on consecutive days | 10 mM phosphate with 0.025% FL70, pH 7.4 | 2.75, 0.75 mL·min−1 |
| Increasing ionic strength in solutions with different anions | 10, 20, and 50 mM phosphate with 0.0025% FL-70, pH 7.4 | ||
| 10 mM HEPES with 25, 50, and 100 mM NaCl, 0.0025% FL-70, pH 7.3 | |||
| Increasing ionic strength in solutions with different cations | 1, 5, 10, 25 mM NaCl, KCl, CsCl in 10 mM phosphate, 0.0025% FL-70, pH7.4 | ||
| 1, 5, 10 mM MgCl2 in 10 mM phosphate, 0.0025% FL-70, pH 7.4 | |||
| Comparison of 102-nm unfunctionalized polystyrene and 85-nm Carboxylate NP |
10 mM HEPES with 5, 25, 50, 100, 150 mM NaCl, 0.0025% FL-70, pH 7.3 | ||
| Brief study on proteins | |||
| HSA and IgG | Ionic strength | 10 mM phosphate with 0.025% FL-70, with 0, 50, 100, 150 mM NaCl, pH 7.4 | 0.75 and 3mL·min−1 |
Samples were injected with a fixed volume of 20 μL. The NPs were diluted to either 0.25 % (for the 42-nm carboxylate and the 46-nm unfunctionalized NPs) or 0.125% (for the larger sizes) (w/v) in Milli-Q water (resistivity 18.2 MΩ.cm, Billerica, MA, USA). Proteins were prepared at 5 mg/mL freshly on a daily basis in water and kept at 4 ºC between injections.
2.2 Zeta potential and hydration size measurements
Zeta potential and hydration size measurements were taken with a Brookhaven Zetaplus system (Holtsville, NY, USA). All particles were diluted to 0.25% (w/v) in the corresponding buffer before the measurement. Each measurement was the mean value of 50 cycles.
2.3 Circular Dichroism spectroscopy of IgG and HSA
All circular dichroism(CD) measurements were taken on a Jasco J-815 CD instrument, using a quartz cuvette with a 1-mm path-length. IgG and HSA were prepared in the buffers of interest with a final protein concentration of 0.5 mg/mL. CD spectra were collected from 190 to 260 nm, with a step of 1 nm and a scan rate of 100 nm/min. Only data points from 200–260 nm were retained due to buffer interference at lower wavelengths. The spectra were plotted and analyzed using Origin.
3. CALCULATION OF RELATIVE RECOVERY
We tested diverse types of CF, most of which had high ionic strength and caused sample adsorption onto the channel membrane. As a result, membrane performance deteriorated rapidly. The retention time for the same type of NPs was elongated and very poor particle recovery was observed. We compared the fractograms of two unfunctionalized NPs (46- and 102-nm) in 10 mM phosphate (pH 7.4) obtained within the same day or over a period of 6 days. The peak area decreased about 15% on day 6, compared to day 1(Supporting Information Figure S1a and S1b), but no significant reduction was observed within 10 hours (Figure S1c and S1d). Due to the day-to-day deterioration, direct comparisons could not be made on fractograms obtained on different days, we did the first run of each day in 10 mM phosphate (pH 7.4), and used that run as the reference to calculate the relative recovery (RR) of NPs in the various CFs examined on the same day, by the following equation:
| (1) |
In this equation, A was the peak area of the NP in the investigated CF and A* was the peak area in the reference run. The peak areas were the average of two consecutive runs. Using RR instead of absolute peak area allowed us to compare experiments from different days with minimal effect from day-to-day membrane deterioration.
4. RESULTS
4.1.1 pH effect
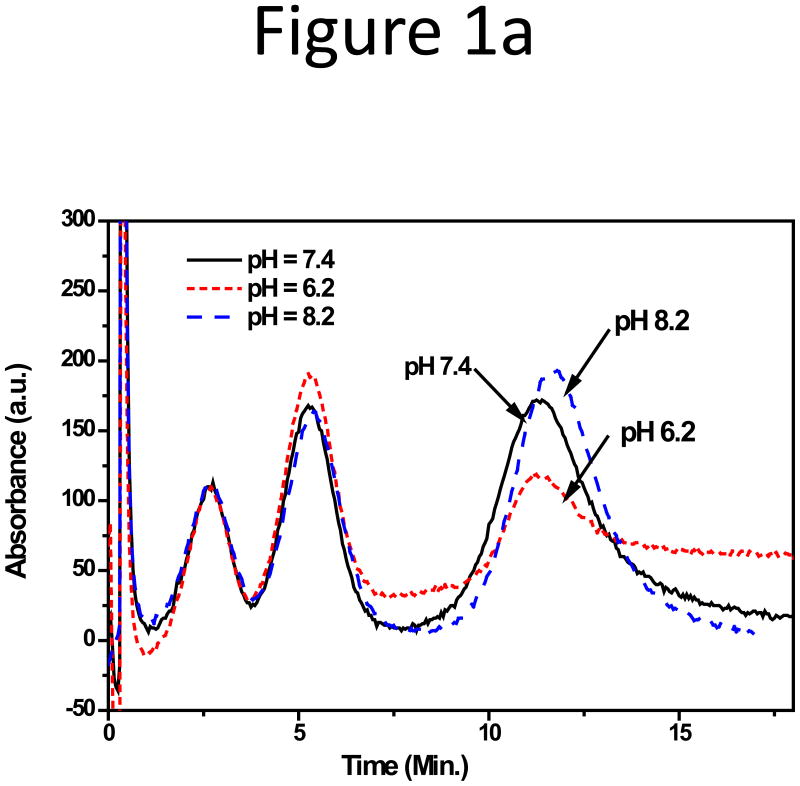
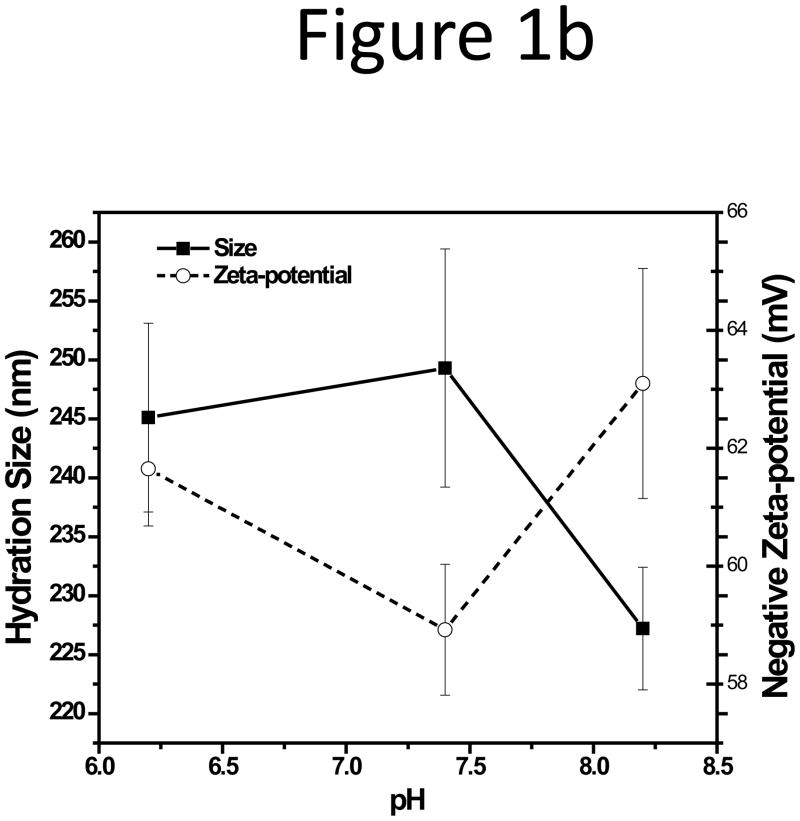
Since biological samples could be stable at a pH varied slightly from the physiological pH of 7.4, we first tested sample adsorption in CFs with pH of 6.2, 7.4, and 8.2, while keeping the total phosphate concentration to be 10 mM. The NPs were well separated under these pH values, with almost identical peak areas except for pH 6.2 (Figure 1a), in which the peak area of the 199 nm NPs dropped by half (Figure S2). Large reduction of sample recovery in an acidic CF (pH 5.0) was also reported in our previous work on the IgG-conjguated microparticles[27]. Additionally, the base-line drifted constantly at pH 6.2. Such drifting in chromatography typically correlates to column deterioration. Therefore, evaluation of membrane stability at various pH is needed to explain this phenomenon. A quite negative zeta-potential of −61.65±0.97 mV was still detected on the 199 nm NPs at pH 6.2, and no large change was seen in both the zeta-potential and the particle hydration size of the NPs with pH changing from 6.2 to 8.2 (Figure 1b).
Figure 1.
(a) Fractograms and (b) the zeta-potential and hydration size plot of three unfunctionalized NPs in CFs with different pH of 6.2, 7.4, and 8.2.
4.1.2 Increasing anion concentration in carrier fluid
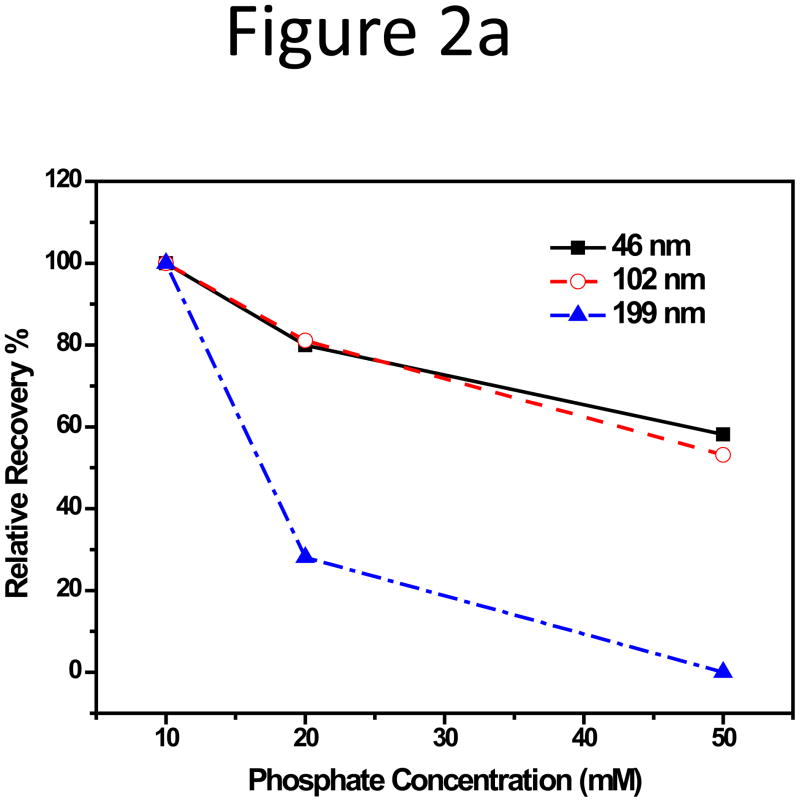
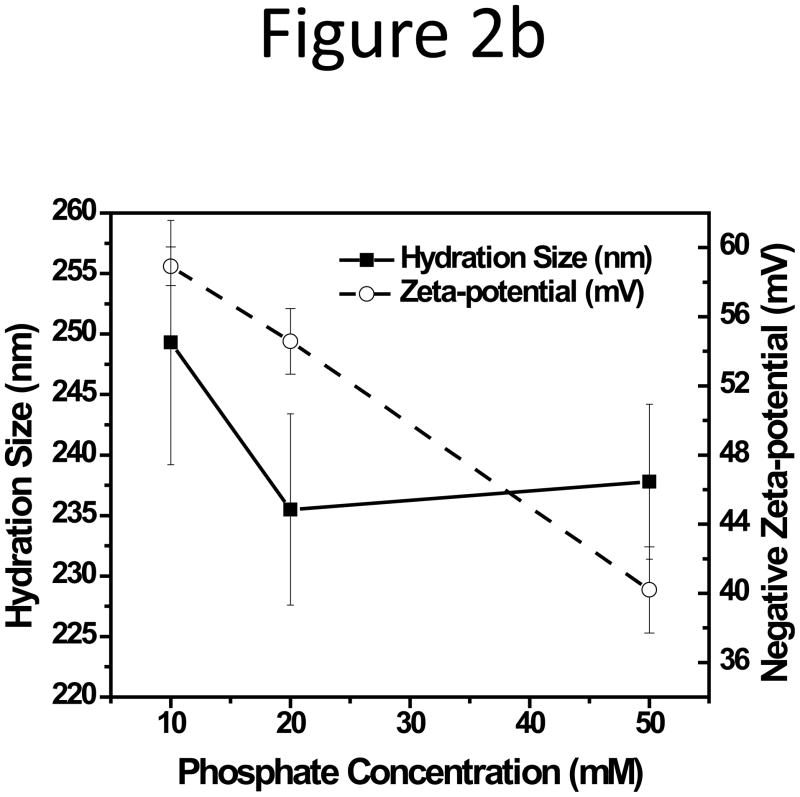
The effect of CF ionic strength on membrane adsorption was then investigated. A series of phosphate buffers were prepared to contain a total phosphate concentration of 10, 20, and 50 mM at pH 7.4. Similar to the phenomenon observed above, the 199 nm NPs were influenced most significantly. Its relative recovery (RR) dropped below 30% with 20 mM phosphate and the peak completely disappeared with 50 mM phosphate (Figure 2a; fractograms were shown in Figure S3, Supporting Information). The absolute value of the negative zeta-potential of the 199-nm NPs decreased almost linearly with increase of phosphate concentration, but had no significant change in hydration size (Figure 2b).
Figure 2.
(a) Relative recovery and (b) Zeta potential plot of the 199-nm unfunctionalized NP with increasing phosphate concentration in CF.
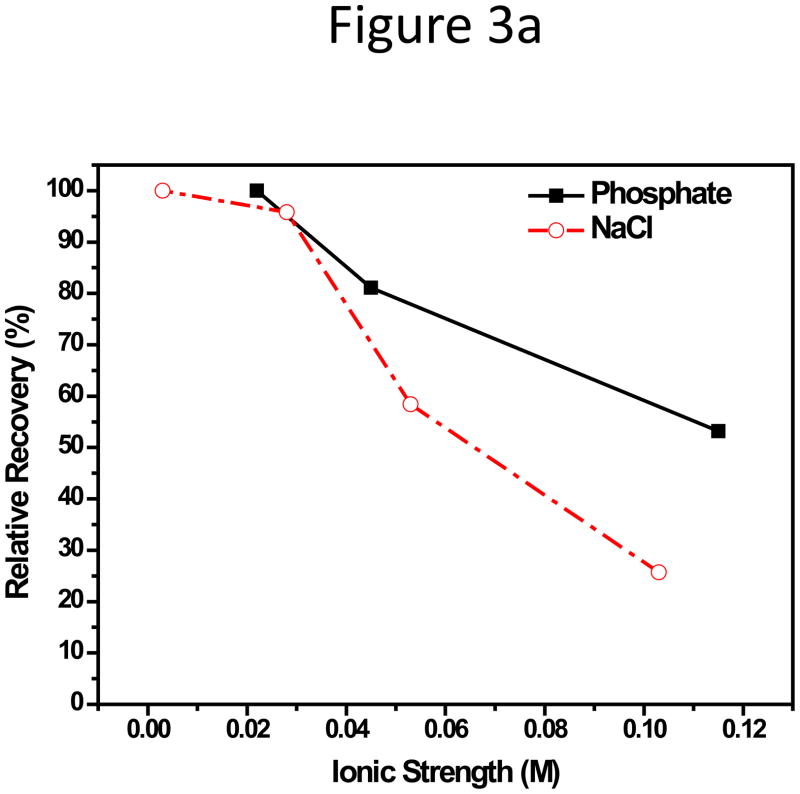
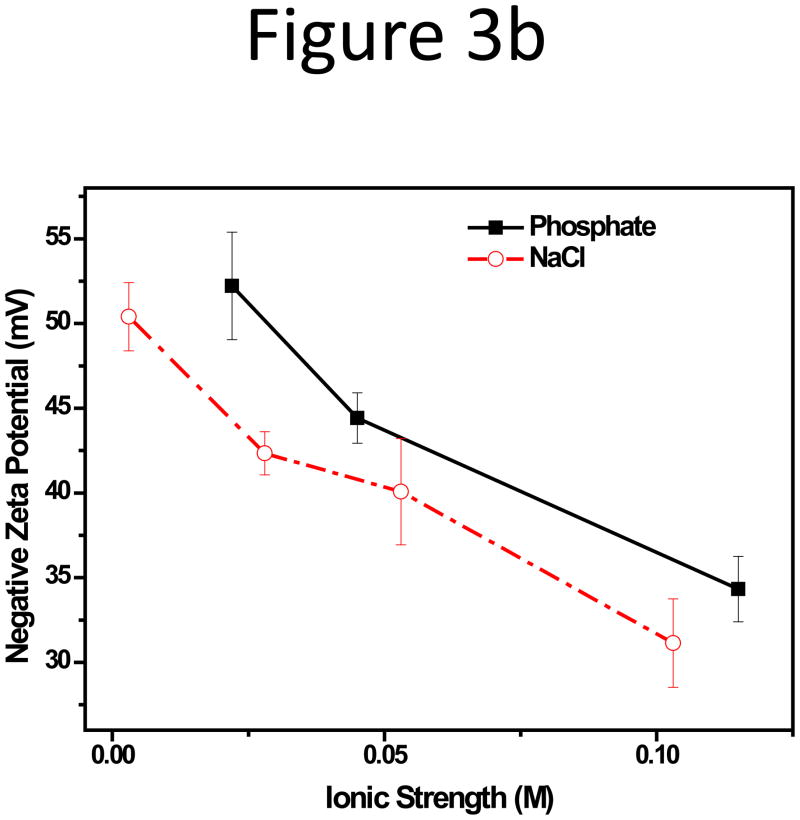
We also compared the impact from the type of anions, i.e. H2PO4− -HPO42− and Cl−, with increasing ionic strength in CF. NaCl was added to the 10 mM HEPES buffer (pH 7.3) at concentrations of 25, 50, and 100 mM NaCl. HEPES is a zwitterionic organic buffering agent, and 10 mM HEPES only contributed to an ionic strength of 0.003 M, and the dominant anion in these solutions was Cl−. Since it is not meaningful to compare RR if no peak could be seen, this step of investigation was focused on the 102-nm NPs. The relative recovery, RR, of the 102-nm NPs in the corresponding CF, was plotted against the ionic strength, I, of the phosphate or HEPES-NaCl CFs. It was discovered that, with a comparable I, Cl− seemed to induce bigger decrease in RR compared to the H2PO4− -HPO42− system (Figure 3a). With 50 mM phosphate (I = 0.115 M), the RR was around 53.2%, but the RR in HEPES-100 mM NaCl (I = 0.103 M) was only 25.7%. This was consistent with the zeta-potential relationship of the NPs in these two series CFs: the NP zeta-potential was more negative in phosphate buffers than in HEPES-NaCl buffers (Figure 3b). The hydration size change had no obvious trend with small increments of around 4–8 nm, compared to the actual size of the NPs, following variation in ionic strength or anion types (Figure S4). This suggests that the deterioration in this case can be attributed to the change of zeta-potential rather than size.
Figure 3.
(a) Relative recovery and (b) Zeta potential plot of the 102-nm unfunctionalized NP with increasing phosphate or chloride concentration in CF.
4.1.3 Cation type
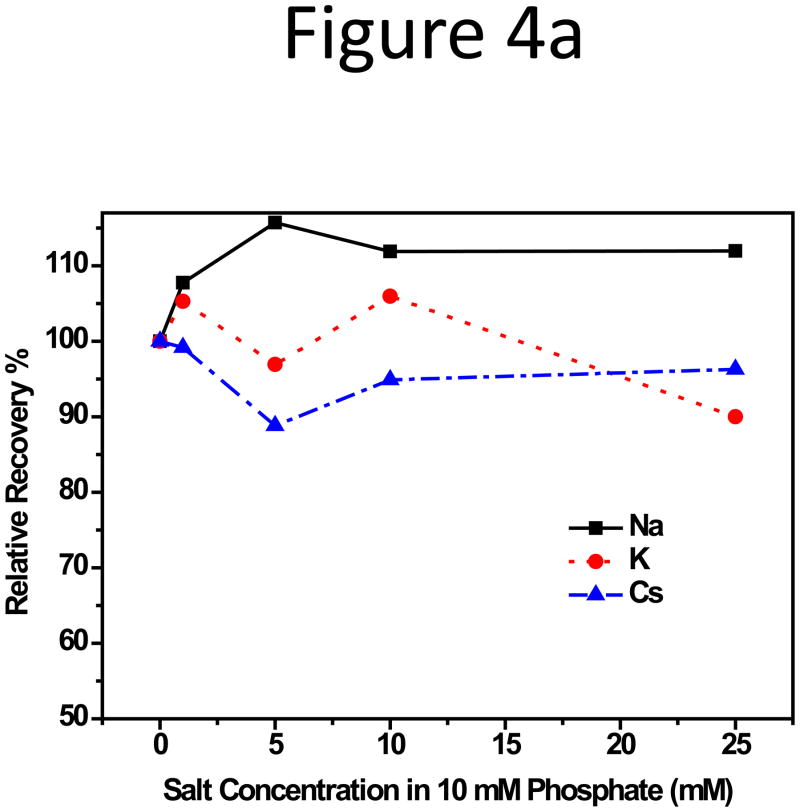
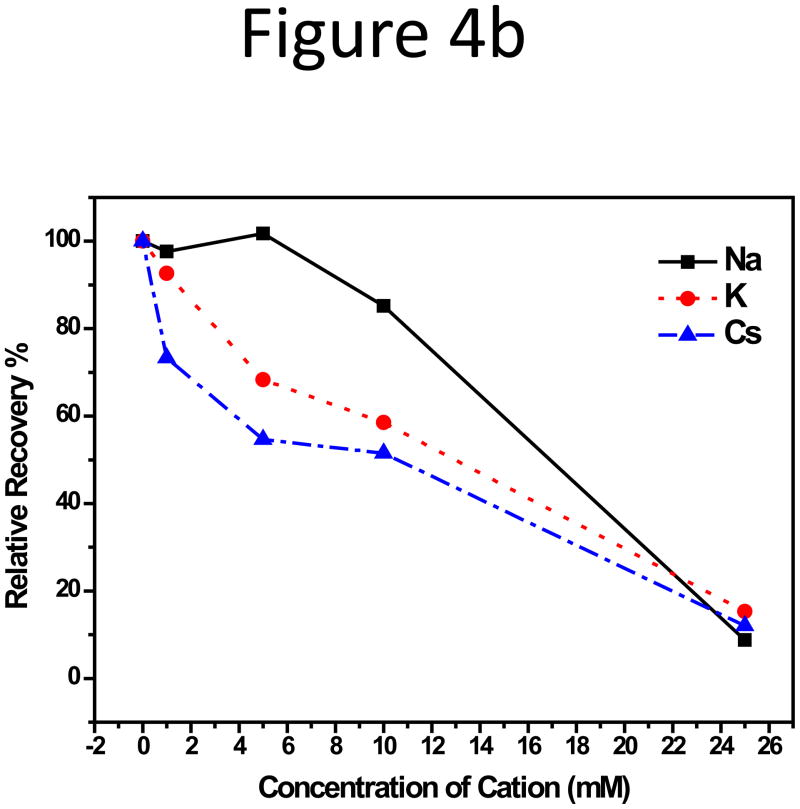
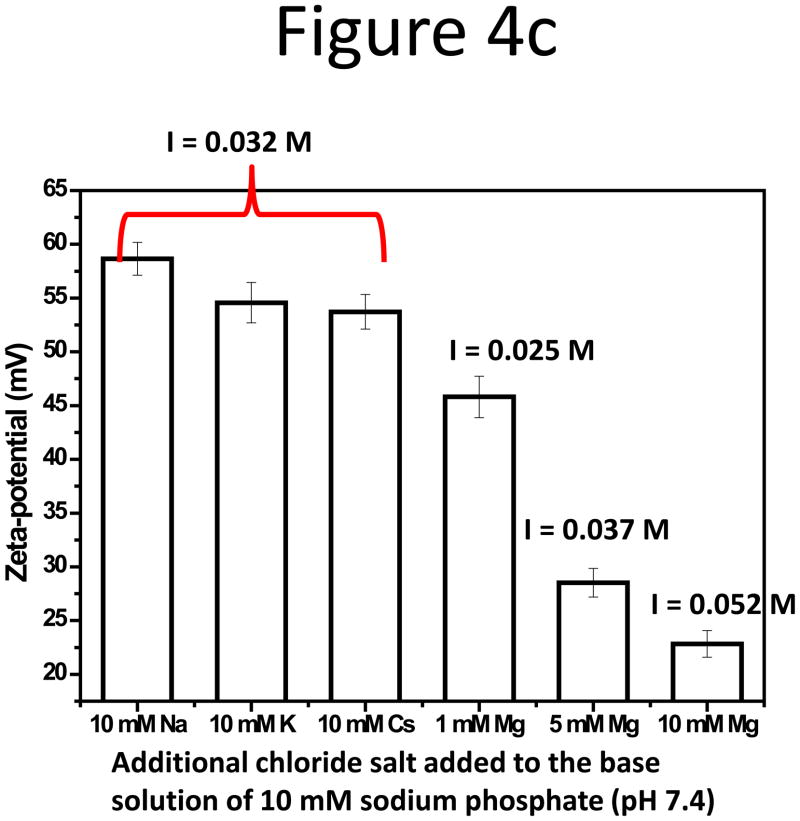
Subsequently, impact on particle RR from the type of counter ions in CF was studied. Sodium, potassium, cesium, and magnesium chlorides were added to the base solution of 10 mM sodium hydrogen- and dihydrogen-phosphate at pH 7.4, the function of which was to maintain pH stability. The fractograms were shown in Supporting Information, Figure S5. Among the three monovalent alkali metals, no obvious change in peak area for the two smaller particles was observed with increasing cation concentrations in CF. The RR plot vs. salt concentration for the 102-nm NP can be found in Figure 4a. However, consistent RR reduction for the 199-nm NPs was seen (Figure 4b); and RR was lower with cations having higher atomic numbers, i.e. in the order of Cs+ < K+ < Na+: RR of the 199-nm NPs was 90% in CF with Na+, dropped to 60% with K+ and 50% with Cs+. Figure 4c compared the absolute value of the negative zeta-potential of the NPs in 10 mM alkali salt solutions, but little difference, < 5 mV, was detected among Na+, K+, and Cs+, even though the zeta-potential was more negative in Na+ than in K+ and Cs+ (Figure 4c). Hydration size change was also not large, with that in the Cs+ solution about 4-nm smaller than in the Na+ and K+ solutions (Figure S6).
Figure 4.
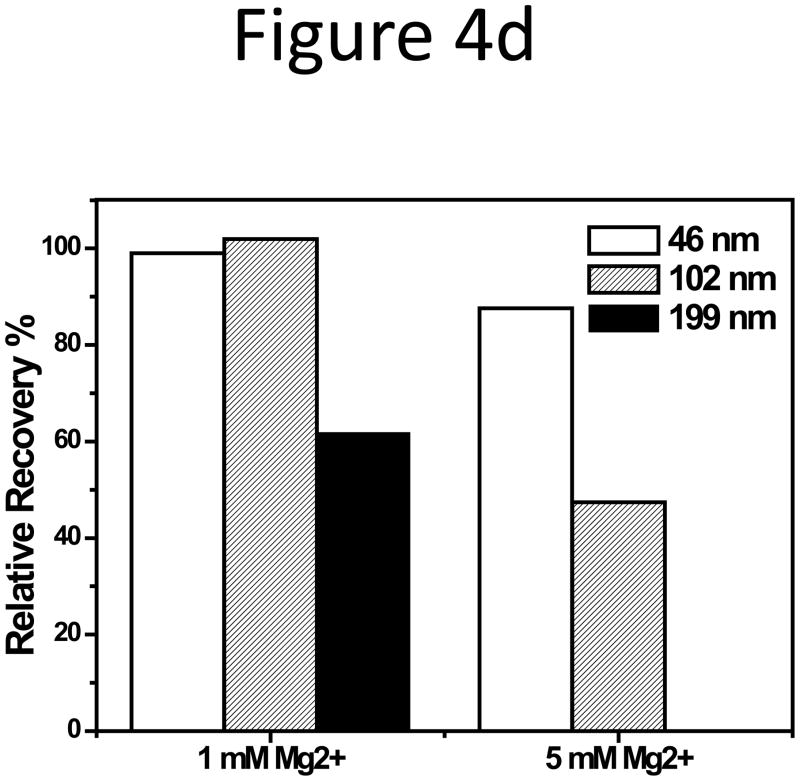
(a) RR of the 102-nm and (b) 199-nm unfunctionalized NPs vs. the alkali salt concentration in 10 mM phosphate CF. (c) RR of three unfunctionalized NPs in 10 mM phosphate with 1 or 5 mM MgCl2 added. (d) Zeta potential of the 199-nm unfunctionalized NP in 10 mM sodium phosphate buffer, pH 7.4, with 10 mM Na+, K+, and Cs+, or with 1, 5, and 10 mM Mg2+.
Particle adsorption was more severe in CF containing Mg2+. When the Mg2+ concentration increased from 1 to 5 mM, more than 50% peak area reduction was observed for the 102-nm NPs, and no particles could be eluted out of the column with 10 mM Mg2+ (Figure 4d). The divalent Mg2+ led to a much lower zeta-potential on the NPs even at a comparable ionic strength to the monovalent cations (Figure 4d), but did not significantly influence the particle hydration size (Figure S6).
4.2 Comparison of unfunctionalized and carboxylated nanoparticles
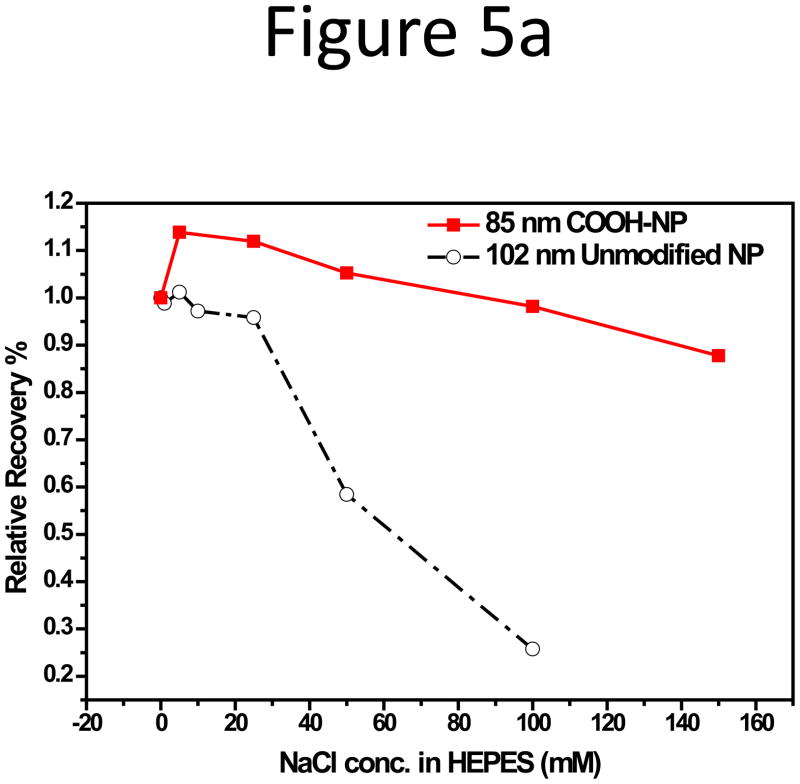
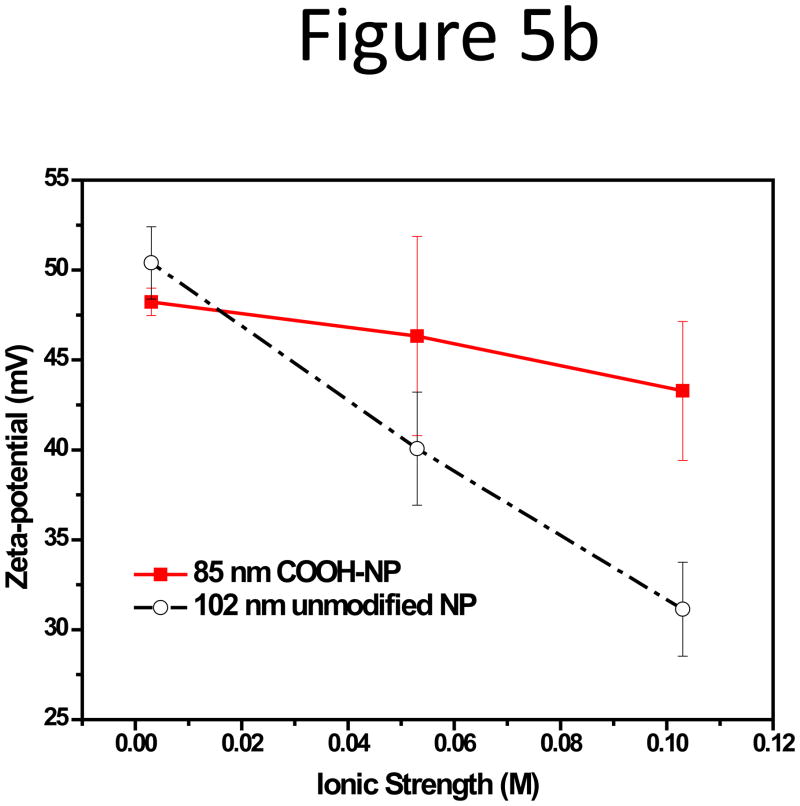
As mentioned in the experiment section, the unfunctionalized polystyrene NPs carried sulfate groups on the surface which was originated from the polymerization initiator. The sulfate groups gave sufficient surface potential for the particles to be stably suspended in aqueous solutions. We also tested the NPs specially functionalized with carboxyl groups to incorporate surface groups for bioconjugation in our study, and compared their adsorption behavior with the unfunctionalized NPs having a comparable size in the salted carrier fluids of F4. Membrane adsorption of the carboxylate 85-nm NPs was much less than the unfunctionalized NPs in CFs with high ionic strength (Figure 5a). Larger than 90% RR was obtained for the carboxylate NPs, in CFs with 5 to 150 mM NaCl; while the RR of the unfunctionalized NPs dropped rapidly to 26% with only 100 mM NaCl. The CFs in this step of study were prepared by adding NaCl to 10 mM HEPES, and the main anion in the solution was Cl−. The zeta-potential of both NPs dropped consistently with increasing ionic strength (Figure 5b), but the decrease for the unfunctionalized NPs was much more rapidly. No significant change in hydration size was observed for both NPs (Figure S7 in Supporting Information). Such phenomena hint that zeta-potential change should play a bigger role in particle adsorption on the membrane.
Figure 5.
(a) RR and (b) zeta-potential of the 85-nm carboxylate NPs and the 102-nm unfunctionalized NPs in CFs with increasing ionic strength obtained by adding NaCl to 10 mM HEPES (pH 7.3).
4.3 Proteins
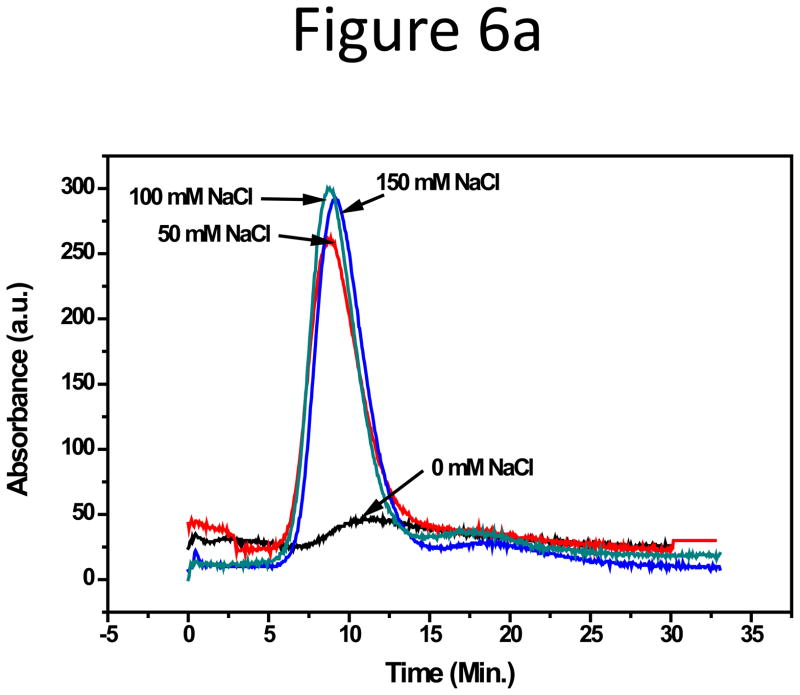
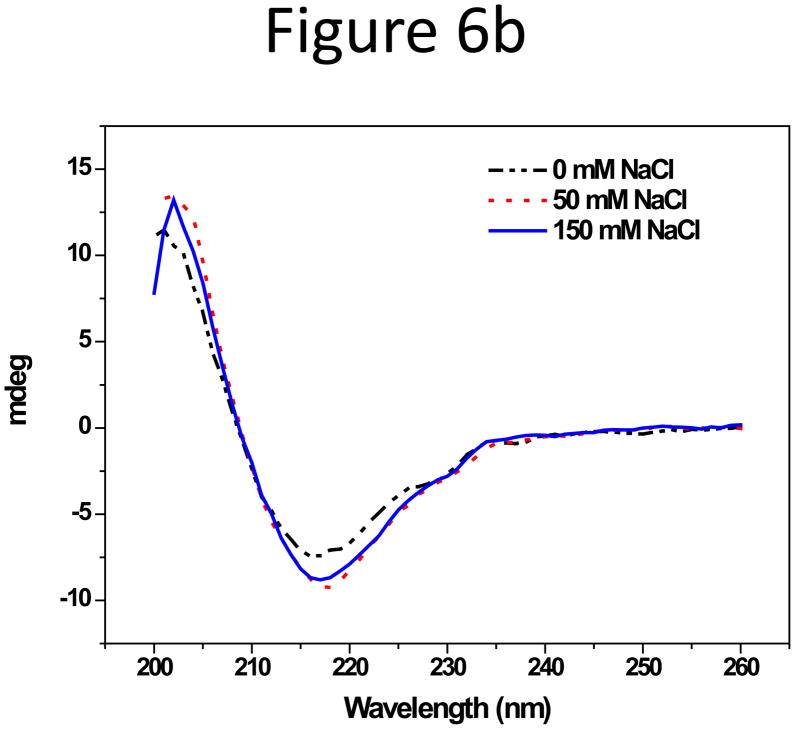
Unlike the solid spherical NPs, proteins have more flexible structures and contain both hydrophobic and hydrophilic residues, the display of which on the protein surface depends on the environment. In addition, proteins have high diffusion coefficients compared to NPs, and higher cross flow rates than in NP separation are often used to improve resolution. Therefore, adsorption of protein on the channel membrane in F4 could be different than that of the solid particles. Previous attempts of separating proteins by F4 typically used I (ionic strength) close to only 0.1 M[39–42]. In this study, salt effects on the adsorption of two representative proteins: human serum albumin (HSA, Mw 65 kDa, pI 4.7) and human immunoglobulin G (IgG, Mw 150 kDa, pI 5.5~9.1), was investigated, using I up to 0.15 M to match the physiological condition. HSA and IgG are considered to be “soft” proteins owing to high flexibility and low structural stability, and are generally found to adsorb on a variety of surfaces regardless of surface hydrophobicity [43, 44][43, 44]. Ionic strength was controlled by adding NaCl to 10 mM phosphate, in which the zeta-potentials of both proteins were measured to be around −40 mV. Though both carried negative surface charges, HSA and IgG behaved differently in salted CFs. The shape and area of the HSA peak were not affected by either the salt content or the pH (6.2, 7.4, and 8.2) in CF (Supporting information, Figure S8a & b). In contrast, IgG was strongly adsorbed onto the membrane without NaCl in CF, but the peak resumed with 50 mM NaCl, and stabilized at 100 and even 150 mM NaCl (Figure 6). This completely opposite adsorption trend to that of the NPs points out that the cause of protein adsorption on the accumulation wall could be different from that of the NPs.
Figure 6.
(a) Fractograms and (b) CD spectra of IgG in CF containing10 mM sodium phosphate plus 0, 50, or 150 mM NaCl.
5. DISCUSSIONS
5.1 Particle adsorption
Particle adsorption on the accumulation wall in F4 is governed by particle-wall interaction that is balanced by two forces: the attractive van der Waals force and the electrostatic repulsion between particles or between particle and membrane surface[45–49]. If the repulsive force dominates, an energy barrier is to be overcome for particles to adsorb, which will give out high sample recovery at the end of the column. Accordingly, if the attractive force is stronger, particle aggregation and surface adsorption would be significant. The attractive van der Waals force, FvdW, is proportional to R3/l2(2R+l)2, R being particle radius and l representing the surface-surface distance between particle and membrane[36, 50, 51]. Since the regenerated cellulose (RC) membrane has a pKa ~ 3.5 owing to ionization of its carboxyl groups[52], the negatively charged NPs were repelled from the membrane surface via a repulsion force, Fel. This force can be calculated from the following equation:
| (2) |
in which k is the Boltzmann constant, R and l are the same as in FvdW, and T is the temperature, ρ is density of the media, zi is the ion valence, e is the charge of one electrion, δ is the thickness of the double-layer, ζ is the zeta-potential of the substance[36, 51]. The repulsion force is also dependent on the membrane property. Any change in CF should induce change on the membrane, the contribution of which cannot be ignored. Reduction of zeta-potential of the RC membrane with increase in salt content[36] or with protein adsorption[53] has been reported previously. Unfortunately, we do not have access to instruments that can measure membrane zeta-potential and could not evaluate this side of the adsorption theory. Therefore, our discussion was focused on changes on NPs caused by variations in CF composition.
Most of the adsorption observed in our study for the unfunctionalized NPs can be explained by the above theory. With increasing ionic strength, the absolute value of the zeta-potential of the particles dropped rapidly (Fig. 2b). The high ionic strength also led to smaller double-layer thickness, δ. Both reductions could lower Fel, and more adsorption was thus observed. The largest particles were in general more affected than the smaller ones by variation in pH and ionic strength (Fig. 1a, 2a, and 4a & b). This is mainly because of their close location to the membrane surface, i.e. smaller particle-membrane distance, l; and large particle radius, R. Thus, they were subjected to a higher attractive van de Waals force, FvdW, than the 46- and 102-nm NPs; and their interaction with the membrane was more sensitive to change in Fel (Equation 2) even when the variation in particle zeta-potential was small. For example, in the case of CFs with different pH, significant peak reduction for the 199-nm NPs was observed at pH 6.2 with small difference detected in particle zeta-potential (Fig. 1a&b). Based on the work conducted by A. Ulrich et al., the zeta-potential of the RC 30kDa membrane would change from −20 mV to −15 mV when pH dropped from 8 to 6[36]. Therefore, small reduction in Fel could have occurred due to such change in the membrane zeta-potential, leading to significant adsorption of the largest particles.
The effect from counter ion valency and size largely exerts by changing the zeta-potential and by affecting the thickness of the diffuse double layer[54]. In our study, no significant variation in NP zeta-potential was detected for the three alkali ions, but higher RR was observed with Na+, compared to K+ and Cs+. This could be attributed to the hydrated radius of the alkali ions that decreases in the order of Na+ > K+ > Cs+. The more hydrated cation results in a larger Stern layer thickness, the first layer of the double-layer that lies on the surface and is dictated by the size of the counter ion. This enlarged Fel, as well as the distance between particle and membrane, which decreased the attractive van der Waals force. The sum effect was then a higher RR in Na+ than the other two alkali cations. Mg2+ has higher valency, yielding more compression to the diffuse double-layer. Additionally, higher reduction in zeta potential with higher valency ions was reported as compared to lower valency ions[54], matching with our zeta-potential measurement results. Hence, lower RR was found with Mg2+ in the CF compared to the monovalent alkali cations.
Besides electrostatic repulsion and van der Waals attraction, comparison of effects from phosphate and Cl− (Fig. 3), or between NPs with sulfate and carboxylate surface groups (Fig. 5), suggests that Donnan exclusion may take place and contribute to NPs adsorption. Polystyrene is one of the most common supporting material for liquid chromatography, and studies on such stationary phase materials have revealed that the polymer network of polystyrene as well as its crosslinked co-polymers could have porous structures and retain certain amounts of solution, called the occluded liquid phase[55–57]. The occluded liquid volume is important for the occurrence of the Donnan exclusion effect; because a large number of ions can be kept within this volume and contributes to the overall surface charge of the polymer. In accordance with this effect, when the phosphate and chloride anions are in the solution, they would be repelled from the particle surface by the negatively charged sulfate groups. The Cl− ions were permanently charged, and not retained by the NPs. However, the phosphate anions were weakly ionized, and could penetrate the charged layer in their molecular forms and be retained inside the polystyrene particles. The retained phosphate ions provided a larger ion pool to counter-balance the higher concentration of the counter ions in the solution at higher salt concentration and resulted in a smaller drop in the zeta-potential of the NP surface, leading to better particle recovery in the phosphate buffer at high ionic strength (Fig. 3). Similarly, the zeta-potential drop of the carboxylate NPs in buffers with high NaCl concentration was much slower than that of the unfunctionalized NPs which had sulfate groups on the surface (Fig. 5). The sulfate groups were permanently charged and the unfunctionalized NPs thus retained very little Cl− due to total ion exclusion, leading to much lower tolerance to the high salt level. In contrast, the weaker acidic group of carboxylate allowed the Cl− to be trapped inside the functionalized NPs, maintaining a relatively stable zeta-potential on the surface to prevent the NPs to be adsorbed on the RC membrane. Though, in this case, the carboxylate NPs had a smaller average diameter than the unfunctional NPs, which may help with the higher particle recovery to some extent.
5.2 Protein adsorption
Proteins have much smaller sizes, i.e. R, than the ≥50 nm NPs, and thus experience smaller attractive van der Waals force. The negative zeta-potential of HSA and IgG also supported that they should be electrostatically repelled from the RC membrane. However, protein adsorption on surface is highly complicated, and have been concluded in previous studies to rely on the three-dimensional protein structure and structure stability, and be governed more by hydrophobic interaction than electrostatic forces[43, 58, 59]. Different structure conformation in buffers with varied salt concentrations could be accounted for the adsorption behaviors of IgG in CFs with or without salt. We analyzed the secondary structure of IgG under the different buffer conditions used in this study by Circular Dichoism (CD) spectroscopy (Figure 6b). IgG has primarily antiparallel β-pleated sheets (β-helices), characterized by negative bands at 218 nm[60]. With 50- or 150-mM salt, this peak was clearly observable. There was no significant difference between the CD spectra of IgG in 50 and 150 mM sodium chloride, which was in agreement with what was seen in the F4 fractograms. However, it was reduced about 24% when there was no salt present. The CD spectra of HSA in the same solutions (Supporting Information, Figure S8c) showed the typical, negative signals at distinct wavelengths of 208 and 222 nm for α-helical proteins[60]. A small, ~7% signal reduction at both wavelengths with no salt indicated slight decrease in the α-helical content. Additionally, the normalized (against signal at 207 nm) signal at 211 nm, a wavelength commonly used in calculation of both helix and sheet structure in CD spectrum analysis[61], increased with the increasing salt concentration for IgG, while it remained constant for HSA (Supporting Information Figure S8d). This result is indicative of the secondary structure changing from the more organized beta-sheet to a more random distribution. The structural change implies that, without salt, IgG lost some of its rigidity, making it easier to adapt to the membrane surface via hydrophobic interaction, and thus more susceptible to adsorption onto the F4 membrane. In contrast, HSA structure experienced smaller change in CFs with salt or without salt, and the repulsion between HSA and RC could have contributed to the high recovery of HSA in F4.
6. CONCLUSIONS
In this study, adsorption of the unfunctionalized NPs onto the channel membrane in F4 with different types of CFs was investigated. Maintaining high electrostatic repulsion is the key to obtain high sample recovery when using F4 to separate NPs in buffers with high ionic strength. Owing to the Donnan exclusion effect, another possible way to improve recovery of porous particles at high ionic strength is by using the weakly dissociated anions, or by using particles having weak anion as the surface functional groups. Since the Donnan exclusion effect is related to the retention volume of liquid inside the NP structure, we could confirm the contribution of Donnan exclusion to NP adsorption by comparing the adsorption behaviors of NPs with different crosslinking degrees in future studies. NPs with higher crosslinking degrees have higher occluded liquid phase inside, and should be more resistant to adsorption in CF with high ionic strength induced by weakly ionized anions.
While electrostatic or hydrophobic interaction with membrane still plays an important role to protein adsorption on the membrane, our brief study on two selective proteins supported that protein conformation should also be taken into account. Previous knowledge on protein adsorption behavior on surface could guide the effort of minimizing protein adsorptions in F4. A more systematic investigation of a series of proteins with different structure stability is needed to test our hypothesis.
From the results of this study, we propose that selection of F4 conditions when analyzing NPs carrying proteins on the surface needs to consider protein-membrane interaction more, since protein determines the surface property and thus the electrostatic or hydrophobic interaction with the membrane. This conclusion was supported by our previous findings that the IgG-conjugated microspheres had a 93% recovery when the carrier fluid contained 10 mM phosphate and 50 mM NaCl which closely matches the results of our pure IgG under the same carrier fluid conditions[26]. Additionally, the size of particle is an important factor to be considered because it affects how close the particles are to the membrane and how strong the attractive van der Waals force is. This concept has been guiding us in our on-going study of NP-protein interaction and investigation of the bioconjugated NPs.
Supplementary Material
*Highlights (for review).
Key findings of this work:
High repulsive force between NPs and membrane can minimize particle adsorption
Weaker anion in solution or on NP surface causes lower NP adsorption at high conc.
Highly charged counter ions increases NP adsorption on membrane significantly
Protein conformation plays an important role in protein-membrane interaction
Acknowledgments
The project described was supported by Grant Number R21ES017870 from the National Institute of Environmental Health Sciences. The content is solely the responsibility of the authors and does not necessarily represent the official views of the National Institute of Environmental Health Sciences or the National Institutes of Health. Jonathan Ashby was supported by the National Science Foundation Graduate Fellowship under Grant Number DGE-0813967. The authors are also grateful for the support of Dr. Sharon Walker and Mr. Indranil Chowdhury on particle size and zeta-potential measurement.
Footnotes
Publisher's Disclaimer: This is a PDF file of an unedited manuscript that has been accepted for publication. As a service to our customers we are providing this early version of the manuscript. The manuscript will undergo copyediting, typesetting, and review of the resulting proof before it is published in its final citable form. Please note that during the production process errors may be discovered which could affect the content, and all legal disclaimers that apply to the journal pertain.
References
- 1.Baalousha M, Stolpe B, Lead JR. J Chromatogr A. 2011;1218:4078–4103. doi: 10.1016/j.chroma.2011.04.063. [DOI] [PubMed] [Google Scholar]
- 2.Bolea E, Laborda F, Castillo JR. Anal Chim Acta. 2010;661:206–214. doi: 10.1016/j.aca.2009.12.021. [DOI] [PubMed] [Google Scholar]
- 3.Gimbert LJ, Andrew KN, Haygarth PM, Worsfold PJ. Trends Anal Chem. 2003;22:615–633. [Google Scholar]
- 4.Kammer Fvd, Legros S, Hofmann T, Larsen EH, Loeschner K. Trends Anal Chem. 2011;30:425–436. [Google Scholar]
- 5.Benincasa M-A, Caldwell KD. J Chromatogr A. 2001;925:159–169. doi: 10.1016/s0021-9673(01)01011-1. [DOI] [PubMed] [Google Scholar]
- 6.Ratanathanawongs SK, Shiundu PM, Calvin Giddings J. Colloids Surfaces A. 1995;105:243–250. [Google Scholar]
- 7.Messaud FA, Sanderson RD, Runyon JR, Otte T, Pasch H, Williams SKR. Progr Polymer Sci. 2009;34:351–368. [Google Scholar]
- 8.Farmakis L, Koliadima A, Karaiskakis G, Zattoni A, Reschiglian P. Food Hydrocolloids. 2008;22:961–972. [Google Scholar]
- 9.Modig G, Nilsson L, Bergenståhl B, Wahlund K-G. Food Hydrocolloids. 2006;20:1087–1095. [Google Scholar]
- 10.Wittgren B, Wahlund K-G. J Chromatogr A. 1997;791:135–149. [Google Scholar]
- 11.Arifin DR, Palmer AF. Biotechnol Progr. 2003;19:1798–1811. doi: 10.1021/bp034120x. [DOI] [PubMed] [Google Scholar]
- 12.Citkowicz A, Petry H, Harkins RN, Ast O, Cashion L, Goldmann C, Bringmann P, Plummer K, Larsen BR. Anal Biochem. 2008;376:163–172. doi: 10.1016/j.ab.2008.02.011. [DOI] [PubMed] [Google Scholar]
- 13.Fraunhofer W, Winter G. Eu J Pharm Biopharm. 2004;58:369–383. doi: 10.1016/j.ejpb.2004.03.034. [DOI] [PubMed] [Google Scholar]
- 14.Kratochwil NA, Huber W, Müller F, Kansy M, Gerber PR. Biochem Pharmacol. 2002;64:1355–1374. doi: 10.1016/s0006-2952(02)01074-2. [DOI] [PubMed] [Google Scholar]
- 15.Madörin M, van Hoogevest P, Hilfiker R, Langwost B, Kresbach GM, Ehrat M, Leuenberger H. Pharm Res. 1997;14:1706–1712. doi: 10.1023/a:1012171511285. [DOI] [PubMed] [Google Scholar]
- 16.Park I, Paeng K-J, Yoon Y, Song J-H, Moon MH. J Chromatogr B. 2002;780:415–422. doi: 10.1016/s1570-0232(02)00630-x. [DOI] [PubMed] [Google Scholar]
- 17.Reschiglian P, Zattoni A, Roda B, Casolari S, Moon MH, Lee J, Jung J, Rodmalm Kr, Cenacchi G. Anal Chem. 2002;74:4895–4904. doi: 10.1021/ac020199t. [DOI] [PubMed] [Google Scholar]
- 18.Jackson BP, Ranville JF, Neal AL. Anal Chem. 2005;77:1393–1397. doi: 10.1021/ac049278q. [DOI] [PubMed] [Google Scholar]
- 19.Stolpe B, Guo L, Shiller AM, Hassellöv M. Marine Chem. 2010;118:119–128. [Google Scholar]
- 20.Siripinyanond A, Barnes RM. J Anal Atom Spectrom. 1999;14:1527–1531. [Google Scholar]
- 21.Augsten C, Mäder K. Intl J Pharmaceutics. 2008;351:23–30. doi: 10.1016/j.ijpharm.2007.09.013. [DOI] [PubMed] [Google Scholar]
- 22.Lim S, Lee S, Choi S, Moon J, Hong S. Desalination. 2010;264:236–242. [Google Scholar]
- 23.Melucci D, Guardigli M, Roda B, Zattoni A, Reschiglian P, Roda A. Talanta. 2003;60:303–312. doi: 10.1016/S0039-9140(03)00106-1. [DOI] [PubMed] [Google Scholar]
- 24.Rambaldi DC, Reschiglian P, Zattoni A, Johann C. Anal Chim Acta. 2009;654:64–70. doi: 10.1016/j.aca.2009.06.016. [DOI] [PubMed] [Google Scholar]
- 25.Nebe-von-Caron G, Stephens PJ, Hewitt CJ, Powell JR, Badley RA. J Microbiol Met. 2000;42:97–114. doi: 10.1016/s0167-7012(00)00181-0. [DOI] [PubMed] [Google Scholar]
- 26.Li J, Ge J, Yin Y, Zhong W. Anal Chem. 2008;80:7068–7074. doi: 10.1021/ac801251y. [DOI] [PubMed] [Google Scholar]
- 27.Li J, Zhong W. J Chromatogr A. 2008;1183:143–149. doi: 10.1016/j.chroma.2008.01.029. [DOI] [PubMed] [Google Scholar]
- 28.Chan CP-y. Bioanalysis. 2009;1:115–133. doi: 10.4155/bio.09.15. [DOI] [PubMed] [Google Scholar]
- 29.Rana S, Yeh Y-C, Rotello VM. Curr Opin Chem Biol. 2010;14:828–834. doi: 10.1016/j.cbpa.2010.10.001. [DOI] [PMC free article] [PubMed] [Google Scholar]
- 30.Song S, Qin Y, He Y, Huang Q, Fan C, Chen H-Y. Chem Soc Rev. 2010;39:4234–4243. doi: 10.1039/c000682n. [DOI] [PubMed] [Google Scholar]
- 31.Karmali PP, Simberg D. Expert Opin Drug Delivery. 2011;8:343–357. doi: 10.1517/17425247.2011.554818. [DOI] [PubMed] [Google Scholar]
- 32.Lynch I, Dawson KA. Nano Today. 2008;3:40–47. [Google Scholar]
- 33.Mahmoudi M, Lynch I, Ejtehadi MR, Monopoli MP, Bombelli FB, Laurent S. Chem Rev. 2011;111:5610–5637. doi: 10.1021/cr100440g. [DOI] [PubMed] [Google Scholar]
- 34.Lee E, Shon HK, Cho J. Biores Technol. 2010;101:1487–1493. doi: 10.1016/j.biortech.2009.08.041. [DOI] [PubMed] [Google Scholar]
- 35.Park N, Kwon B, Kim IS, Cho J. J Membrane Sci. 2005;258:43–54. [Google Scholar]
- 36.Ulrich A, Losert S, Bendixen N, Al-Kattan A, Hagendorfer H, Nowack B, Adlhart C, Ebert J, Lattuadae M, Hungerb uhler K. J Anal Atom Spectrom. 2012;27:1120–1130. [Google Scholar]
- 37.Ratanathanawongs-Williams SK. Flow Field-Flow Fractionation. In: Giddings JC, Schimpf ME, Caldwell K, editors. Field-Flow Fractionation Handbook. John Wiley & Sons, Inc; New York: 2000. pp. 257–278. [Google Scholar]
- 38.Schachermeyer S, Zhong W. Flow Field-Flow Fractionations: Analysis of Biomolecules and Their Complexes. In: Williams SKR, Caldwell KD, editors. Field-Flow Fractionation in Biopolymer Analysis. 2012. pp. 127–138. [Google Scholar]
- 39.Liu M-K, Li P, Giddings JC. Protein Sci. 1993;2:1520–1531. doi: 10.1002/pro.5560020917. [DOI] [PMC free article] [PubMed] [Google Scholar]
- 40.Roda B, Cioffi N, Ditaranto N, Zattoni A, Casolari S, Melucci D, Reschiglian P, Sabbatini L, Valentini A, Zambonin PG. Anal Bioanal Chem. 2005;381:639–646. doi: 10.1007/s00216-004-2860-2. [DOI] [PubMed] [Google Scholar]
- 41.Song JH, Kim W-S, Park YH, Yu EK, Lee DW. Bull Korean Chem Soc. 1999;20:1159–1164. [Google Scholar]
- 42.Yohannes G, Wiedmer SK, Elomaa M, Jussila M, Aseyev V, Riekkola M-L. Anal Chim Acta. 2010;675:191–198. doi: 10.1016/j.aca.2010.07.016. [DOI] [PubMed] [Google Scholar]
- 43.Nakanishi K, Sakiyama T, Imamura K. J Biosci Bioeng. 2001;91:233–244. doi: 10.1263/jbb.91.233. [DOI] [PubMed] [Google Scholar]
- 44.Rankl M, Ruckstuhl T, Rabe M, Artus GRJ, Walser A, Seeger S. ChemPhysChem. 2006;7:837–846. doi: 10.1002/cphc.200500448. [DOI] [PubMed] [Google Scholar]
- 45.Karaiskakis G, Douma M, Katsipou I, Koliadima A, Farmakis L. J Liq Chromatogr Relat Technol. 2000;23:1953–1959. [Google Scholar]
- 46.Karaiskakis G, Koliadima A, Farmakis L, Gavril D. J Liq Chromatogr Relat Technol. 2002;25:2153–2172. [Google Scholar]
- 47.Lioris N, Farmakis L, Koliadima A, Karaiskakis G. J Chromatogr, A. 2005;1087:13–19. doi: 10.1016/j.chroma.2005.01.029. [DOI] [PubMed] [Google Scholar]
- 48.Mori Y, Kimura K, Tanigaki M. Anal Chem. 1990;62:2668–2672. [Google Scholar]
- 49.Pasol L, Martin M, Ekiel-Jezewska ML, Wajnryb E, Blawzdziewicz J, Feuillebois F. Chem Eng Sci. 2011;66:4078–4089. [Google Scholar]
- 50.Hong JH, Kim W-S, Lee DW. J liquid chromatogr relat technol. 2003;26:3003–3035. [Google Scholar]
- 51.Parsegian VA. van der Waals Forces. Cambridge University Pr; 2006. [Google Scholar]
- 52.Fras L, Laine J, Stenius P, Stana-Kleinschek K, Ribitsch V, Dolec ek V. J Appl PolymerSci. 2004;92:3186–3195. [Google Scholar]
- 53.Ramesh Babu P, Gaikar VG. Separation and Purification Technology. 2001;24:23–34. [Google Scholar]
- 54.Kirby BJ, Hasselbrink EFJ. Electrophoresis. 2004;25:187–202. doi: 10.1002/elps.200305754. [DOI] [PubMed] [Google Scholar]
- 55.Oye G, Roucoules V, Cameron AM, Oates LJ, Cameron NR, Steel PG, Badyal JPS, Davis BG, Coe D, Cox R. Langmuir. 2002;18:8996–8999. [Google Scholar]
- 56.Eder K, Buchmeiser MR, Bonn GK. J Chromatogr, A. 1998;810:43–52. [Google Scholar]
- 57.Wang QC, Svec F, Freche JMJ. J Polymer Sci A. 1994;32:2577–2588. [Google Scholar]
- 58.Lu JR. Neutron Scattering Biol. 2006:265–282. [Google Scholar]
- 59.Gray JJ. Curr Opin Struct Biol. 2004;14:110–115. doi: 10.1016/j.sbi.2003.12.001. [DOI] [PubMed] [Google Scholar]
- 60.Greenfield NJ. Nat Protoc. 2006;1:2876–2890. doi: 10.1038/nprot.2006.202. [DOI] [PMC free article] [PubMed] [Google Scholar]
- 61.Raussens V, Ruysschaert JM, Goormaghtigh E. Anal Biochem. 2003;319:114–121. doi: 10.1016/s0003-2697(03)00285-9. [DOI] [PubMed] [Google Scholar]
Associated Data
This section collects any data citations, data availability statements, or supplementary materials included in this article.


