Abstract
Purpose
To evaluate the 3-T magnetic resonance spectroscopy (MRS) derived myocardial fat-signal fractions in comparison to those from 1.5-T MRS.
Material and Methods
We conducted phantom, ex-vivo and in-vivo myocardial specimen evaluations at both 1.5-T and 3-T using 1H-MRS. A phantom with nine fat-water emulsions was constructed to assess the accuracy of the spectroscopy measurements. Ex-vivo spectroscopy data were acquired in 70 segments from 21 autopsy heart slices. In-vivo spectroscopy data were acquired in the inter-ventricular septum from 22 human volunteers.
Results
Phantom experiments demonstrated that 1.5-T and 3-T measurements were highly correlated with the reference values (r= 0.78, p =<0.05). The ex-vivo and in-vivo experiments demonstrated an increase in signal-to-noise ratio (SNR) of 45 ± 73 % and 76 ± 72 % at 3-T compared to 1.5-T (p<0.05). The mean fat-signal fraction was similar at 3-T and 1.5-T (1.11±1.18 vs. 1.00±1.09, respectively, p=NS) in ex-vivo studies but were significantly different in the in-vivo studies (2.47±1.46 vs. 1.56±1.34, p<0.05). The fat-signal fractions from 3-T and 1.5-T correlated fairly well in all experiments.
Conclusion
3-T MRS has significantly greater SNR and could potentially be more accurate as compared to 1.5-T for quantification of myocardial fat fraction in in-vivo studies.
Keywords: myocardial fat, proton spectroscopy, fat fraction
Introduction
3-Tesla magnetic resonance (MR) scanners with whole-body volume radio-frequency (RF) coils have prompted an increased interest in high-field cardiac imaging. The signal-to-noise ratio (SNR) can potentially be doubled from 1.5-T to 3-T, which could provide efficient scanning and/or improved spatial resolution. Although signal gain and improved spectral resolution should be achieved at 3-T, possible impediments that 3-T imagers encounter include hardware limitations as well as other biophysical factors. Eddy current induced spectral distortions are more marked by the frequencies used at high fields. Eddy currents can also cause energy dissipation and SNR loss. Meanwhile, longer T1 relaxation times at high fields further saturate signal and lead to a decrease in the SNR. Moreover, amplified field inhomogeneity in combination with shortened T2 relaxation times lead to broadening of the line widths (LW) that might outweigh the increased chemical shift dispersion (higher spectral resolution to resolve the metabolites) at 3-T. Because of these potential limitations, and the growing interest in the assessment of myocardial diseases with 3-T scanners in the clinical environment, it is important to directly examine whether the doubled sensitivity afforded by 3T MRI translates to comparable or greater precision in the detection and quantification of myocardial fat deposition.
The performance of proton MR spectroscopy (1H-MRS) at various field strengths from 0.5-T to 7-T have been evaluated and compared in the human brain. For brain tumors (1–3), 3-T has benefits of a marginal increase in spectral quality and a significant increase in SNR. Similarly, Kang et al (4) showed that MRS derived fat-fraction estimates in the liver were reproducible across different scanner platforms and field strengths (1.5-T and 3-T).While fat quantification in the liver has been a well-researched area (5,6), measurement of myocardial fat deposition elsewhere in the human body has been developed more recently (7–12).
Fat content in the myocardium is normally very low (0.65%). In diabetes, however, increased myocardial fat content (0.96%) has been reported (13) and may contribute to myocardial dysfunction associated with diabetic cardiomyopathy (14–16). To date, myocardial fat determination has been measured at 1.5-T but given the very low myocardial fat fractions, methods to improve signal detection in the myocardium may increase the accuracy of myocardial 1H-MRS. Even small increases in myocardial fat (in the order of 0.1–0.2%) may be an early indication of myocardial disease development. A high specificity and sensitivity is therefore required for accurate clinical diagnosis. Thus, the purpose of this study was to compare myocardial fat measurements and the factors influencing them at field strengths of 1.5-T and 3-T. We also explored the noise-effect and the T2-effect on fat quantification using simulation methods and performed the study on fat-water phantoms, ex-vivo autopsy hearts to reduce the effects of motion inherent to in-vivo measurements and in-vivo human studies.
Theory
MRS Signal Model
Simulations were based on a fat signal model used by (8). Yu et al (17–19) showed that 6 fat peaks could be identified in peanut oil using 1H-MRS, whose chemical shift frequencies relative to the water frequency were labeled. Generally, for the measurement of myocardial fat, the methyl (0.9 ppm) and methylene (1.3 ppm) are used as they are the dominant fat peaks (7,12) and an important measure of heart health. The water suppressed technique is generally used to suppress the water signal and hence the visibility of the fat signal is amplified. However, the estimation can be erroneous because of the interference to the fat signals situated close to the water peak from the residual water signal. Hence, the myocardial fat quantification in our study was confined to methyl and methylene peaks only, measured as the fat-signal fraction (FF).
We can write a signal from a voxel (8,20,21) containing a mixture of fat and water as:
Here, M0 is the magnetization field, ρw and ρfp are the relative amplitudes of the water peak and that of the pth fat peak (p = 1,…P). fw and fp, Φw and Φфp, and LWw and LWp, are the corresponding resonant frequencies, phase factors and line-widths of the water and individual fat peaks respectively. The signal represented here is in the time domain, a Fourier transform of the above signal yields the required spectrum. We tested this signal model to study the effects of noise and line broadening on fat quantification. The exact values used in the equation above for simulation are obtained from (8) and are shown in Table 1.
Table 1.
Spectroscopic Model for Fat-Water Spectra.
| Location of peaks (ppm) | 5.3 | 4.7 | 4.2 | 2.8 | 2.1 | 1.3 | 0.9 |
|---|---|---|---|---|---|---|---|
| Amplitude % - Fat | 10 | 0 | 4 | 3 | 15 | 62 | 6 |
| Amplitude % - Water | - | 100 | - | - | - | - | - |
| Line Width (Hz) - 1.5 T | 11.5 | 9 | 25 | 11.5 | 25 | 11.5 | 11.5 |
| Line Width (Hz) - 3T | 23 | 18 | 50 | 23 | 50 | 23 | 23 |
Noise Influence on Fat Quantification
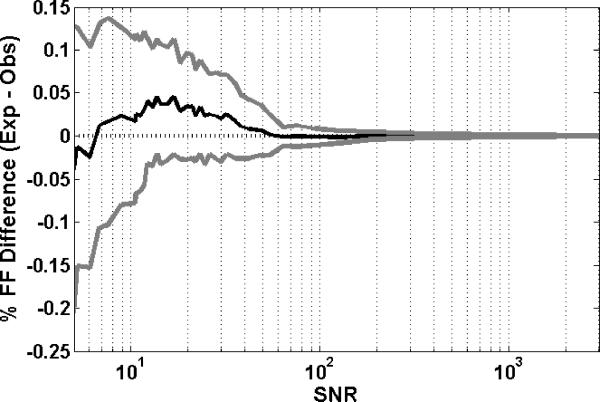
To test the effect of noise on fat quantification between 1.5-T and 3-T, noise simulated as normal distributed complex random numbers was added to each data point in the spectrum. The effect on FF measurements is demonstrated in Figure 1. In this simulation, a reference value of FF=1% was used, and SNR was varied between 5 and 3000. Each measurement was averaged over 100 repetitions of the simulation. It can be seen that as the standard deviation of noise was increased (or conversely the SNR decreased), the standard deviation of the difference (expected FF – observed FF) increased. Also, it was seen that as the SNR decreased, the FF was slightly underestimated as the spectral quality decreased.
Figure 1.
Simulated FF difference in a fat-water spectrum in the presence of noise at FF = 1%. The SNR is varied from 5 to 3000. The figure plots the mean and standard deviation of the difference [= FFexp−FFobs] in FF and the SNR. The values were averaged over 100 simulations at each SNR level.
T2 Effect on Fat Quantification
Secondly, we tested the effect of change in T2 (i.e. line-broadening) on FF quantification. No noise was added to this signal, SNR was consequently augmented to infinity. Since T2 is inversely proportional to the input LW, T2 shortening results in line-broadening. Spectra were created initially using the values in Table 1 and then generated subsequently by increasing the LW with the reference FF kept at 1%. The resulting FF was calculated. Figure 1 illustrates the relationship of the percentage difference in the observed FF between 1.5-T and 3-T with increased LW. It was seen that as the LWs were increased, the difference between the expected and the observed FFs increased. An increase in LW led to an underestimation of the measured FF since the spectral resolution deteriorated.
Combined T2 and Noise Effect on Fat Quantification
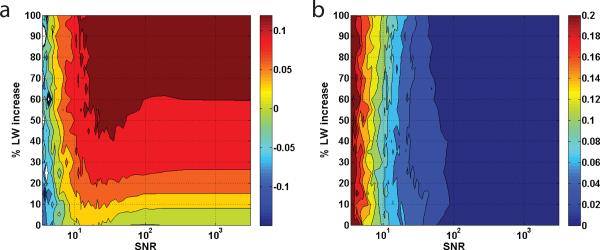
Finally, we considered the combined effect of noise and change in T2 on lipidic quantification. The FF was fixed at 1% while the LW was increased from 0% up to 100% of the original (Table 1Table 1). The SNR was varied between 5 and 3000. The mean and standard deviation of the difference FF (expected FF – observed FF) are plotted in Figure 3a and 3b. It can be observed from Figure 3a that the mean difference FF increases with both an increase in the LW and decrease in the SNR. The standard deviation of the differences at low SNR's increases greatly. The effect of T2 in combination with noise results in unpredictable FF measurements. This combination also decreases the accuracy of fat quantification regardless of field strength and in particular, it causes deterioration of reproducibility between field strengths.
Figure 3.
The effect of noise and LW broadening in the fat quantification. Simulation of MRS spectrum at FF = 1%. The line-widths are increased from 0% to 100% of the original values used in Table 1. The SNR is varied from 5 to 3000. (a) and (b) plot the mean and standard deviation of the difference [= FFexp−FFobs] in FF with respect to the SNR and the percent increase in LW. The color bar on the right is the reference for the observed mean and standard deviation of the differences.
Materials and Methods
Fat-Water Phantom and Myocardial ex-vivo specimens
A fat-water phantom was constructed similar to the one used by Bernard et al (22). In order to create homogenous oil-in-water emulsions that would remain stable for the duration of scanning, 15 mmol of the anionic surfactant (emulsifying agent) sodium dodecyl sulfate (Sigma-Aldrich, St. Louis, MO) was added to a liter of deionized and demineralized water and 5 g of carrageenan was dissolved in the solution using a magnetic stirrer hotplate heated to 50°C. Nine (total volume 50 mL) phantoms were constructed with the emulsions containing increasing amounts of peanut oil from 0.5 mL to 4 mL, and the ninth one of 5 mL. These were emulsified using a homogenizer. The gels remained stable; creaming did not occur during the time of imaging and coalescence did not occur at all.
All MRI/MRS ex-vivo studies were performed with the use of 1.5-T (Magnetom Avanto; Siemens Medical Solutions, Erlangen, Germany) and 3-T (Verio Tim; Siemens Medical Solutions, Erlangen, Germany) whole body MR scanners with a head coil. The spectroscopy imaging was performed with all phantoms positioned centrally and tightly packed in the head coil. The ex-vivo spectroscopy data was acquired in 70 segments from 21 autopsy heart slices at both 1.5-T and 3-T scanners. Heart slices were obtained from discarded tissue from the autopsy service at our institution with IRB approval, and after obtaining final myocardial diagnoses and history of diabetes, hypertension, and other major diseases, age, and sex, patient identifiers were removed. Hearts were sectioned in the routine manner and cross-sectional slices through both ventricles, generally midway between base and apex were obtained. The slices were fixed and stored in 10% formalin, generally for several months before scanning. When slices were obtained for this study, they were placed in water and soaked for 2–3 days prior to scanning to remove excess formalin. The slices were selected randomly based on availability of intact cross-sectional slices suitable for scanning, without any patient-specific data. As a consequence of the fixation, the slices were stiff. Slices were placed in a jar, filled with water, with a straw through the left ventricular cavity to keep the slices aligned and in place. The segments were classified as anterior, septal, posterior and lateral in each of the heart slices.
Myocardial 1H-MRS spectra were obtained using a single voxel point-resolved spectroscopy sequence (23), TR/TE = 3000/35 ms. For reliable measurement of the low-fat signals with adequate receiver gain and also to prevent spectral distortion due to digitization noise, one spectrum (24 averages) was recorded with WET (water suppression enhanced through T1 effects) water suppression, with 1024 data points. WET (24) achieves T1 and B1 insensitive suppression using four RF pulses with optimized flip angles. Another spectrum (24 averages) was recorded with the water suppression RF pulse power set to zero. Outer volume suppression using saturation bands was applied to exclude epicardial fat. Also, the data accumulation was localized in the mid-myocardial layer of the left ventricle, excluding both the sub-endocardium and the sub-epicardium.
In-vivo studies
The institutional review board at our institution approved all the experimental protocols and all participants provided written informed consent. 22 participants were recruited from a perspective study for the evaluation of subclinical atherosclerosis in HIV positive African-American cocaine users. Sixteen women with thirteen HIV positive and three controls, and eight men with six HIV positive and two controls were in the study cohort.
All in-vivo studies were performed on a 3.0-T MR scanner (Trio Tim; Siemens, Erlangen, Germany) and a 1.5-T (Magnetom Avanto; Siemens Medical Solutions, Erlangen, Germany) with a six-channel anteriophased-array torso coil and corresponding posterior coil elements resulting in 12 channels of data. A four-chamber view was used to position the spectroscopic volume (6- to 8-mL voxel) within the interventricular septum. Participants were instructed to breathe normally during spectroscopy. Myocardial 1H-MRS spectra were obtained with electrocardiogram gating during diastole, with navigator gating using a single voxel point-resolved spectroscopy sequence, TR/TE = 1-RR/35 ms. The navigator was placed across the liver-lung interface. For reliable measurement of the low-fat signals with adequate receiver gain and also to prevent the distorted spectrum due to digitization noise, one spectrum (32 averages) was recorded with WET water suppression, with 256 data. Another spectrum (8 averages) was recorded with the water suppression RF pulse power set to zero. Outer volume suppression using saturation bands was applied to exclude the lipids from ventricular blood flow and epicardial triglycerides. Scan time was ~15 min for 1H-MRS, including positioning, shimming, and acquisition (5–10 min).
Spectral Analysis
Ex-vivo spectroscopic data was acquired using TR = 3000 ms. Our internal measurement of the specimens' T1 values ranged between 400 to 600 ms. Hence, TR of 3000 ms was long enough for T1 recovery. Myocardial T1 has been documented to be around 1000 ms (25). In-vivo spectroscopic data acquisition was double triggered using electrocardiographic triggering and respiratory navigator echoes. Each acquisition was three to five times longer than 1-RR interval and eliminate the need for T1 correction. T2 correction was not performed as it is a tedious procedure which requires acquisitions at multiple TE times and complicated post-processing (26). Instead, short TE was used to reduce T2 effects.
Spectral analysis was done offline using MATLAB-based software developed in-house. After baseline and phase correction (27), estimated fat and water signals were fitted for accurate robust and efficient spectral fitting in the frequency-domain using line-shape fitting method (28), with the assumption of Gaussian curves. Resonance frequency estimates of lipids at 0.9 ppm and 1.3 ppm were summed to quantify myocardial fat content and related to estimated water in unsuppressed spectra (7). Myocardial FF was calculated as the ratio of the amplitude of myocardial fat content (peaks at 1.3 ppm and 0.9 ppm) to the amplitude of water content and reported as a percentage. The area under the Gaussian curve is defined as the amplitude. The line-width of the water and fat spectral peaks defined as the full-with-at-half-maximum of the Gaussian peaks is also measured from spectral fitting and is reported in Hertz (Hz) and parts-per-million (ppm). SNR of the acquired spectra was defined as the ratio of the height of the largest fat peak divided by the standard deviation of the amplitude of the signal in a signal-free part of the spectrum.
For the phantom experiments, the percent fat fraction by volume (i.e. reference fat fraction) of each vial was calculated based on the volume ratio of oil to total volume (i.e. water + oil) in each vial. The FF obtained from MRS can be related to the percent fat fraction by volume as shown in (29).
Statistical Analysis
LW values for water and individual fat peaks, the FF and the SNR produced by the scanners with different field strengths (1.5-T vs. 3-T) were compared using paired t-tests. Linear least-square fits of the data were calculated assuming the data went through the origin. Quality of fit was evaluated by the Pearson-r correlation coefficient. Statistical analysis was performed using Microsoft Excel 2007. A value of p less than 0.05 denotes statistical significance.
Results
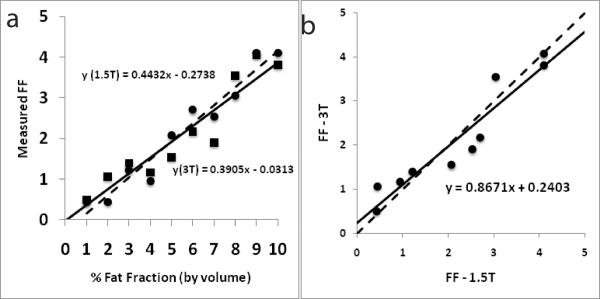
Figure 5a shows FF measured at 3-T and 1.5-T plotted against fat fraction represented by volume for the nine emulsions. The FF values at both 3-T (r = 0.94, p < 0.005) and 1.5-T (r = 0.98, p < 0.005) were highly correlated with the referenced fat fraction by volume. The two measures (from 3-T and 1.5-T) were highly correlated with each other as well (r = 0.98, p < 0.005, Figure 5b).
Figure 5.
(a) A plot with FF measurements at 3-T (black squares) and 1.5-T (black circles) plotted against the fat fraction by volume for the phantom experiments. The solid and dashed lines represent lines of regression at 3-T and 1.5-T respectively; (b) a plot of FF measurements from 3-T and 1.5-T against each other for the phantom experiments. The measurements were highly correlated (r = 0.98). The dashed line indicates perfect agreement. The intercept for the trend line (black) is shown.
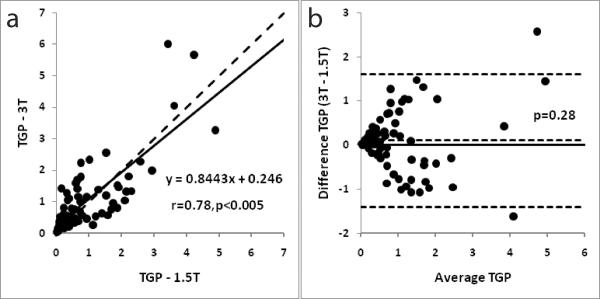
Figure 6a shows the correlation of FF between 3-T and 1.5-T. Figure 4b shows the corresponding Bland-Altman plot for the ex-vivo studies. FF measured at the two field strengths was significantly correlated (r = 0.78, p < 0.005). The mean FF obtained at 3-T was 1.11±1.18 and at 1.5-T it was 1.00±1.09. FF values were not significantly different (p = 0.28). There was no trend towards under or over estimation for either the 3-T or the 1.5-T data (Figure 6b).
Figure 6.
(a) A correlation plot with FF measurements from field strengths of 1.5-T and 3-T respectively for ex-vivo experiments. The dashed line indicates perfect agreement. The intercept for the trend line (black) is set to zero. The observed correlation between the measurements was r = 0.78 (p < 0.005); (b) Bland-Altman plot for FF measurements from field strengths of 1.5-T and 3-T respectively for the ex-vivo experiments. The dashed lines represent the mean and 2 SD of the difference. The solid line represents zero difference.
Figure 4.
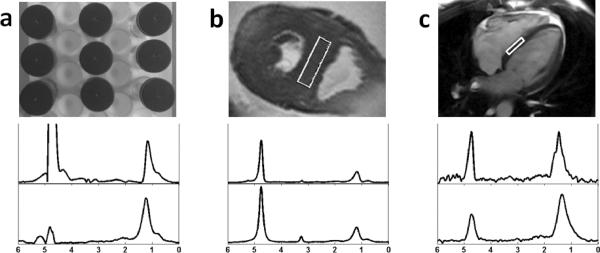
(a) Image shows setup of the fat-water phantom. (b) Image shows spectroscopic volume placement on the interventricular septum in an autopsy heart slice. (c) Image shows spectroscopic volume placement on the interventricular septum based on a 4-chambered cine view in an in-vivo study. Each image is accompanied by typical water-suppressed 1H spectra of myocardial tissue at magnetic field strengths of 3-T (top) and 1.5-T (bottom).
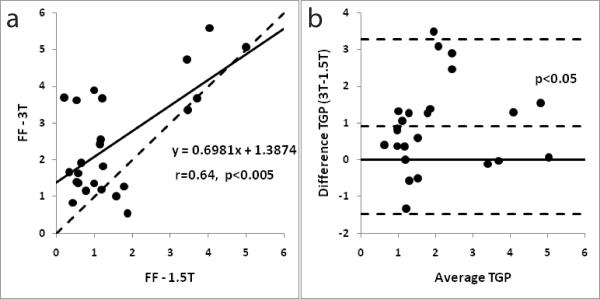
Figure 7a shows the correlation of FF between 3-T and 1.5-T. Figure 7b shows the corresponding Bland-Altman plot for the in-vivo studies. FF measured at the two field strengths was significantly correlated (r = 0.64, p < 0.005). The mean FF obtained at 3-T (2.47±1.46) was significantly higher (p<0.05) than those at 1.5-T (1.56±1.34).
Figure 7.
(a) A correlation plot with FF measurements from field strengths of 1.5-T and 3-T respectively for in-vivo experiments. The dashed line indicates perfect agreement. The intercept for the trend line (black) is set to zero. The observed correlation between the measurements was r = 0.64 (p < 0.005); (b) Bland-Altman plot for FF measurements from field strengths of 1.5-T and 3-T respectively for the in-vivo experiments. The dashed lines represent the mean and 2 SD of the difference. The solid line represents zero difference.
Table 2 compares ex-vivo and in-vivo results of the LWs measured at field strengths of 3-T to those measured at 1.5-T. The LWs in Hz were significantly higher at 3-T for both water and fat peaks. However, when LWs were compared in the ppm scale, the fat peaks were significantly narrower at 3-T than those at 1.5-T in the ex-vivo studies. In the in-vivo studies, both the fat and the water LWs were significantly narrower at 3-T than at 1.5-T.
Table 2.
The heart water and fat peak line-widths presented in Hertz (Hz) and ppm (part per million) as mean ± standard deviation - peaks at 1.3 ppm and 0.9 ppm for the ex-vivo data (N=70). A value of p less than 0.05 denotes significant difference in the 1.5-T and 3-T values.
| Ex-vivo | In-vivo | |||||
|---|---|---|---|---|---|---|
|
| ||||||
| Water | Methylene | Methyl | Water | Methylene | Methyl | |
| 4.7 ppm | 1.3 ppm | 0.9 ppm | 4.7 ppm | 1.3 ppm | 0.9 ppm | |
| 3T (Hz) | 19.6±14.1 | 29.5±9.7 | 34.5±28.7 | 23.1±6.0 | 26.2±10.3 | 24.1±18.7 |
| 1.5T (Hz) | 10.5±6.4 | 16.7±5.8 | 25.8±17.4 | 17.8±8.2 | 17.8±6.6 | 12.4±9.2 |
| p (1.5T vs. 3T) | <0.05 | <0.05 | <0.05 | <0.05 | <0.05 | <0.05 |
|
| ||||||
| 3T (ppm) | 0.16±0.11 | 0.24±0.08 | 0.28±0.23 | 0.19±0.05 | 0.21±0.08 | 0.20±0.15 |
| 1.5T (ppm) | 0.17±0.1 | 0.27±0.09 | 0.41±0.28 | 0.29±0.13 | 0.29±0.11 | 0.24±0.13 |
| p (1.5T vs. 3T) | 0.47 | <0.05 | <0.05 | <0.05 | <0.05 | 0.63 |
Table 3 displays the results of the SNR comparison. The mean SNR at 3-T was higher than 1.5-T SNR in the phantom studies but the difference was not significant. The mean SNR at 3-T was 45 ± 73 % higher than 1.5-T SNR in the ex-vivo studies. The difference was significant (p<0.05). The mean SNR at 3-T was significantly higher (p<0.05) than at 1.5-T in the in-vivo studies as well by 76 ± 72 %.
Table 3.
The signal-to-noise-ratio of the fat signal (peak at 1.3 ppm) presented as mean ± standard deviation for the ex-vivo, in-vivo and the phantom data. p less than 0.05 denotes significant difference in the 1.5-T and 3-T values.
| Phantom | Ex-vivo | In-vivo | |
|---|---|---|---|
| 3T | 969.2±1220.6 | 123.5±149.1 | 39.8±29.1 |
| 1.5T | 521.7±494.1 | 85.5±133.1 | 16.7±13.5 |
| p (1.5T vs. 3T) | 0.312 | <0.05 | <0.05 |
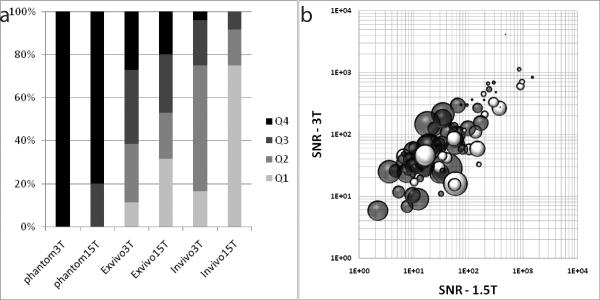
Figure 8a plots the distribution of SNR across the observed spectra from all the studies. The SNR from all spectra (in-vivo, ex-vivo and phantom) from both 1.5-T and 3-T were used to compute the quartiles of SNR distribution. The upper limit of the quartiles was: Q1 = 19.10, Q2 = 46.51, Q3 = 122.83 and Q4 = 4126.04. Figure 8b plots the percentage FF difference (bubble size) based on the observed SNR of both 1.5-T and 3-T. It was seen that the size of the bubbles was small when the SNR was high at both 1.5-T and 3-T.
Figure 8.
(a) A plot showing distribution of SNR measured across the different studies. Q1–Q4 are the quartiles calculated from the distribution of SNRs across all the studies and from both 1.5-T and 3-T. (b) A bubble plot of the SNR (logarithmic value) at 1.5-T and 3-T, and their relationship with the % FF differences [=100*(FF3T−FF1.5T)/ ((FF3T+FF1.5T)/2. The size of the bubble indicates the magnitude of the difference (bigger bubbles indicate larger differences). The grey bubbles are positive differences (FF3T>FF1.5T) and the white bubbles are negative differences.
Discussion
The accuracy and reproducibility of fat quantification is confounded by noise and T2 effects, which in turn depend on the field homogeneity and other hardware/system characteristics. The results of this study demonstrated that quantification of myocardial fat at 3-T and 1.5-T are highly correlated and reproducible in an ideal experimental setup. The TR was set at a relatively long value (3 seconds to reduce T1 weighting) and there was no concern with motion in the experiments. However, there were differences in the measured FF between the different datasets and the differences could result from either decreased SNR or increased peak line-widths.
The dependence of SNR on field strength has been explored in previous studies (1,2). For spectroscopy, it has been predicted that SNR (30) should increase linearly with field strength, provided that T1 and T2 do not change, experimental parameters remain constant, and RF penetration effects are not significant (31). It is also expected that spectral resolution (chemical shift, measured in Hz) will increase linearly with field strength. However, spectral resolution also depends on attainable LWs, which are a function of T2 relaxation times and field homogeneity. Therefore, anticipated linear improvements in SNR and spectral resolution will only be realized if these factors do not change significantly between field strengths.
Our results demonstrated a 76% increase in SNR at 3-T compared to 1.5-T in in-vivo studies and 45% in ex-vivo studies. The increase in SNR at 3-T would be particularly desirable for measurements of low fat fractions (lower signal levels) particularly those commonly measured in the myocardium. From Table 3, it is clear that the relative increase in SNR at 3-T compared to that at 1.5-T increases as we move from the phantom to ex-vivo to in-vivo studies. This loss of SNR in the in-vivo studies compared to the phantom studies can be attributed to magnetic field inhomogeneity due to tissue properties and inherent motion. Figure 8a also demonstrates that in the in-vivo studies, the SNR at 1.5-T was less than 20 in 18 of the 24 studies (75% of the studies). From the simulations, it is clear that a decrease in SNR leads to a loss in reliability of the measured FF as well as a slight underestimation on average (Figure 1). At very low SNR's (<20), the standard deviation of the error is very high. The need for a high SNR (>20) has been demonstrated and it has also been shown that 3-T spectra demonstrate higher SNR than 1.5-T especially in-vivo. To further examine how the SNR influences fat quantification at different magnetic fields, we combined the results from the experiments using the fat-water phantom with those from the ex-vivo and in-vivo experiments. Figure 8b demonstrates that when the SNRs were high at both 1.5-T and 3-T, the results were more consistent i.e. the percent FF difference was low.
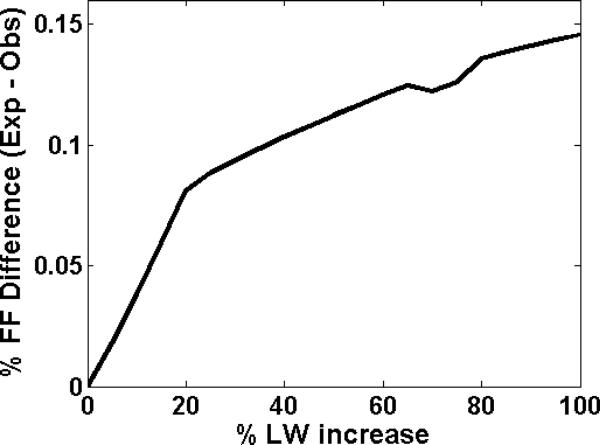
We observed that the fat LWs vary largely in both the 1.5-T and 3-T measurements in our experiments. Broad LW suggests a loss in spectral resolution since the two fat peaks situated in close proximity cannot be separately distinguished. Our simulated experiments indicated that a 20% increase in LW leads to an underestimation of the FF by nearly 10% (Figure 2). When LWs were compared in ppm, it was clear (from Table 2) that there was a significant decrease in the LW of the fat peaks at 1.3 ppm and 0.9 ppm respectively at 3-T compared to 1.5-T. This decreased line-width allows for better spectral resolution i.e. peak separation at 3-T.
Figure 2.
The effect of LW broadening in the fat quantification. Simulation of MRS spectrum at FF = 1%. The line-widths are varied based on the original values used in Table 1. The figure plots the difference [= FFexp−FFobs] in FF and the percent increase in LW.
The agreement between 3-T and 1.5-T reduced with decreasing SNR in the experimental studies. We also showed using simulations (in Figure 3) that the combined effect of reduced SNR and spectral resolution led to less reliable lipid quantification. Our 3-T results demonstrated higher SNR and better spectral resolution than those at 1.5T which potentially implied that myocardial fat measurements at 3-T are more reliable than those at 1.5-T. The higher SNR also suggests that a smaller voxel size could be obtained with adequate signal in the case of 3-T. This is particularly beneficial in in-vivo MRS of the heart where the voxels of interest lie within the thin myocardium of the left ventricular wall. Previously, it has been demonstrated that smaller voxel sizes result in greater spectral resolution (32).
Study Limitations
The study limitations include the minimal voxel thickness which was 1cm. While care was taken to place the voxel completely inside the LV wall myocardium, the thinness of some of the autopsy slices (1–2 cm) could have resulted in inhomogeneity of the B0 field inside the voxel. This could in turn lead to extra LW broadening. While reproduction of exact voxel location is difficult, utmost care was taken to place the voxel at the same location within the slice in both the 1.5-T and 3-T experiments. Differences in voxel location might lead to faulty comparisons of 3-T versus 1.5-T FFs, and this in turn could have contributed to some of the differences. In addition, we used a Gaussian function for the curve fitting, but some of the observed peaks might not be ideally Gaussian. The exact shape of the peaks is difficult to assess when there is significant peak overlap or other line broadening artifacts. Possibly, more complex fitting procedures (33) might be able to remove some of the errors due to curve fitting and line broadening. T2 correction is also an important factor in fat quantification (26). We did not perform the T2 correction. T2 correction requires T2's of both water and fat to be measured and the TE should be low enough to give a reliable estimation. Since we did not measure the T2 on individual specimens, we preferred not to use a single reported value for T2 correction. While this does not change the results of the comparison between 3-T and 1.5-T, the relation of the signal FF and the reference volume FF measured in the phantom is affected.
Conclusion
In conclusion, we have shown with phantom, ex-vivo and in-vivo cardiac experiments at 1.5-T and 3-T that SNR gain coupled with increased spectral resolution lead to more reliable fat fraction estimation and improved quantification of individual myocardial fat peaks at 3-T in comparison with similar measurements at 1.5-T.
Acknowledgments
The authors thank Aaron Flammang, PhD (Siemens Corporate Research) for help with experiment on the Siemens scanner.
Grant support: The study was supported by NIH grant R21HL098827.
References
- 1.Barker PB, Hearshen DO, Boska MD. Single-voxel proton MRS of the human brain at 1.5T and 3.0T. Magnetic Resonance in Medicine. 2001;45(5):765–769. doi: 10.1002/mrm.1104. [DOI] [PubMed] [Google Scholar]
- 2.Kim J-h, Chang K-H, Na DG, et al. Comparison of 1.5T and 3T 1H MR Spectroscopy for Human Brain Tumors. Korean J Radiol. 2006;7(3):156–161. doi: 10.3348/kjr.2006.7.3.156. [DOI] [PMC free article] [PubMed] [Google Scholar]
- 3.Gonen O, Gruber S, Li BSY, Mlynarik V, Moser E. Multivoxel 3D Proton Spectroscopy in the Brain at 1.5 Versus 3.0 T: Signal-to-Noise Ratio and Resolution Comparison. AJNR Am J Neuroradiol. 2001;22(9):1727–1731. [PMC free article] [PubMed] [Google Scholar]
- 4.Kang GH, Cruite I, Shiehmorteza M, et al. Reproducibility of MRI-determined proton density fat fraction across two different MR scanner platforms. Journal of Magnetic Resonance Imaging. 2011;34(4):928–934. doi: 10.1002/jmri.22701. [DOI] [PMC free article] [PubMed] [Google Scholar]
- 5.Qayyum A. MR Spectroscopy of the Liver: Principles and Clinical Applications. Radiographics. 2009;29(6):1653–1664. doi: 10.1148/rg.296095520. [DOI] [PMC free article] [PubMed] [Google Scholar]
- 6.Thomsen C, Becker U, Winkler K, Christoffersen P, Jensen M, Henriksen O. Quantification of liver fat using magnetic resonance spectroscopy. Magnetic Resonance Imaging. 1994;12(3):487–495. doi: 10.1016/0730-725x(94)92543-7. [DOI] [PubMed] [Google Scholar]
- 7.van der Meer RW, Doornbos J, Kozerke S, et al. Metabolic Imaging of Myocardial Triglyceride Content: Reproducibility of 1H MR Spectroscopy with Respiratory Navigator Gating in Volunteers1. Radiology. 2007;245(1):251–257. doi: 10.1148/radiol.2451061904. [DOI] [PubMed] [Google Scholar]
- 8.Liu C-Y, Redheuil A, Ouwerkerk R, Lima JAC, Bluemke DA. Myocardial fat quantification in humans: Evaluation by two-point water-fat imaging and localized proton spectroscopy. Magnetic Resonance in Medicine. 2010;63(4):892–901. doi: 10.1002/mrm.22289. [DOI] [PMC free article] [PubMed] [Google Scholar]
- 9.Kellman P, Hernando D, Arai A. Myocardial Fat Imaging. Current Cardiovascular Imaging Reports. 2010;3(2):83–91. doi: 10.1007/s12410-010-9012-1. [DOI] [PMC free article] [PubMed] [Google Scholar]
- 10.Beer M. Cardiac spectroscopy: techniques, indications and clinical results. European Radiology. 2004;14(6):1034–1047. doi: 10.1007/s00330-004-2279-3. [DOI] [PubMed] [Google Scholar]
- 11.McGavock JM, Victor RG, Unger RH, Szczepaniak LS. Adiposity of the Heart*, Revisited. Annals of Internal Medicine. 2006;144(7):517–524. doi: 10.7326/0003-4819-144-7-200604040-00011. [DOI] [PubMed] [Google Scholar]
- 12.Reingold JS, McGavock JM, Kaka S, Tillery T, Victor RG, Szczepaniak LS. Determination of triglyceride in the human myocardium by magnetic resonance spectroscopy: reproducibility and sensitivity of the method. American Journal of Physiology - Endocrinology And Metabolism. 2005;289(5):E935–E939. doi: 10.1152/ajpendo.00095.2005. [DOI] [PubMed] [Google Scholar]
- 13.Rijzewijk LJ, van der Meer RW, Smit JWA, et al. Myocardial Steatosis Is an Independent Predictor of Diastolic Dysfunction in Type 2 Diabetes Mellitus. Journal of the American College of Cardiology. 2008;52(22):1793–1799. doi: 10.1016/j.jacc.2008.07.062. [DOI] [PubMed] [Google Scholar]
- 14.McGavock JM, Lingvay I, Zib I, et al. Cardiac Steatosis in Diabetes Mellitus. Circulation. 2007;116(10):1170–1175. doi: 10.1161/CIRCULATIONAHA.106.645614. [DOI] [PubMed] [Google Scholar]
- 15.Rijzewijk LJ, Jonker JT, van der Meer RW, et al. Effects of Hepatic Triglyceride Content on Myocardial Metabolism in Type 2 Diabetes. Journal of the American College of Cardiology. 2010;56(3):225–233. doi: 10.1016/j.jacc.2010.02.049. [DOI] [PubMed] [Google Scholar]
- 16.Chiu H-C, Kovacs A, Blanton RM, et al. Transgenic Expression of Fatty Acid Transport Protein 1 in the Heart Causes Lipotoxic Cardiomyopathy. Circulation Research. 2005;96(2):225–233. doi: 10.1161/01.RES.0000154079.20681.B9. [DOI] [PubMed] [Google Scholar]
- 17.Yu H, Shimakawa A, McKenzie CA, Brodsky E, Brittain JH, Reeder SB. Multiecho water-fat separation and simultaneous R 2* estimation with multifrequency fat spectrum modeling. Magnetic Resonance in Medicine. 2008;60(5):1122–1134. doi: 10.1002/mrm.21737. [DOI] [PMC free article] [PubMed] [Google Scholar]
- 18.Hamilton G, Yokoo T, Bydder M, et al. In vivo characterization of the liver fat 1H MR spectrum. NMR in Biomedicine. 2011;24(7):784–790. doi: 10.1002/nbm.1622. [DOI] [PMC free article] [PubMed] [Google Scholar]
- 19.Ren J, Dimitrov I, Sherry AD, Malloy CR. Composition of adipose tissue and marrow fat in humans by 1H NMR at 7 Tesla. Journal of Lipid Research. 2008;49(9):2055–2062. doi: 10.1194/jlr.D800010-JLR200. [DOI] [PMC free article] [PubMed] [Google Scholar]
- 20.Gabr RE, Ouwerkerk R, Bottomley PA. Quantifying in vivo MR spectra with circles. Journal of Magnetic Resonance. 2006;179(1):152–163. doi: 10.1016/j.jmr.2005.11.004. [DOI] [PMC free article] [PubMed] [Google Scholar]
- 21.Maudsley AA, Govindaraju V, Young K, et al. Numerical simulation of PRESS localized MR spectroscopy. Journal of Magnetic Resonance. 2005;173(1):54–63. doi: 10.1016/j.jmr.2004.11.018. [DOI] [PubMed] [Google Scholar]
- 22.Bernard CP, Liney GP, Manton DJ, Turnbull LW, Langton CM. Comparison of fat quantification methods: A phantom study at 3.0T. Journal of Magnetic Resonance Imaging. 2008;27(1):192–197. doi: 10.1002/jmri.21201. [DOI] [PubMed] [Google Scholar]
- 23.Bottomley PA. Spatial Localization in NMR Spectroscopy in Vivo. Annals of the New York Academy of Sciences. 1987;508(1):333–348. doi: 10.1111/j.1749-6632.1987.tb32915.x. [DOI] [PubMed] [Google Scholar]
- 24.Ogg RJ, Kingsley RB, Taylor JS. WET, a T1- and B1-Insensitive Water-Suppression Method for in Vivo Localized 1H NMR Spectroscopy. Journal of Magnetic Resonance, Series B. 1994;104(1):1–10. doi: 10.1006/jmrb.1994.1048. [DOI] [PubMed] [Google Scholar]
- 25.Messroghli DR, Plein S, Higgins DM, et al. Human Myocardium: Single-Breath-hold MR T1 Mapping with High Spatial Resolution—Reproducibility Study1. Radiology. 2006;238(3):1004–1012. doi: 10.1148/radiol.2382041903. [DOI] [PubMed] [Google Scholar]
- 26.Sharma P, Martin DR, Pineda N, et al. Quantitative analysis of T2-correction in single-voxel magnetic resonance spectroscopy of hepatic lipid fraction. Journal of Magnetic Resonance Imaging. 2009;29(3):629–635. doi: 10.1002/jmri.21682. [DOI] [PMC free article] [PubMed] [Google Scholar]
- 27.Vanhamme L, Sundin T, Hecke PV, Huffel SV. MR spectroscopy quantitation: a review of time-domain methods. NMR in Biomedicine. 2001;14(4):233–246. doi: 10.1002/nbm.695. [DOI] [PubMed] [Google Scholar]
- 28.Mierisová S̆, Ala-Korpela M. MR spectroscopy quantitation: a review of frequency domain methods. NMR in Biomedicine. 2001;14(4):247–259. doi: 10.1002/nbm.697. [DOI] [PubMed] [Google Scholar]
- 29.Reeder SB, Hines CD, Yu H, McKenzie CA, Brittain JH. International Society for Magnetic Resonance in Medicine. Hawaii, USA: 2009. On The Definition of Fat-Fraction for In Vivo Fat Quantification with Magnetic Resonance Imaging; p. 211. [Google Scholar]
- 30.Edelstein WA, Glover GH, Hardy CJ, Redington RW. The intrinsic signal-to-noise ratio in NMR imaging. Magnetic Resonance in Medicine. 1986;3(4):604–618. doi: 10.1002/mrm.1910030413. [DOI] [PubMed] [Google Scholar]
- 31.Wen H, Denison TJ, Singerman RW, Balaban RS. The Intrinsic Signal-to-Noise Ratio in Human Cardiac Imaging at 1.5, 3, and 4 T. Journal of Magnetic Resonance. 1997;125(1):65–71. doi: 10.1006/jmre.1996.1072. [DOI] [PMC free article] [PubMed] [Google Scholar]
- 32.Li BSY, Regal J, Gonen O. SNR versus resolution in 3D 1H MRS of the human brain at high magnetic fields. Magnetic Resonance in Medicine. 2001;46(6):1049–1053. doi: 10.1002/mrm.1297. [DOI] [PubMed] [Google Scholar]
- 33.Poullet J-B, Sima DM, Van Huffel S. MRS signal quantitation: A review of time- and frequency-domain methods. Journal of Magnetic Resonance. 2008;195(2):134–144. doi: 10.1016/j.jmr.2008.09.005. [DOI] [PubMed] [Google Scholar]


