Abstract
Projection incompleteness in X-ray computed tomography (CT) often relates to sparse sampling or detector gaps, and leads to degraded reconstructions with severe streak and ring artifacts. To suppress these artifacts, this study develops a new sinogram inpainting strategy based on sinusoid-like curve decomposition and eigenvector-guided interpolation, where each missing sinogram point is considered located within a group of sinusoid-like curves, and estimated from a eigenvector-guided interpolation to preserve the sinogram texture continuity. The proposed approach is evaluated on real 2D fan-beam CT data, for which the projection incompleteness, due to sparse sampling and symmetric detector gaps, is simulated. A Compute Unified Device Architecture (CUDA) -based parallelization is applied on the operations of sinusoid fittings and interpolations to accelerate the algorithm. A comparative study is then conducted to evaluate the proposed approach with two other inpainting methods and with a compressed sensing iterative reconstruction. Qualitative and quantitative performances demonstrate that the proposed approach can lead to efficient artifact-suppression and less structure-blurring.
Keywords: computed tomography (CT), sinogram completion, detector truncation, sparse sampling
1. Introduction
In X-ray computed tomography (CT), sparse sampling and detector gaps are two typical cases of sinogram incompleteness [1–7]. Sparse sampling with limited projections of views has wide applications in fast scanning (~4–10s) such as cardiac CT and neonate CT examination [2–3]. Detector gaps in sinogram are generally caused by physical damage of CT detectors along some specific projection views [4–6]. However, sinogram data missing from sparse sampling and detector gaps often lead to degraded CT images with severe streak or ring artifacts.
To suppress these artifacts, many approaches have been proposed in the last decade. They are generally classified as inpainting-like and statistical methods. Typical inpainting-like techniques include TV (total variation) inpainting [7–8], partial differential equation (PDE) based inpainting [9–10] and directional interpolation [11]. In some of these methods such as in [12–14], the inherent property of sinusoid-like curve (S-curve) composition is exploited to restore the incomplete sinograms. The second category of methods, which has been higly developped in the literature, makes use of statistical methods with prior constraints to suppress these artifacts. Some approaches such as maximum likelihood expectation maximization (MLEM) [15–16], Bayesian based EM optimization [17] and TV-based compressed sensing (CS) reconstructions [18–21], were found to be efficient in improving the reconstructed images in the presence of sparse sampling and detector gaps. It was noted in [16] that statistical reconstruction allows suppression of the artifacts brought on by the asymmetric detector gaps, but remains inefficient to remove the artifacts brought on by the symmetric detector gaps. In [13–14], the intensities of the unmeasured points were set to the minimum intensities of the known intensities along the decomposed S-curves. This method was shown to be effective in the case of external truncation because the high attenuation tissues are always located within the internal field of view [14]. Nevertheless, this method might not work in the cases of detector gaps and sparse sampling, in which the missing sinogram data correspond to tissues or structures for which there is a high attenuation.
In this paper, with an aim to provide effective sinogram completion for sparse sampling and detector gaps, we proposed a new strategy of inpainting, which includes three steps: S-curve decomposition, sinusoid fitting and eigenvector-guided interpolation, respectively. The first step is performed to determine the family of S-curves that goes through each unmeasured sinogram point [12–14]. In the second step, a sinusoid fitting method is applied to retrieve the S-curves that go through each sinogram point with unmeasured intensity. Finally, to estimate the unmeasured sinogram intensities, an eigenvector-guided interpolation is realized to determine the S-curve to be used for interpolation. This process is described in section 2. In section 3, sparse sampling and symmetric detector gaps under 2D fan-beam CT geometry are then simulated to validate the effectiveness of the proposed method and Compute Unified Device Architecture (CUDA) based parallelization is performed to accelerate the sinusoid fitting and interpolation operations [22–25]. Section 4 provides a qualitative and quantitative evaluation of the method as well as a comparison with two other inpainting methods and a CS iterative reconstruction algorithm. Results show that better performances can be reached with our approach in the cases of sparse sampling and detector gaps. Section 5, finally, concludes on the relevance of the method.
2. Method
A. Geometry and sinogram decomposition
Let consider the notations listed in Table 1 and the 2D fan-beam CT geometry as illustrated in Fig. 1:
Table 1.
Parameter definition for the 2D fan-beam CT geometry (FOV denotes the field of region within the attenuation object).
| O, Q | isocenter of FOV and X-ray source | θ⃗ | unit ray directional vector |
| y⃗(β) | circular trajectory of Q | X | coordinate position |
| β | projection view | rϕ | radial distance between X to O |
| γ | fan angle | ϕ | directional angle of rϕ |
| R | source-to-isocenter distance | Rv | radial distance between M (N) to O |
| θm | angle range of the discrete S-curves | ϕ0 | directional angles of |
| P | middle point of | ϕ1 | directional angles of |
| M, N | points linking the boundary of FOV | ϕ2 | directional angles of |
Fig. 1.
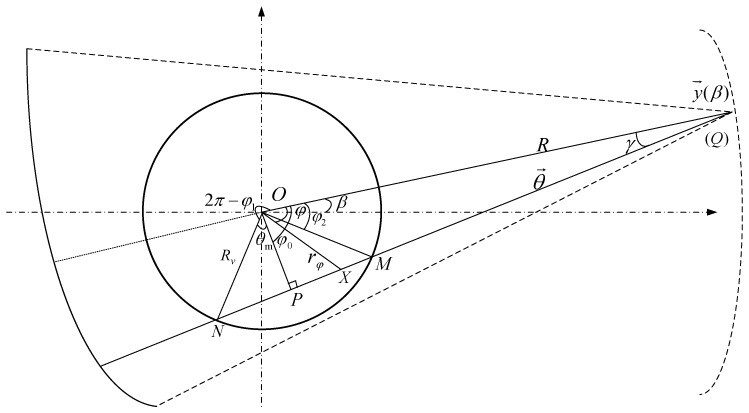
Fan beam geometry and sinogram decomposition
X-ray source Q rotates around the object along the circular trajectory with the angle view β. μ(X) denotes the intensity at position X in the target 2D attenuation distribution. If R denotes the source-to-isocenter distance, the circular trajectory of Q can be given by:
| (1) |
The projection of each X-ray can be jointly defined by the projection view β and the fan angle γ. The fan-beam transformation is given by:
| (2) |
where, θ⃗ denotes the unit ray directional vector and is calculated as [cos(β + γ),sin(β+ γ)]. β ∈ [0, V] and γ ∈ [−D, D − 1], with V and D denoting the total projection number and the half detector dimension, respectively. In Eq. (2), t denotes the integral path along each ray, which leads to the sinogram intensity at point (β, γ). From [13], we know that each point in the reconstructed image uniquely corresponds to one specific S-curve in sinogram space, and the sinogram data g to the superposition of all the S-curves.
Fig. 2 illustrates the sinogram decomposition. M and N are two points lying on the boundary of the region of interest. ϕ1, ϕ2 and ϕ0 denote the directional angles of and , respectively. is orthogonal to the secant line . Rv is the radial of the Field of View (FOV). Considering ∠MOP = ∠NOP = θm, θm determines the angle range of the discrete family of the S-curve. is orthogonal to .
Fig. 2.
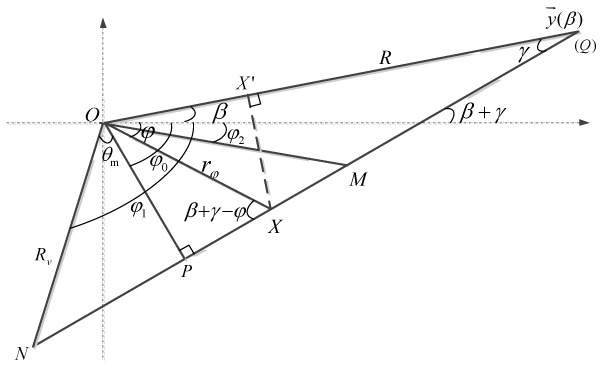
Illustration of sine curve decomposition.
| (3) |
Then, ϕ1, ϕ2 and ϕ0 can be explicitly given as follows:
| (4) |
Based on the geometry of the triangle ΔPOX, we can set:
| (5) |
Considering the radial distance rϕ, and the geometry of the triangle ΔOXX′ and ΔQXX′, we can compute the following:
| (6) |
From Eq. (6), we can obtain the relation between γ and β, rϕ, R:
| (7) |
Here, each sinogram point (β, γ) is from the path of the X-ray beam MN, and the point X moves from M to N as ϕ varies from ϕ2 to ϕ1. Then from the set of all the points in MN, we can determine a set of S-curves S(β, γ) going through point (β, γ) in the sinogram space (as illustrated in Fig. 3):
| (8) |
where, β̑ ∈ [0, 2π] and ϕ ∈ [ϕ1, ϕ2].
Fig. 3.
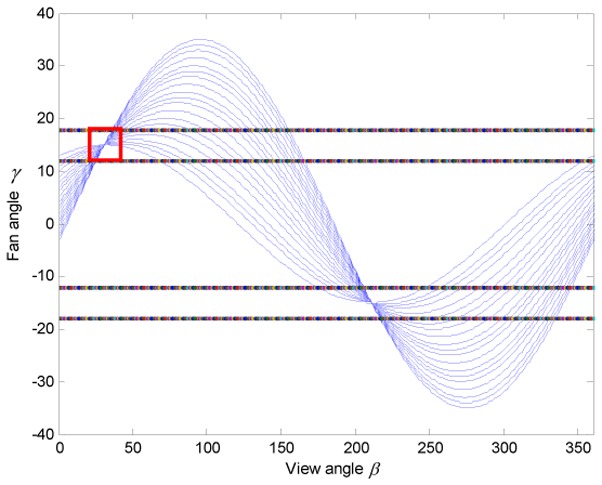
A family of S-curves going though the point (β, γ) in the sonogram
B. The method
Each unmeasured S-point (β, γ) lies within a group of S-curves S(β, γ), so the interpolation of each S-curve going through the point (β, γ) will lead to one estimation. Therefore all the S-curves going through the point (β, γ) should be jointly considered to estimate the intensity at (β, γ). We thus developed thus an eigenvector-guided interpolation to estimate the intensities of the S-points. To perform this interpolation, we set a patch (as the red rectangle in Fig. 3) P centered at the current unmeasured point. Then, taking into account the local sinogram structure, the tensor product matrix T for patch P is calculated in Eq.(9) as the convolution of a kernel K(•) and the tensor production of the partial differentiation matrix of P:
| (9) |
where, ∂P(x)/∂x and ∂P(x)/∂y are the first order partial differentials of patch P along the horizontal and vertical directions. Matrix K is set to identity matrix because the sinograms are assumed to be free of noise. We compute the eigenvalue and eigenvector of T. Then for each S-point (β, γ), according to the tensor theory in [26] and as illustrated in Fig. 4, the eigenvector corresponding to the maximum eigenvalue of T represents the direction of the largest intensity variation, while the eigenvector with the minimum eigenvalue of T denotes the direction of the smallest intensity variation, this latter one being able to used to represent the local edge direction. To preserve the original local sinogram textures, we choose the interpolated S-curve whose direction is the closest to the vector among all the interpolated S-curves going through (β, γ), and we set the intensity at the unmeasured point (β, γ) to the interpolated intensity at point (β, γ) in the chosen S-curve. If the point (β, γ) belongs to a local homogeneous region other than an edge region, this choice of the S-curve with the best match to the direction will also not damage the region consistency because the eigenvalues of T tend to be equal in this case.
Fig. 4.
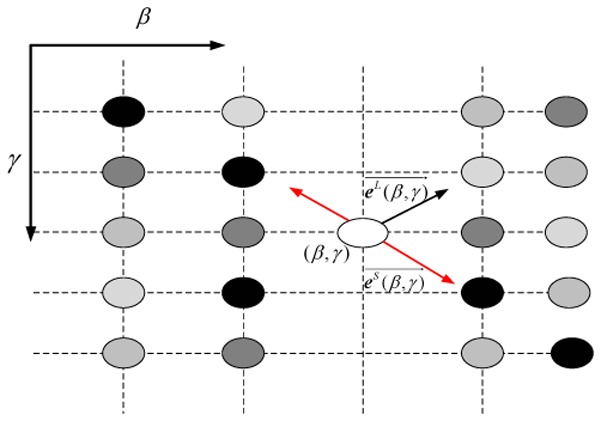
Eigenvalue analysis of one patch P in the sinogram. β and γ characterize the projection view and the detector coordinate, respectively. and correspond to the direction of the largest and smallest intensity variation, respectively.
We applied the Jacobi rotation method [27] to calculate the eigenvalues of the symmetric block matrix T [11] and identify the eigenvector associated with the smallest eigenvalue. The least-square method is used to find the interpolated S-curve with the closest direction to the vector . In this least-square method, we define each feature line in the sinogram coordinate as:
| (10) |
where, (xk, yk) denotes the parametric coordinate of point (β, γ). xe and ye are the two vector units of . Then the S-curve with the least Euclidean distance to the feature line is chosen as the interpolated S-curve with the closest match with vector .
In summary, we outline the steps in the proposed approach as follows:
-
Step 1
Compute a family of S-curves S(β, γ) for a unmeasured sinogram point (β, γ) according to Eqs. (3)–(8).
-
Step 2
For each S-curve in the S-curve family S(β, γ), estimate the positions and intensities of the unmeasured points by sinusoid fitting and cubic spline interpolation, using all the measured points in each S-curve.
-
Step 3
Compute the tensor product matrix T for a patch P using Eq. (9), and then calculate the eigenvalues and eigenvectors of T by Jacobi rotation.
-
Step 4
According to the direction of eigenvector with the minimum eigenvalue, determine the ultimate estimation of this current S-point (β, γ) from all the candidate estimations.
-
Step 5
Estimation of unmeasured points is performed sequentially from the upper left to the lower right corner. Repeat Step 1–Step 4 recursively until all the unmeasured sinogram points are estimated.
Fig. 5 illustrates the process of estimating one specific unmeasured point.
Fig. 5.

Inpainting process at one unmeasured point. (a) original sinogram: the patch P is centered at the unmeasured point (b) the family of S-curves going through the unmeasured point are fitted and interpolated using the fitting method and cubic spline interpolation; (c) The estimation of the central point is determined from the eigenvector-guided interpolation process.
3. Experiment Settings
Experiments were conducted on fan-beam clinical data to test the proposed approach. The 2D dataset was acquired on a Siemens Somatom scanner. Shown in Fig. 6 (a), the original complete sinogram data is from one pelvis scanning of a 56-year-old male patient. The scanning protocol is 100 mAs, 120kVp, 6 mm slice-thickness, 256 radial samples and 360 angular samples. The source circle radius and the detector-center distance are 816 mm and 408mm. The target image size is 512 × 512. The acquired sinogram was normalized, corrected for attenuation and scatter and then rebinned to parallel format. We applied a Filtered Back Projection (FBP) reconstruction algorithm with a Ramp kernel to build the image (Fig. 6 (d)) from the original complete sinogram (Fig. 6 (a)). As illustrated in Fig. 6 (b) and (c), sparse sampling and detector gaps are respectively simulated. In the case of sparse view sampling, projection data contains 90 views on the 360. Fig. 6 (c) illustrates the simulated detector gaps, in which two 10 detector gaps are symmetrically located on each side of the center-of-detector. Fig. 6 (e) and (f) show the reconstructed images from these two sinograms. We can see in Fig. 6 that the data missing from sparse sampling and detector gaps significantly degrades the reconstruction by introducing severe cyclic and streak artifacts in the reconstructed images.
Fig. 6.
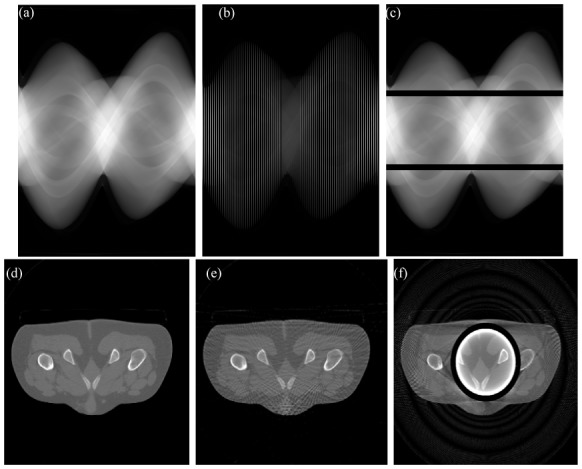
Reconstruction of incomplete sinograms. (a), original complete sinogram; (b), simulated sinogram with a sparse sampling: 90 projection views on 360 are available; (c), simulated sinogram containing 2 symmetric detector gaps: two 10 row detector gaps are located at each side of the center-of-detector; (d), image reconstructed from the complete sinogram in (a); (e), image reconstructed from the sparse sampling sinogram in (c); (f), image reconstructed from the sinogram including detector gaps in (d). We can note that the data missing from sparse sampling and detector gaps leads to degraded reconstructions with severe cyclic and streak artifacts.
We then compare then our approach with two other inpainting methods which are linear interpolation and TV inpainting. For all the inpainted sinograms, the FBP algorithm is applied with a Ramp filter to obtain the reconstructed images.
Linear interpolation estimates the unmeasured sinogram data using a linear weighting that is inversely proportional to the spatial distance between the known data and unmeasured data. Based on [26], 1-D linear interpolation along both the projection view and the detector ordinate are applied to interpolate the missing data for sparse sampling and detector gaps, respectively.
TV inpainting estimates the unknown data by computing the numerical solution to the partial differential equation (PDE) [7]. The PDE equation includes a positive shifting parameter to avoid zero denominator, and a time parameter to determine the maximum iteration to inpaint all the missing points.
We also compare the reconstruction results from the proposed inpainting with the TV-based CS statistical algorithm in [18–21]. In this method, the artifact suppressed CT image μ̂ is obtained by minimizing the energy function that combines the ℓ2 data consistency term in sinogram space with the ℓ1 TV term in image space:
| (11) |
| (12) |
where, g is the measured projection sinogram data, A is the system matrix and D is the diagonal covariance matrix. Matrixes A and D can be determined well from the fan-beam CT geometry. and denote the linear operators corresponding to the horizontal and vertical first order differences at pixel j, respectively. ε is a small positive number introduced to avoid a zero denominator. Parameter β controls the trade-off between the data consistency and the TV terms.
In the experiments, the parameters involved in the different methods are set to minimize the mean square error (MSE) on the sinogram. The parameter β in TV-based CS reconstruction is set using the rule of MSE minimization on the reconstructed images. The MSE value for the inpainted sinogram ( MSEg ) and the reconstructed images ( MSEμ) are respectively given by Eqs. (13) and (14):
| (13) |
| (14) |
where, Ng and Nμ denote the total element numbers in the sinograms and the reconstructed images, respectively. g and go denote the inpainted sinograms and the original complete sonogram respectively, μ and μo denote the reconstructed images from the inpainted sinogram g and the reference reconstructed image (Fig. 6(d)) from the original complete sinogram go.
In our approach, to limit the computational costs, we choose equidistantly discretized S-curves in the estimation of each of the unmeasured points. Patch size P has to be suitably set to characterize local sinogram textures. It has to be larger than the original gaps to guarantee the original known intensity information is used for inpainting. Nevertheless a too large Patch may include many non-local distributed structures, and might cause a failure in characterizing the local intensities. Additionally, a large P increases the computationnal costs of the eigenvalues and eigenvectors. Therefore, the size definition of P should consequently take into account the practical distribution of the missing data in sinogram. We also found the proposed approach was not sensitive to the size of P. No visual difference could be detected if we changed the patch size from 7 × 7 to 15 × 15 for the case of sparse sampling.
A GPU implementation using the Compute Unified Device Architecture (CUDA) framework was applied to accelerate the process of fitting and interpolation of all the S-curves on each unmeasured points. Routinely, the CUDA computation model is broken down into a host (CPU) and the device (GPU), both of which are connected by PCI-E bus. Threads, blocks and grids make up of the physical structure of a CUDA multithreading frame [22–25]. Once the data enter device memory and are ready to be processed, kernel functions are called to fit and interpolate the S-curves simultaneously. The algorithms have been written in C language using the MATLAB release R2006b and NVIDIA CUDA libraries and were run on a PC with an Inter Xeon processor, 3.4 × 2 GHZ, 8G RAM and GPU (NVIDIA GTX465).
4. Results
4.1. Experiments on a sparse sampling sinogram
Parameter setting for the different methods are listed in Table. 2. Fig. 7 (a)–(c) show the inpainted sinograms from linear interpolation, TV inpainting and the proposed inpainting method. The delineated ROIs in Fig. 7 (a)–(c) are zoomed in Fig. 7 (a1)–(c1). Fig. 7 (d1) provides the corresponding zoomed ROI of the original reference sinogram of Fig. 6 (a). These enlarged regions show that our proposed method can lead to a better restoration of the sinogram textures. Fig. 8 (a)–(c) display the reconstructed images from the inpainted sinograms of Fig. 7 (a)–(c). We can still note that the proposed inpainting provide a better reconstruction with more effective artifact-suppression and structure-preservation than with the other methods. The iterative TV-based CS reconstruction in Fig. 8 (d) also demonstrates a good artifact-suppression property. Comparing with the TV-based CS reconstruction, the proposed approach provides a reconstruction with comparable artifact-suppression, and a better preservation of fine structures.
Table 2.
Parameter setting in the experiments on sparse sampling sinograms
| Method | Parameter settings |
|---|---|
| Linear interpolation [26] | 5 points in each symmetric side are used in the interpolation |
| TV inpainting [7] | Inpainting time: 300; Positive shifting parameter: 1 × 10⁻⁶ |
| Proposed inpainting | Size of patch P: 11 × 11; Number of discretized S-curves: 10; 11 points with the current point being the center are used in the calculation of the least Euclidean distance |
| TV-based CS reconstruction [21] | Iteration number: 500; β = 0.5; ε = 1 ×10⁻⁵ |
Fig. 7.
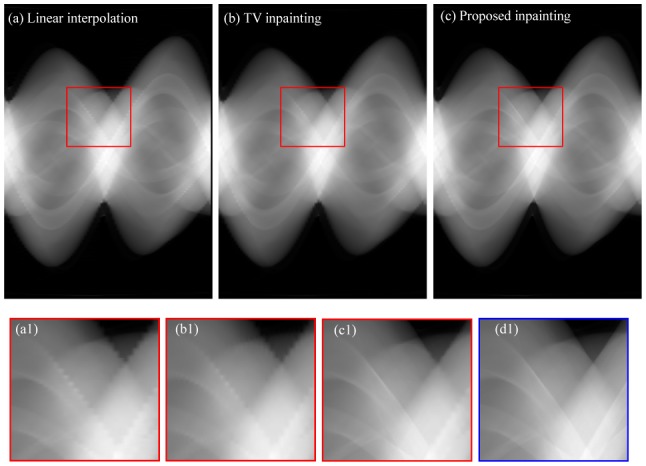
Inpainting results in the experiment of sparse sampling after application of (a), the linear interpolation; (b), the TV inpainting method in [7]; (c), our proposed method; (a1)–(c1): Zoomed ROI from (a)–(c); (d1) is the zoomed region from the original complete reference sinogram in Fig. 6 (a).
Fig. 8.
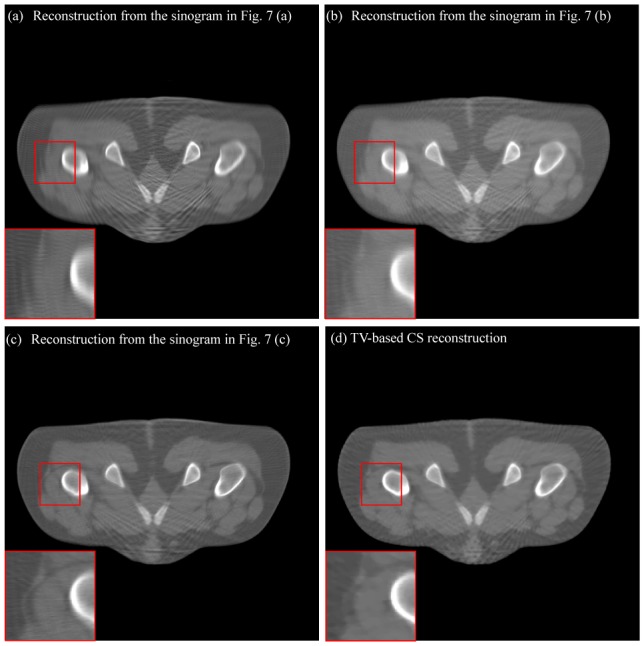
Reconstruction results in the experiment of sparse sampling. (a)–(c), from the corresponding inpainted sinograms in Fig. 7 (a)–(c) and (d) from the TV-based CS method. We can note that the proposed inpainting can lead to reconstruction with better artifact-suppression and structure-preservation than the other inpainting methods, and reconstruction comparable to the TV-based CS reconstruction can be obtained from the inpainted sinogram using the proposed method.
Fig. 9 plots the profiles along the 245th rows in the reconstructed images of Fig. 8. This graph confirms the performance of our approach by showing better agreement with the reference image (Fig. 6 (d)) than is found with the other methods. The MSE computed for both the inpainted sinograms and the reconstructed images are given in Table. 3 for each method. The figures confirms the supremacy of our approach with a MSE that is the lowest in the set of all methods.
Fig. 9.
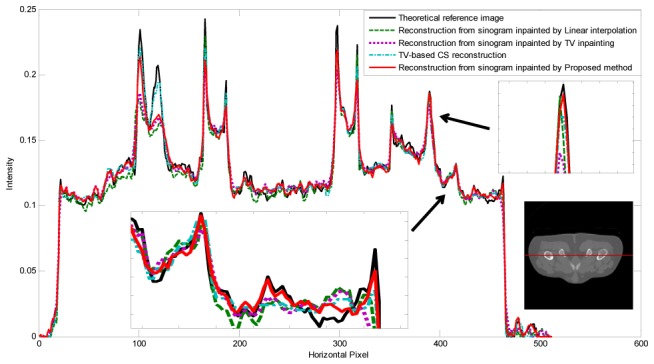
Illustration of the profiles along the 245th rows in the reconstructed images in Fig. 8
Table 3.
| Linear interpolation | TV inpainting | Proposed method | TV-based CS reconstruction | |
|---|---|---|---|---|
| MSE of inpainted sinograms | 0.2166 | 0.2390 | 0.1647 | |
| MSE of reconstructed images | 2.3910 | 2.2175 | 1.5165 | 1.6126 |
4.2. Experiment on detector gaps
In [16], Zbijewski et al. tested the application of the iterative reconstruction algorithm in the case of an incomplete CT sinogram with non-continuous detectors. The authors pointed out that, although the method was able to reconstruct artifact-free images from sinograms containing asymmetric detector gaps, the iterative algorithm was inefficient in suppressing artifacts when sinograms contained symmetric detector gaps. We applied our proposed inpainting to suppress the artifacts in Fig. 6 (f), which were caused by symmetric detector gaps in the sinogram and compared the results with those obtained from the 2 inpainting methods and the TV-based CS reconstruction algorithm. The parameter settings for the different methods are provided in Table. 4.
Fig. 10 (a)–(c) show the completed sinograms from linear interpolation, TV inpainting and our proposed inpainting method and the zoomed ROIs in Fig. 10 (a)–(c) are displayed in Fig. 10 (a1)–(c1). Fig. 10 (d1) displays the corresponding zoomed region in the original complete sinogram. Keeping the original complete sinogram (Fig. 6 (a)) as the reference, we can observe in Fig. 10 that linear interpolation and TV inpainting fail to restore the original sinogram textures, while our proposed method allows a better restoration of sinogram textures. Fig. 11 (a)–(c) depict the reconstructed images from the corresponding inpainted sonograms in Fig. 10 (a)–(c). We can observe that, with respect to the reference reconstruction in Fig. 6 (d), the proposed inpainting method still give a reconstruction with less artifacts than the other inpainting methods. Fig. 11 (d) shows the images from the TV-based CS reconstruction algorithm. We can note that the TV constraint leads to smooth structures without significantly improved artifact suppression. Compared with the TV-based CS reconstruction, the proposed approach is more efficient (Fig. 11 (c)) in suppressing ring artifacts, and preserving original structures.
Fig. 10.
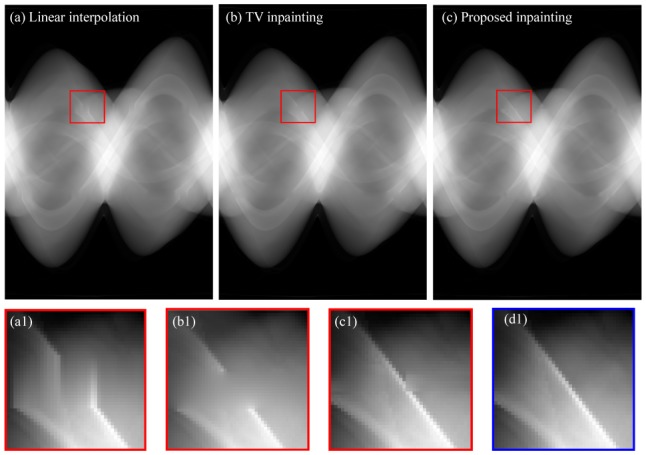
Inpainting results in the experiment of symmetric detector gaps. Sinogram restoration using (a), the linear interpolation; (b), the TV inpainting method in [7]; (c), the proposed method; (a1)–(c1): zoomed ROIs from (a)–(c); (d1) is the zoomed region from the original complete reference sinogram in Fig. 6 (a).
Fig. 11.
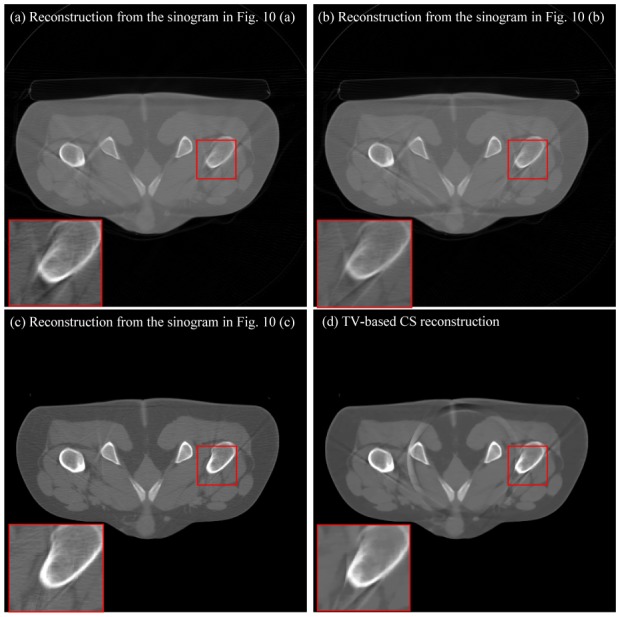
Reconstruction results in the experiment of symmetric detector gaps. (a)–(c), from the inpainted sinograms in Fig. 10 (a)–(c); (d), from the TV-based CS reconstruction. We can note that the proposed inpainting can lead to reconstruction (Fig. 11 (c)) with better artifact-suppression and structure-preservation than other inpainting methods and the iterative CS reconstruction.
Fig. 12 plots the profiles along the 100th row in the reconstructed image of Fig. 11. As previously observed with sparse sampling sinograms, the proposed approach behaves in the same way and provides a reconstruction result that is in better conformity with the reference image than are the results obtained with the other methods. MSE computed on the inpainted sinogram and the reconstructed images (and given in Table 5) also confirms these results.
Fig. 12.
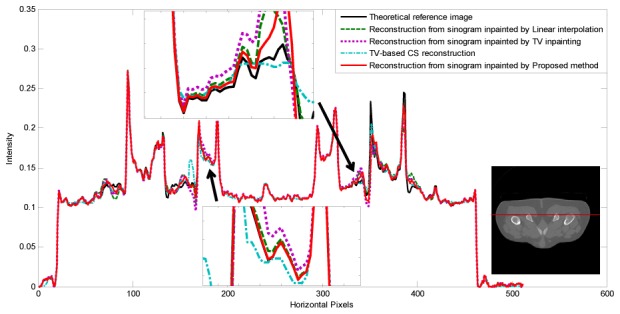
Illustration of the profiles along the 100th row in the reconstructed images in Fig. 11
Table 5.
| Linear interpolation | TV inpainting | Proposed method | TV-based CS reconstruction | |
|---|---|---|---|---|
| MSE of inpainted sinograms | 0.1718 | 0.1825 | 0.1127 | |
| MSE of reconstructed images | 1.2524 | 1.1874 | 1.1690 | 1.5079 |
4.3. Computation costs
The computation cost (in CPU seconds) for different methods are listed in Table 6. As to the methods of linear interpolation, TV inpainting, and the proposed method, the total computation time includes both the inpainting and FBP reconstructions. For TV-based CS reconstruction, the computation time relates just to the reconstruction process. We can see that more computation costs are required for the TV-based CS method and our proposed method. Moreover, when considering the sparse sampling and detector gap, this computational costs increased with the number of unmeasured data to be estimated. Table 6 also shows that CUDA parallelization led to nearly 40-fold acceleration.
Table 6.
CPU computation cost (in CPU seconds) for different methods.
| Linear interpolation +FBP | TV Inpainting +FBP | Proposed inpainting +FBP | Unparallelized proposed method +FBP | TV-based CS reconstruction | |
|---|---|---|---|---|---|
| Sparse sampling | 1.02 | 22.16 | 452.68 | 18021.42 | 14298.47 |
| Detector gaps | 0.98 | 13.96 | 750.71 | 28800.28 | 14298.47 |
5. Conclusion
In this paper, a new sinogram inpainting strategy is proposed to suppress the artifacts brought by sparse sampling and detector gaps in CT. This strategy includes S-curve based sinogram discretization, sinusoid fitting and eigenvector–guided interpolation. A CUDA-based parallelization is applied to accelerate the processing. Experiments on real fan-beam scanning data show that the proposed completion strategy can lead to improved CT imaging in the two cases of sparse view sampling and symmetric detector gaps.
However, from the above inpainting and reconstruction results from Fig. 7–Fig. 12, we can still observe some error estimation in the inpainted sinograms from the proposed approach. One reason for this might be that the interpolation must rely on the remaining known data along each decomposed S-curve to complete the S-curves with missing data. Therefore in the cases with too much missing data (very low sampling ratios or very large detector gaps), performance of the method would be lowered. Another limit is the computation time that still remains relative high even when using CUDA acceleration.
Further work will be devoted to the estimation of more accurate intensity information, the extension of the method to 3D cone-beam CT scan, and reducing the computation time.
Table 4.
Parameter setting in the experiments on detector gaps
| Method | Parameter settings |
|---|---|
| Linear interpolation [26] | 5 points in each symmetric side are used in interpolation |
| TV inpainting [7] | Inpainting times: 300; Positive shifting parameter: 1 × 10⁻⁶ |
| Proposed inpainting | Size of patch P: 21 × 21; Number of discretized S-curves: 10; 11 points with the current point being the center are used in the calculation of the least Euclidean distance |
| TV-based CS reconstruction [21] | Iteration number: 500; β = 0.3; ε = 1 × 10⁻⁵ |
Acknowledgments
This research was supported by National Basic Research Program of China under grant (2010CB732503), National Natural Science Foundation under grant (81000636), and the Project supported by Natural Science Foundation of Jiangsu Province (BK2009012).
References
- 1.KaK AC, Slaney M. Principles of Computerized Tomographic imaging. New York: IEEE Press; 1988. pp. 177–201. [Google Scholar]
- 2.Prince JL, Willsky AS. Constrained sinogram restoration for limited-angle tomography. J Opt Eng. 1990;29(3):535–544. [Google Scholar]
- 3.Joseph PM, Schulz RA. View sampling requirements in fan beam computed tomography. Med Phys. 1980;7(6):692–702. doi: 10.1118/1.594723. [DOI] [PubMed] [Google Scholar]
- 4.Ohnesorge B, Flohr T, Schwarz K, Heiken JP, Bae KT. Efficient correction for CT image artifacts caused by objects extending outside the scan field of view. Med Phys. 2000;27:39–46. doi: 10.1118/1.598855. [DOI] [PubMed] [Google Scholar]
- 5.Maltz JS, Bose S, Shukla HP, Bani-Hashemi AR. CT truncation artifact removal using water-equivalent thicknesses derived from truncated projection data. Proceedings of IEEE Conference on Engineering Medicine and Biology; IEEE; 2007. pp. 2907–2911. [DOI] [PubMed] [Google Scholar]
- 6.Xu J, Taguchi K, Tsui BMW. Statistical projection completion in X-ray CT using consistency conditions. IEEE Trans Medical Imaging. 2010;29(8):1528–40. doi: 10.1109/TMI.2010.2048335. [DOI] [PMC free article] [PubMed] [Google Scholar]
- 7.Chen T, Shen JH. Mathematical models for local non-texture inpaintings. SIAM Journal on Applied Mathematics. 2002;62(3):1010–1043. [Google Scholar]
- 8.Xue H, Zhang L, Xiao Y, Chen Z, Xing Y. Metal artifact reduction in dual energy CT by sinogram segmentation based on active contour model and TV inpainting. 2009; IEEE Nuclear Science Symposium Conference Record (NSS/MIC); 2009. pp. 904–908. [Google Scholar]
- 9.Gu J, Zhang L, Yu G, Xing Y, Chen Z. X-ray CT metal artifacts reduction through curvature based sinogram inpainting. J X-Ray Sci Tech. 2006;14(2):73–82. [Google Scholar]
- 10.Kostler H, Prummer M, Rude U, Hornegger J. Adaptive variational sinogram interpolation of sparsely sampled CT data. Proceedings of the 18th International Conference on Pattern Recognition; IEEE; 2006. pp. 778–78. [Google Scholar]
- 11.Bertram M, Wiegert J, Schafer D, Aach T, Rose G. Directional view interpolation for compensation of sparse angular sampling in cone-beam CT. IEEE Trans Medical Imaging. 2009;28(7):1011–1022. doi: 10.1109/TMI.2008.2011550. [DOI] [PubMed] [Google Scholar]
- 12.Constantino EPA, Ozanyan KB. Sinogram recovery for sparse angle tomography using sinusoidal Hough transform. Measurement Science and Technology. 2008;19(9):094015. [Google Scholar]
- 13.Zamyatin A, Satoru N. Extension of the reconstruction field of view and truncation correction using sinogram decomposition. Med Phys. 2007;34(5):1593–1605. doi: 10.1118/1.2721656. [DOI] [PubMed] [Google Scholar]
- 14.Chityala R, Hoffmann KR, Rudin S, Bednarek DR. Artifact reduction in truncated CT using sinogram completion. Proceedings of SPIE. 2005;5747:2110–2117. doi: 10.1117/12.595450. [DOI] [PMC free article] [PubMed] [Google Scholar]
- 15.Oehler M, Buzug TM. Statistical image reconstruction for inconsistent CT projection data. Methods of Information in Medicine. 2007;46(3):261–269. doi: 10.1160/ME9041. [DOI] [PubMed] [Google Scholar]
- 16.Zbijewski W, Defrise M, Viergever M, Beekman F. Statistical reconstruction for x-ray CT systems with non-continuous detectors. Physics in Medicine and Biology. 2007;52(10):403–418. doi: 10.1088/0031-9155/52/2/007. [DOI] [PubMed] [Google Scholar]
- 17.Lemmens C, Faul D, Nuyts J. Suppression of metal artifacts in CT using a reconstruction procedure that combines MAP and projection completion. IEEE Transactions on medical imaging. 2009;28(2):250–260. doi: 10.1109/TMI.2008.929103. [DOI] [PubMed] [Google Scholar]
- 18.Sidky EY, Pan X. Image reconstruction in circular cone-beam computed tomography by constrained total-variation minimization. Physics in Medicine and Biology. 2008;53(8):4777–4807. doi: 10.1088/0031-9155/53/17/021. [DOI] [PMC free article] [PubMed] [Google Scholar]
- 19.Duan X, Zhang L, Xing Y, Chen Z, Cheng J. Few-view projection reconstruction with an iterative reconstruction re-projection algorithm a TV constraint. IEEE Transactions on Nuclear Science. 2009;56(3):1377–1382. [Google Scholar]
- 20.Ritschl L, Bergner F, Kachelriess M. A new approach to limited angle tomography using the compressed sensing framework. Proceedings of SPIE. 2010;7622 [Google Scholar]
- 21.Tang J, Nett B, Chen G. Performance Comparison Between Total Variation (TV)-Based Compressed Sensing and Statistical Iterative Reconstruction Algorithms. Physics in Medicine and Biology. 2009;54:5781–5804. doi: 10.1088/0031-9155/54/19/008. [DOI] [PMC free article] [PubMed] [Google Scholar]
- 22.Kharlamov A, Podlozhnyuk V. Image Denoising Tech Rep. NVIDIA, Inc; 2007. [Google Scholar]
- 23.NVIDIA CUDATM. Programming Guide (Version 3.0) [Google Scholar]
- 24.Accelerating MATLAB with CUDA Using MEX Files (White Paper) http://developer.nvidia.com/object/matlabcuda.html.
- 25.GPU Acceleration in MATLAB. http://arch.eece.maine.edu/superme/images/8/8c/Finalreport.pdf.
- 26.Kothe U. Edge and junction detection with an improved structure tensor. LNCS. 2003;2781/2003:25–32. [Google Scholar]
- 27.Kincaid D, Cheney W. Numerical Analysis-Mathematics of Scientific Computing. 3. American Mathematical Society; [Google Scholar]


