Abstract
We describe a new method for calibrating optical trapping measurements in which tension is applied in the direction of the laser beam to a molecule tethered between a surface and an optically trapped bead. Specifically, we present a generally-applicable procedure for converting from the measured scattering intensity and the measured stage displacement to applied tension and bead-coverslip separation, using measurements of the light intensity scattered from an untethered, trapped bead. Our calibration accounts for a number of effects, including aberrations and the interference of forward-reflected bead-scattered light with the trapping beam. To demonstrate the accuracy of our method, we show measurements of the DNA force-versus-extension relation using a range of laser intensities, and show that these measurements match the expected extensible wormlike-chain (WLC) behavior. Finally, we also demonstrate a force-clamp, in which the tension in a tether is held fixed while the extension varies as a result of molecular events.
INTRODUCTION
Optical traps1, 2, 3, 4 are capable of applying piconewton forces and measuring nanometer extensions, which has led to wide-ranging applications in biological5, 6, 7, 8, 9, 10, 11, 12, 13, 14, 15, 16 and soft matter physics.17, 18, 19, 20, 21, 22, 23, 24 Optical traps have proven particularly effective in elucidating the effects of tension on the behavior of single molecules tethered between a surface and a trapped bead6, 7, 25 or between two trapped beads.11, 12, 15, 19, 26, 27 The dumbbell configuration, in which the molecule of interest is tethered between two trapped beads, has a simple readout and decouples the molecule's extension from microscope stage noise.12, 15, 27, 28 However, this configuration also has important limitations: dumbbells have to be individually constructed for each single molecule; they require an apparatus with beam steering optics; and the minimum, measurable extension is limited at small extensions by each bead interacting with the other trapping beam. Surface attachment schemes offer a number of practical advantages: first, a range of methods is available to tether large numbers of micron-sized beads to a glass coverslip,29, 30, 31, 32, 33, 34 increasing experimental throughput. Then, once beads are tethered, a relatively simple setup, comprised of a translation stage and a stationary optical trap are the only requirements for optical trapping measurements of the force and extension of single molecules. In fact, it has been shown too that surface attachment schemes can be implemented in very-low-noise setups.25, 35, 36, 37
In most surface tethered applications to-date, tension has been applied to surface-tethered molecules by moving the stage perpendicular to the direction of beam propagation. Such a geometry yields a simple conversion of the scattering light intensity to force38 for relatively long tethers. However, it complicates measurements for intermediate tether lengths,7 because the tether is necessarily at an acute angle to the surface, and it makes measurements on short tethers impossible. Instead of moving the stage perpendicular to the beam direction, it is possible to maintain a simple geometry for all extensions by moving the stage along the direction of the laser beam, thus applying tension to a surface-tethered molecule in the axial direction.39, 40, 41, 42, 43, 44 Applying an axial force to surface tethered beads combines the high-yield of surface tethering, a relatively simple apparatus, and the ability to measure short tethers and to probe extensions down to zero, which allows for straightforward drift correction. Another important advantage of short tethers is that they yield finer spatial resolution.43, 44 In addition, with an axial geometry, it is relatively straightforward to implement a reliable feedback loop, which maintains the force at a fixed value, namely a force clamp.
In spite of the advantages of axial pulling, a convenient, generally-applicable method of converting from the measured scattered-light intensity and the measured stage displacement to the applied tension and the bead-coverslip separation is not yet available in the literature. Such a calibration of axial forces and displacements must take into account a number of effects, including aberrations45, 46 and the interference between the trapping beam and forward-reflected bead-scattered light.40, 47, 48 References 41 and 42 have previously used optical traps to apply force in the axial direction. However, their calibration schemes either depend critically on the use of a specialized molecular construct,41 or the speed, accuracy, and simplicity of using the total scattering intensity is replaced by a methodology that relies on image analysis.42 In this paper, we present a simple, robust calibration that allows conversion from the experimental signals—stage displacement and scattering intensity—to calibrated values of the bead-coverslip separation and applied tension. To confirm the accuracy of our calibration, we show measurements of the DNA force-versus-extension relation using a range of laser intensities, and demonstrate that these measurements match the extensible wormlike-chain behavior expected. Finally, we realize a force-clamp, in which the tension in a tether is held fixed as the extension varies as a result of molecular events.
EXPERIMENTAL SETUP
In the optical trapping set-up used for these experiments, the 2.5 mm-diameter beam from a high-stability, 3 W, 1064 nm laser (Laser Quantum, Stockport, UK) was incident on an acousto-optic deflector (AOD) (IntraAction DTD-274HA6), allowing us to control the laser power.
The acousto-optic deflector acts as an optical isolator by Doppler shifting the diffracted beam.7, 25 Located between the AOD and the microscope objective (Nikon CFI × 100, oil immersion, NA 1.25) is a telescope arrangement that expands the beam diameter by a factor of three, ensuring that the back pupil of the microscope objective is overfilled, as required for strong trapping. Beyond the objective, the beam is directed onto a quadrant photo-diode (QPD) (Phresh Photonics SiQu50-M) located in a plane conjugate to the back focal plane of the microscope condenser lens, optimized for axial detection.49 In such a conjugate plane, the total intensity in all four QPD quadrants, I, is linearly proportional to the displacement of a trapped bead from the center of the trap along the beam direction, for sufficiently small displacements. At the same time, the difference in intensity between the two left and the two right quadrants and between the top and bottom quadrants is proportional to the displacement of the bead from the center of the trap in the corresponding directions transverse to the beam. This method of determining bead position—“back-focal-plane interferometry” (BFPI)38—also provides a sensitive measure of the force on the bead, because force is proportional to the bead displacement from the center of the trap.
Beads were trapped in a flow cell consisting of a No. 1.5 microscope cover slip and a microscope slide, separated by a layer of 330 μm-thick, double-sided tape (9490LE, 3 M) with a 5 mm × 45 mm rectangular cut-out, which forms a fluid channel. Holes are drilled in the glass microscope slide at opposite ends of the channel to allow for fluid delivery via nanoports (N-333, Upchurch Scientific). Fluid is introduced via 0.01 in. inner diameter tubing from LabView-controlled syringe pumps (Micro-Liter OEM Syringe Pump, Harvard Apparatus).
To carry out the measurements described below, we first prepared DNA-tethered beads as described in detail in Ref. 34. In brief, we synthesized a 4200 base pair strand of DNA that incorporates modified nucleotides at each end of the DNA, so that there was a reactive amine group at one end, and biotin at the other. We coated the flow cell with silane-polyethylene glycol N-hydroxysuccinamide (silane-PEG-NHS) under non-aqueous conditions. Following thorough rinsing, first with doubly de-ionized water and then with PBS (0.01 M phosphate buffer, 0.0027 M KCl, 0.137 M NaCl), we flowed in the modified DNA (100 pM DNA in PBS) and incubated for 1 h, permitting the single reactive amine group on the DNA to react with the surface-bound NHS moiety to form a covalent surface attachment. We then flowed out the DNA and flowed in a solution containing 1.09 μm-diameter streptavidin-coated beads at 1% w/v beads (SpheroTech,Lake Forest IL) in PBS (0.01 M phosphate buffer, 100 mM NaCl, 0.1% w/v Tween-20, 1 mg/mL casein), and incubated for a further period of between 1 h and overnight. The flow cell was then washed out with 1 mL of the same PBS buffer without beads. This method leads to a typical surface coverage of 20 surface-tethered beads in the microscope field of view, and very few beads in solution.
To carry out the measurements, described below, on a free (untethered) bead, we applied a force of 40–50 pN for a minute to detach a surface-tethered bead by disrupting the biotin-streptavidin bond. The DNAs end-biotin could, and would, reattach to the streptavidin coated bead, as has been seen elsewhere.33 To prevent such re-attachment, we moved the stage to a new location. In this way, we avoided having any beads in solution, which could interact with the trap during our calibration procedure. To manipulate the position of the trap relative to the tethered beads, we use a piezoelectric stage (Thorlabs, NanoMax 311) with a built-in strain gauge to measure the stage displacement.
AXIAL PULLING GEOMETRY
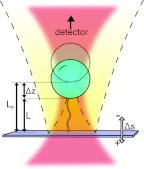
Figure 1 shows a schematic of our optical trapping geometry. A single molecule, in our case DNA, tethers a micrometer-sized bead to a glass coverslip. The bead is held by an optical trap at a bead-coverslip separation, L, directly over the tethering position. The optical trap applies a force on the bead proportional to displacement of the bead from the trap center, Δz. Knowing the trap stiffness, κ, we may immediately determine the force on the bead directed toward the center of the trap via F = κΔz. The displacement of the stage along the axial direction is Δs. At the starting position, where the bead is held just touching the stage, all coordinates are defined to be 0 (Δs = Δz = L = 0). If the stage is then moved away from the bead (Δs increases), the tether becomes extended, and the resultant tension pulls the bead away from the center of the optical trap. By contrast, if Δs is decreased, the stage hits the bead and starts to push it away from the trap center. In these circumstances, the bead position is simply Δs.
Figure 1.
A bead (blue circle) is tethered to a coverslip (purple rectangle) by a DNA molecule and is optically trapped by a focused laser beam (red). Light reflected off the bead (yellow with dashed outline) reflects off the coverslip and interferes with the trapping beam. In the absence of a tether, a free bead, dashed circle, is located a distance LF from the coverslip. For a tethered bead, when the stage is displaced a distance Δs, the bead is located Δz from the trap center. The method described in this text determines the molecule extension (L) and the trap displacement (Δz) from the known Δs and the scattering intensity, measured at a detector.
CALIBRATION
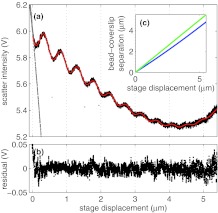
The first step in our calibration procedure is to measure the scattering intensity from a free (untethered) bead while varying the stage extension, Δs. An example of such a measurement is shown as the black dots in Fig. 2a. For stage extensions less than 0, the free bead is held against the coverslip by the trap, resulting in an approximately linear signal with a large negative slope. For positive stage extensions, Fig. 2 shows that the scattered intensity is overall decreasing with a damped, sinusoidal modulation for most of the measured stage displacement. However, for stage displacements greater than around 4 μm, we observe that the overall intensity profile increases. We can understand this behavior as follows. The scattering force (Fscatter) shifts the bead from the laser focus a distance d = −Fscatter/κ, where κ is the axial trapping strength. Because κ decreases with increasing bead-coverslip separation more strongly than Fscatter, the shift increases concomitantly. For stage displacements up to about 4 μm, this shift is small. Above 4 μm, however, the shift starts to increase more strongly with increasing bead-coverslip separation, leading to an increasing scattered intensity in this region.
Figure 2.
Scattered intensity for a stuck bead and a free bead. A fit (red line) using Eq. 1 describes the scatter intensity of a free bead using the values in Table 1. (a) Scattered intensity for a stuck bead (gray dots) and a free bead, (black dots) plotted versus stage extension. A fit using Eq. 1 (red line) describes the scattered intensity of a free bead using the values in Table 1. The bead-coverslip separation is determined from the sinusoidal fit to the observed fringes. (b) The residual of the fit to the intensity for a free bead shown in (A). No trend is observed, implying the fit sufficiently describes the data. (c) Length determined from fit in (A) using Eq. 3, shown in blue, and compared to L = Δs, shown in green.
These data manifest two important complications associated with axial pulling. The first is the result of interference. The trapping beam, shown red in Fig. 1, scatters from the trapped bead. A portion of the backscattered light reflects from the coverslip in the forward direction—shown yellow in Fig. 1—and interferes with the trapping beam. The bead-water and coverslip-water interfaces effectively form a low-finesse Fabry-Perot cavity. The finesse of this cavity decreases with increasing stage displacement because of the high divergence of the trapping beam. The sinusoidal modulation can be conceived as the fringes of this cavity. As a result, the measured intensity (measured in V), the trap axial stiffness, κ (measured in pN μm−1), and displacement sensitivity, β (measured in V nm−1), all show a sinusoidal dependence on L.40, 47, 48 A second complication is the result of aberrations, which cause an axial displacement of the trap center and axial defocusing as the coverslip is displaced. Defocusing decreases the trap axial stiffness, κ, affects the displacement sensitivity, β, and introduces the overall variation in the background signal, shown in Fig. 2a.
We refer to the measured signal of a bead in the trap center, shown in Fig. 2a, as the “background intensity,” IBG. We describe IBG by fitting to the following equation:40
| (1) |
with
| (2) |
and
| (3) |
where , , , , ABG, λBG, ϕBG, L1, and L2 are fitting parameters and LF is the bead-coverslip separation for a free bead. We find that the wavenumber of the sinusoidal variation is well-described by k = 4 × 1.33π/(1064) nm, and note that (1064/1.33) nm is the wavelength of the trapping light in water, as observed in Ref. 40. The best fit of Eq. 1 to the measured intensity for a free bead is shown as the red line in Fig. 2a, and clearly provides an excellent description of the measurement. All the fits in this paper, we performed using the lsqnonlin Matlab function with the Levenburg-Marquardt algorithm. The standard error of each fitting parameter was estimated using the Matlab function nlparci. The corresponding best-fit parameters are given in Table 1. The differences between the measured and fitted intensities, namely the residuals, are shown in Fig. 2b. The residuals do not show any systematic deviation from zero for extensions greater than zero, confirming that Eq. 1 accurately describes the background intensity, even though the detailed form of Eq. 1 is empirical. Interestingly, the free bead position, LF, does not vary exactly linearly with stage displacement, Δs. The bead's position is determined by a balance between the forward scattering force from the trapping beam and the axial trapping stiffness. Because the axial trapping stiffness decreases with increasing stage displacement, the beads equilibrium position becomes displaced further from the optical focus. For reasonable stage displacements, this additional displacement is well-described by adding a quadratic term to the extension, as shown in Eq. 3, and plotted for the fitted values in Table 1 in Fig. 2c.
Table 1.
Values used for fits described in text. Quoted errors use the standard error. To differentiate between stage displacement distances bead distances, stage displacement units are denoted μms. Figures in which these values were used are also shown.
| Quantity | Notation | Value | Error (σ) | Units | Figure |
|---|---|---|---|---|---|
| Modulation wavenumber | k | ——- | μm−1 | 26781013 | |
| Bead-coverslip separation | L1 | 0.7896 | 0.0004 | μmμ | 26781013 |
| L2 | 0.0156 | 0.0001 | μmμ | ||
| Scattering intensity | 5.9889 | 0.0003 | V | 281013 | |
| −0.2676 | 0.0007 | Vμ | |||
| 0.0342 | 0.0005 | Vμ | |||
| −0.0085 | 0.0001 | Vμ | |||
| Intensity amplitude | A | 0.0812 | 0.0002 | V | 281013 |
| Intensity decay length | λ−1 | 1.592 | 0.006 | μm | 281013 |
| Intensity phase shift | ϕBG | 1.989 | 0.004 | rad | 281013 |
| Displacement sensitivity | 5.09 | 0.05 | Vμm−1 | 681013 | |
| −0.06 | 0.02 | Vμm−1μ | |||
| 0.01 | 0.01 | Vμm−1μ | |||
| Sensitivity amplitude | Aβ | 1.17 | 0.07 | V | 681013 |
| Sensitivity decay length | 1.6 | 0.2 | μm | 681013 | |
| Sensitivity phase shift | ϕβ | 3.26 | 0.09 | rad | 681013 |
| Trap stiffness | 46.7 | 0.1 | pNμm−1 | 71013 | |
| 5.9 | 0.8 | pNμm−1μ | |||
| 0.4 | 0.2 | pNμm−1μ | |||
| Stiffness amplitude | Aκ | 9.6 | 0.2 | pNμm−1 | 71013 |
| Stiffness decay length | 0.9 | 0.2 | μm | 71013 | |
| Stiffness phase shift | ϕκ | 0.3 | 0.1 | rad | 71013 |
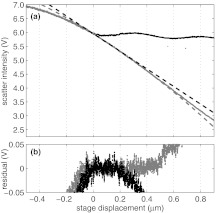
We also measured the intensity of a bead stuck to the coverslip as the stage displacement is varied. We emphasize that the bead-coverslip separation, LF, is the equilibrium distance from the edge of a bead to the coverslip-water interface for a free bead only. A stuck bead will simply move with the stage. The results of this measurement are shown as the gray dots in Fig. 3a, together with the intensity of a free-bead (black dots) and both linear and quadratic fits to the stuck-bead intensity. The residuals of these fits are shown in Fig. 3b. Evidently, the linear fit well-describes the intensity response for extensions up to about 200 nm, while the quadratic fit is effective for extensions up to about 500 nm.50 For simplicity, we use the linear form for our calibration.
Figure 3.
Scattered intensity for a stuck bead, compared to that of the free bead shown in Fig. 2. (a) Scattered intensity for a free bead (black dots) and a stuck bead (gray dots) plotted versus stage displacement. Linear and quadratic fits are shown for the stuck bead in black and gray dashed lines, respectively. (b) Differences between the measured intensity of the stuck bead and the linear fit (black dots) and between the measured intensity and the quadratic fits (gray dots).
The observation that there is not a sinusoidal intensity variation in the case of a stuck bead, for which L is constant, supports the form of Eq. 1, where the sinusoidal variation is ascribed solely to L. To determine the location at which the free bead first contacts the wall (L = 0), we use the intersection of the linear fit shown Fig. 3a and Eq. 1, shown in red in Fig. 2a.50 The slope of the stuck bead intensity signal with stage displacement is a measurement of the displacement sensitivity, β, and provides a useful check on the value of β determined as described below.
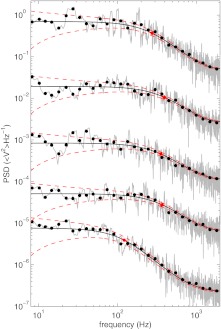
The second step in our calibration procedure is to use the power spectrum method, described in detail in Ref. 51, to determine the trap stiffness, κ, and displacement sensitivity, β, over the full range of stage displacements. The scattered intensity from a free bead was measured versus time for a total duration of 2.1 s at successive stage displacements, separated 25 nm, over the desired range of stage displacements. Data were acquired at 4 kHz for 2.1 s at each bead-coverslip separation. Data acquisition at 4 kHz permitted us to fit the measured power spectrum at each location for frequencies between 8 and 2000 Hz using a Lorentzian with the correction for aliasing described in Ref. 51. Lower frequencies in the power spectrum were not included in the fit in order to avoid the effects of drift.26, 51 Each power spectrum was calculated for each 2.1 s measurement, as shown in Fig. 4. To determine the errors by the repetition of measurement, each 2.1 s measurement was divided into 16 equal intervals, within each of which the power spectrum analysis was performed yielding 16 independent measurements of fc, the corner frequency, and Dv, the voltage diffusivity, thus permitting us to determine the standard errors of these parameters.
Figure 4.
Power spectral densities (PSDs) obtained for bead-coverslip separations (from bottom to top) of 0.14, 1.14, 2.01, 3.03, and 4.32 μm, respectively, are shown by gray lines and with exponentially blocked power spectrums shown as black dots. For clarity, successive data sets have been displaced one from another by a factor of 19. The Lorentzian fits, following Eq. 4 corrected for aliasing,51 are shown in black, with red, dashed lines showing the 1-σ confidence interval determined by the theoretical noise.51 The red marker denotes the position of the corner frequency for each spectrum (from bottom to top) 122, 369, 356, 398, and 276 Hz.
We fit each experimental power spectrum (measured in ⟨V2⟩Hz−1) to a Lorentzian function of frequency
| (4) |
where DV is diffusivity (diffusion constant) of the bead (measured in ⟨V2⟩Hz−1), f is the frequency, and fc is the corner frequency of the trap. Five representative power spectra, each obtained at a different bead-coverslip separation, are shown in Fig. 4. The figure includes the raw power spectra (gray lines), the corresponding exponentially blocked power spectra51 (black dots), and the best-fits to a Lorenztian model (Eq. 4) (solid black line) with a one standard error confidence interval (dashed red line). The Lorentzian is appropriately modified to account for aliasing as described in Ref. 51. Evidently, the Lorentzian model provides a good description of the experimental data over the full range of frequencies and bead-coverslip separations shown. This observation is consistent with the results of Refs. 46 and 48, which also found Lorentzian power spectra over a similar range of frequencies and bead-coverslip separations. In fact, small deviations from Lorentzian behavior at high frequencies (∼10 0000 kHz) have been explored experimentally and theoretically in Ref. 52. However, such deviations are negligible over the range of conditions relevant to the present study.
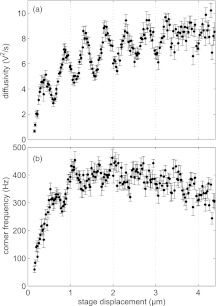
From the 16 measurements at each stage displacement, the mean and standard error of the diffusivity and corner frequency are determined at each stage displacement. These data are plotted versus stage displacement in Fig. 5. Evidently, the diffusivity increases several fold as the stage displacement is increased from 0 to 4.2 μm. In addition, it shows a clear sinusoidal modulation. Near the wall, the corner frequency is reduced because proximity to the surface increases the drag on the bead. The corner frequency initially increases with increasing stage displacement up until a stage displacement of about 1.5 μm, it remains approximately constant between 1.5 and 3 μm but then slowly decreases with further increase in stage displacement. This trend can also be seen in the data of Fig. 4 although, because of noise, the corner frequency for the data of 3.03 μm is slightly greater than at 2.01 μm. For the corner frequency, intensity oscillations are apparent at the smaller stage displacements. Because of spherical aberrations, we expect that the axial trapping stiffness decreases with increasing bead-coverslip separations. However, it is clear from Fig. 5 that the corner frequency actually initially increases with increasing bead-coverslip separation up until about 2 μm. This is because the fluid friction close to a surface decreases strongly with increasing bead-coverslip separation, which overwhelms the effect of a decreasing axial stiffness.46, 48, 53 Beyond 2 μm, the corner frequency starts to decrease with increasing bead-coverslip separation, because in this region the friction becomes a weaker function of bead-coverslip separation, while the axial trapping stiffness continues to decrease. The behavior of the fluid friction near a surface has been explored in detail in Refs. 4, 20, 46, 48, and 54, 55, 56, 57, 58, 59, and is sufficiently well understood that we rely on these results for our calibration.
Figure 5.
Results of power spectrum calibration with stage displacement (black dots) as described in text. (a) Voltage diffusivity (black dots) with errors allows for calibration of displacement sensitivity, β, with depth. (b) Corner frequency (black dots) versus stage displacement allows for the calibration of trap stiffness, κ, with stage depth.
The diffusivity and corner frequency are used to determine the displacement sensitivity, β, and the trap stiffness, κ, through the following relations:
| (5) |
and
| (6) |
Application of these equations requires knowledge of the axial drag coefficient, γ, which is given by
| (7) |
where R is the bead radius, h = L + R is the bead-center-to-wall distance, and γ0 = 6πRη is the friction coefficient of a sphere in an infinite liquid, where η is the viscosity of water.48 Determination of the stage displacement at which the bead first contacts the wall, as described above, is essential for the correct determination of the bead-center-to-wall distance. We determine κ and β for each stage displacement using the measured fc and DV using Eq. 7 with kBT = 4.1 pNnm. The resultant values of β and κ are shown versus stage displacement in Figs. 6a, 7a, respectively. We fit both β and κ with forms similar to Eq. 1:
| (8) |
with
| (9) |
and
| (10) |
with
| (11) |
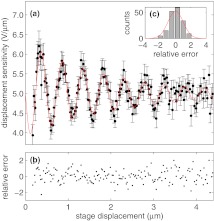
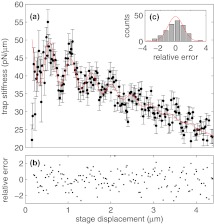
In these equations, , , , Aκ, λκ, ϕκ, , , , Aβ, λβ, and ϕβ are fitting parameters. In Eqs. 8, 10, LF is given by Eq. 3. Best fits of Eq. 8, 10 to our experimentally determined values of β and κ are shown in Figs. 6a, 7a, respectively. The corresponding best fit parameter values are given in Table 1. In both cases, the relative residuals, i.e., the residuals divided by the error, are randomly (Figs. 6b, 7b), and normally distributed (Figs. 6c, 7c), supporting our choice of functional form.
Figure 6.
Displacement sensitivity (β) versus stage displacement, and evaluation of Eq. 10 as fit using values from Table 1. (a) Determined β for a range of depths with errors, as described in text. Fit given by Eq. 10 shown in red. (b) Relative error between fit and determined κ shows no trend. (c) Histogram of relative errors shown in (B) are Gaussian distributed, implying a satisfactory fit.
Figure 7.
Trap stiffness (κ) versus stage displacement, and evaluation of Eq. 8 as fit using values from Table 1. (a) Experimental (solid points) and model (red line) trap stiffness (κ) versus stage position. (b) Relative error between fit and determined β shows no trend. (c) Histogram of the relative residuals, showing a Gaussian distribution.
Aberrations and interference between the bead and coverslip originate the non-constant values of IBG, κ, and β as a function of stage displacement. Increasing the trapping depth causes spherical aberrations,46, 60 which reduce both the trap stiffness, κ, and the background intensity, IBG, in addition to affecting displacement sensitivity β.48 Interference gives rise to a decaying, sinusoidal modulation of κ, β, and IBG. The amplitude of this modulation decreases with increasing stage displacement because the back-reflected light has fanned out further at larger stage displacements, as illustrated in Fig. 1. The location of a trapped free bead, L, is determined by a balance of the trapping potential or gradient force and a scattering force in the direction of beam propagation.1 Because the trap stiffness, κ, decreases at large extensions, the trapping force decreases concomitantly and the location of center of the trap at L increases more rapidly than linearly with stage displacement.40, 41 In fact, because the sinusoidal part of the background intensity depends solely on L, the sinusoidal intensity variation itself provides a convenient absolute calibration of the bead-coverslip separation, L, in terms of the stage displacement (Eq. 3).
GENERALIZED SCATTERING INTENSITY
To implement our calibration procedure, following the discussions in Refs. 38, 61, and 62, we introduce a linear response model to describe the generalized scattering intensity. Displacement of the bead results in a linear change in scattered intensity. This model is suggested by the linear response of a stuck bead for 200 nm in Fig. 3. Specifically, the scattered intensity, I, is the sum of the background intensity IBG and a linear response to bead displacement, Δz, of magnitude ζ. Expanding out the form of IBG, we determine the generalized scattering intensity
| (12) |
where L is the separation of the bead edge from the coverslip-water interface, as shown in Fig. 1. If the bead is not displaced (Δz = 0), the displacement will be the same as the displacement of a free bead (L = LF). For non-zero displacement, the extension is given by
| (13) |
and we have introduced the linear response, ζ, which specifies the intensity response when the displacement of the bead from the center of the trap, Δz, increases, but the bead-wall distance is kept constant, as is the case for stuck bead measurements. Equation 12 reduces to the scattering intensity of a free bead for L = LF and Δz = 0. Equation 12 may be re-written with Eq. 13
| (14) |
By contrast, the displacement sensitivity, β, measured by the power spectrum method and shown in Fig. 6a, specifies the intensity response to changes in bead position at constant stage displacement. Our formula for the scattered intensity, Eq. 14, must be consistent with the measurement of β. We therefore set β equal to dI/dL, which establishes the connection between β and ζ as follows:
| (15) |
Thus, we find that
| (16) |
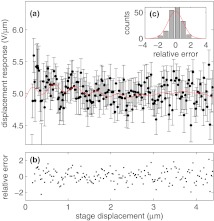
We now have a function determining the displacement response, ζ, with respect to bead-coverslip separation, L. We plot in Fig. 8 the experimental values for ζ by taking our experimental values for β and subtracting the second term in Eq. 16. Effectively, we correct β for the part that is due to the background scattering intensity. In contrast to the models shown in Figs. 67, the model shown in Fig. 8 is not a fit to the data of Fig. 8. Rather, the model form shown in Fig. 8 is calculated based on the best-fit parameters, values (namely ABG, λ, L, k, and ϕBG) determined from the fits to the data shown in Figs. 26, using Eq. 16 with β determined by Eq. 1 (red line). For comparison, experimental values are shown, also using Eq. 16, but with the measured values of β in place of Eq. 1 (black dots). Evidently, the model and data are consistent, suggesting that our parameterization of the data is appropriate.
Figure 8.
Displacement response (ζ) versus stage displacement described in text, and evaluation of Eq. 16 with values ABG, λ, L, k, and ϕBG determined from fitting Figs. 26, given in Table 1, using Eq. 16 with β determined by Eq. 10. (a) Determined ζ for a range of depths with errors, as described in text. Fit given by Eq. 10 shown in red. The black dots use the experimental values of β. (b) Relative error between fit and determined ζ shows no trend. (c) Histogram of relative errors shown in (b) are Gaussian distributed, implying a satisfactory fit.
CONVERSION
Our procedure has now established IBG(L) and ζ(L) as functions of the bead-coverslip separation, L, and the stage displacement, Δs. To determine L and Δz (Fig. 1) from the measured scattering intensity, I, and stage displacement, Δs, we must solve
| (17) |
and
| (18) |
for L and Δz. To achieve the required solution, we employ an iterative procedure, in which the values of L and Δz at step n, namely Ln and Δzn, are related to the values at step n − 1 via
| (19) |
and
| (20) |
Starting with Δz0 = 0, iteration of these equations many times determines Δz, and L to high accuracy. The tension in the tether can then immediately be determined using F = κΔz. In order for these equations to possess a single solution, this pro-cedure requires a one-to-one correspondence between (I, Δs) and (Δz, L). In fact, there is only one solution for realistic variations, provided ζ is always positive, which is the case.
DNA FORCE-VERSUS-EXTENSION
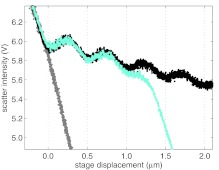
To test and verify our calibration method, we measured the scattering intensity, I, versus stage displacement, Δs, for a bead tethered by a 4200 bp segment of DNA. These data are shown in Fig. 9 in cyan, with the scattering intensity for a stuck bead (gray) and a free bead (black) shown for comparison. The stuck bead shows a linear response as described previously. For stage displacements less than 0 μm, the scattering intensity of both the free bead and the DNA-tethered bead is coincident with the scattering intensity of the stuck bead. For stage displacements greater than 0 μm, at first the scattering intensity of the DNA closely follows that of the free bead. However, for stage displacements greater than 1 μm, the scattering intensity for the DNA tethered bead increasingly deviates from that of the free bead until the intensity varies approximately linearly with stage displacement with a slope that is approximately the same as for the stuck bead. At large extensions, the DNA acts essentially like an inextensible rod linking the coverslip and the bead. Therefore, the scattered intensity from a DNA-tethered bead tracks that of a stuck bead, albeit displaced by the contour length of the DNA.
Figure 9.
Scattering intensity versus stage displacement for pulling a DNA tethered bead (cyan) compared to the scatting intensity of a stuck bead (gray) and a free bead (black).
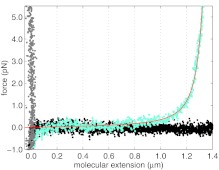
Applying the conversion algorithm described previously, using the parameter values tabulated in Table 1, we converted the measurements of the scattering intensity as a function of stage displacement, shown in Fig. 9, to the force-versus-extension curve, shown in Fig. 10, where the molecular extension of the DNA is the bead-coverslip separation, L. Also plotted in Fig. 10, as the red line, is the expected dsDNA force-versus-extension, corresponding to an extensible wormlike-chain7
| (21) |
To fit our force-versus-extension curves, we use parameter values from Ref. 7, which used a similar buffer to our measurement, namely lp = 42 nm, K = 1000 pN, and kBT = 4.1 pNnm. The contour length was fitted to 1380 ± 5 nm. The good agreement between this model and our measurements further validates our calibration method.
Figure 10.
Converted data using our methods for the three traces shown in Fig. 9 with the DNA shown in cyan, free bead in black, and the stuck bead in gray. A worm-like chain fit for force-versus extension of DNA, Eq. 21 is shown in red.
DNA FORCE-VERSUS-EXTENSION AT SEVERAL LASER POWERS
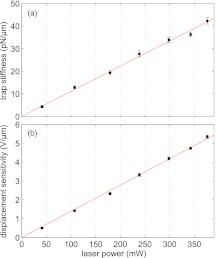
The trapping stiffness, κ, displacement sensitivity, β, displacement response, ζ, background intensity, IBG, and scattering intensity, I all may be expected to be linearly proportional to the trapping laser power.63, 64 As shown in Fig. 11, we have verified that this is indeed the case for κ and β in our setup by measuring power spectra of a free bead at a fixed stage displacement of 2 μm for several laser intensities.
Figure 11.
Power spectrum calibrations for a range of trap powers. (a) The corner frequency (Fc), of the trap for a range of laser intensities. Conversion to trap stiffness, κ, is shown (right axis). A linear fit (solid line) agrees with measured data. (b) The square root of diffusivity and displacement sensitivity for a range of laser intensities.
Therefore, given calibration parameters obtained at one laser power, it should be possible to calculate calibration parameters applicable to another laser power simply by scaling IBG, ζ, and κ linearly with laser power. We may therefore further test our calibration method by collecting DNA forces-versus-extension data at several different laser powers. Then calibrating each data set with the appropriately-scaled parameters should lead to the identical force-versus-extension curve in every case.
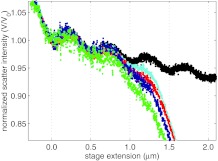
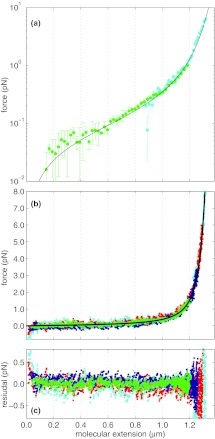
The scattering intensity, normalized by the scattering intensity at zero extension, is shown in Fig. 12 for laser powers of 353 mW (cyan), 217 mW (red), 122 mW (dark blue), and 59.6 mW (green), with powers measured before the entrance to the objective. A free bead (black, taken at 353 mW) is shown for comparison. The cyan trace is the same as that shown in Fig. 9. For stage displacements less than 0 μm, the scattering intensities are all equivalent to that of a stuck bead, as expected. For stage displacements greater than 0 μm, as the power of the laser is decreased, the measured normalized intensities increasingly deviate from that of a stuck bead. This is because the trapping strength decreases with decreasing laser power, requiring the bead to be displaced further from the trap center to achieve the same force. For extensions between 0 and 600 nm, DNA has a linear force-extension relation, thus as the trap strength is decreased, the average slope of the normalized intensity increases.
Figure 12.
Normalized scattering intensity vs stage displacement measured for a DNA tethered bead for laser powers of 353 mW (cyan), 217 mW (red), 122 mW (dark blue), and 59.6 mW (green).
We convert the measurements shown in Fig. 12 using the fit parameters given in Table 1, appropriately scaled by the laser power. The results of the conversion to force and extension, for the data of Fig. 12, are shown using the same color scheme in Figs. 13a, 13b. Satisfyingly, the resultant force-versus-extension curves collapse to a single curve, that is, moreover, well described by the extensible worm-like chain model, shown as the solid black line in the figure. The residuals of this converted data and the prediction of the extensible worm-like chain is shown in Fig. 13c. Differences between the data and model at low extension may be the result of bead-coverslip interactions.48 The increasing residual at extensions greater than 1.2 μm is a consequence of the large slope of the force-versus-extension curve for extensions approaching the DNA contour length. To show the accuracy of our method at low force, we display our measurements on a logarithmic scale in Fig. 13a, revealing excellent agreement with the model, and with previous measurements.7, 65
Figure 13.
Converted DNA force-versus-extensions measurements. (a) Force-versus-extension of dsDNA shown with a logarithmic force axis combined every 20 nm from twenty 20 s measurements at 59.6 mW data (green) and one 20 s measurement at high force (cyan) combined every 10 nm. An extensible wormlike chain fit, Eq. 21, is shown in black and has good agreement with data. (b) Force-versus-extension of dsDNA, obtained by converting the measured intensities shown in Fig. 12 to force and extension with the algorithm described. The converted force versus extensions for laser intensities of 353 mW (cyan), 217 mW (red), 122 mW (dark blue), and 59.6 mW (green) with a linear force scale. An extensible wormlike chain fit, Eq. 21, is shown in black and has good agreement with data. (c) The residuals between the converted force and extension values shown in (a) and the prediction of the extensible WLC model.
FORCE-CLAMP PROCEDURE
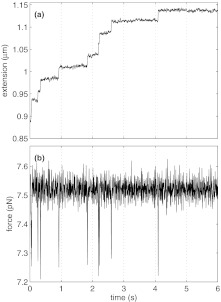
To demonstrate a force clamp with our procedure, we measured the unwinding of nucleosomes at fixed force of 9.2 pN.10, 13, 66 To achieve the force clamp, we implemented a proportional-integral-derivative (PID) feedback controller using LabVIEWTM, in which the force is held constant by adjusting the position of the piezo electric stage. We have found that carrying out our conversion algorithm to determine the axial force and extension, followed by the actuation of PID control on the stage to maintain a constant force can be done at a cycle rate of >1000 Hz, using Labview's MathScript functions. In this way, we are able to study the extension as a function of time at fixed applied force. An example of such a measurement is shown in Fig. 14a, which illustrates a typical extension-versus-time trace for a nucleosomal array held at a fixed force of 9.2 pN. Each step in Fig. 14a corresponds an individual nucleosome unwinding event where the tether length increases by about 25 nm. At each such event, the force transiently decreases before returning to its force clamp value. The behavior of the force is shown in Fig. 14b. The force recovers within about 20 ms. This response time is limited by the resonance frequency of the microscope stage, not by the computation time of our conversion algorithm. Consequently, we can accurately measure rates up to about 30 s−1.
Figure 14.
Example force clamp measurement of a nucleosome array. (a) Extension vs. time of nucleosome array at a constant force of 9.2 pN, measured using the method described in the text. (b) The force as a function of time showing the variation following each unwinding event.
CONCLUSION
We have presented a calibration and conversion algorithm to transform from the experimentally measured values of stage displacement and scattering intensity to the physically-relevant values of applied force and bead-coverslip separation. Moreover, we have demonstrated the effectiveness of our procedure using measurements of the well-studied force-versus-extension curve of double-stranded DNA. Our calibration procedure itself only requires measurements on a free bead. Therefore, our method is simple and broadly accessible. Our verification of the procedure only requires measurements on a bead tethered by dsDNA, and, for a more stringent test, a means of controlling the laser power. Finally, we demonstrated that the calculations required for the conversion of intensity and stage displacement can be accomplished using Labview sufficiently quickly that the conversion algorithm does not limit the performance of a force clamp implemented via the piezo stage.
ACKNOWLEDGMENTS
We thank E. Dufresne, C. Mejean, R. Ilagan, P. Koo, and Y. Zhao for enlightening discussions. We thank the Raymond and Beverly Sackler Institute for Biological, Physical, and Engineering Sciences and the Yale Institute for Nanoscience and Quantum Engineering for support. D.J.S. was supported by an NSF Graduate Fellowship. A.H.M. was partially supported by the NSF DMR-0906697.
References
- Ashkin A., Dziedzic J., Bjorkholm J., and Chu S., Opt. Lett. 11, 288 (1986). 10.1364/OL.11.000288 [DOI] [PubMed] [Google Scholar]
- Ashkin A., Dziedzic J., and Yamane T., Nature (London) 330, 769 (1987). 10.1038/330769a0 [DOI] [PubMed] [Google Scholar]
- Visscher K., Gross S., and Block S., IEEE J. Sel. Top. Quantum Electron. 2, 1066 (1996). 10.1109/2944.577338 [DOI] [Google Scholar]
- Neuman K. and Block S., Rev. Sci. Instrum. 75, 2787 (2004). 10.1063/1.1785844 [DOI] [PMC free article] [PubMed] [Google Scholar]
- Block S., Blair D., and Berg H., Nature (London) 338, 514 (1989). 10.1038/338514a0 [DOI] [PubMed] [Google Scholar]
- Svoboda K., Schmidt C., Schnapp B., and Block S. et al. , Nature (London) 365, 721 (1993). 10.1038/365721a0 [DOI] [PubMed] [Google Scholar]
- Wang M., Yin H., Landick R., Gelles J., and Block S., Biophys. J. 72, 1335 (1997). 10.1016/S0006-3495(97)78780-0 [DOI] [PMC free article] [PubMed] [Google Scholar]
- Kellermayer M., Smith S., Granzier H., and Bustamante C., Science 276, 1112 (1997). 10.1126/science.276.5315.1112 [DOI] [PubMed] [Google Scholar]
- Smith D., Tans S., Smith S., Grimes S., Anderson D., and Bustamante C., Nature (London) 413, 748 (2001). 10.1038/35099581 [DOI] [PubMed] [Google Scholar]
- Mihardja S., Spakowitz A. J., Zhang Y., and Bustamante C., Proc. Natl. Acad. Sci. U.S.A. 103, 15871 (2006). 10.1073/pnas.0607526103 [DOI] [PMC free article] [PubMed] [Google Scholar]
- Dame R., Noom M., and Wuite G., Nature (London) 444, 387 (2006). 10.1038/nature05283 [DOI] [PubMed] [Google Scholar]
- Noom M., Van Den Broek B., Van Mameren J., and Wuite G., Nat. Methods 4, 1031 (2007). 10.1038/nmeth1126 [DOI] [PubMed] [Google Scholar]
- Kruithof M. and van Noort J., Biophys. J. 96, 3708 (2009). 10.1016/j.bpj.2009.01.048 [DOI] [PMC free article] [PubMed] [Google Scholar]
- Mejean C., Schaefer A., Millman E., Forscher P., and Dufresne E., Opt. Express 17, 6209 (2009). 10.1364/OE.17.006209 [DOI] [PMC free article] [PubMed] [Google Scholar]
- Gebhardt J., Bornschlögl T., and Rief M., Proc. Natl. Acad. Sci. U.S.A. 107, 2013 (2010). 10.1073/pnas.0909854107 [DOI] [PMC free article] [PubMed] [Google Scholar]
- Gao Y., Sirinakis G., and Zhang Y., J. Am. Chem. Soc. 133, 12749 (2011). 10.1021/ja204005r [DOI] [PMC free article] [PubMed] [Google Scholar]
- Grier D., Curr. Opin. Colloid Interface Sci. 2, 264 (1997). 10.1016/S1359-0294(97)80034-9 [DOI] [Google Scholar]
- Dufresne E. and Grier D., Rev. Sci. Instrum. 69, 1974 (1998). 10.1063/1.1148883 [DOI] [Google Scholar]
- Meiners J. and Quake S., Phys. Rev. Lett. 82, 2211 (1999). 10.1103/PhysRevLett.82.2211 [DOI] [Google Scholar]
- Dufresne E., Squires T., Brenner M., and Grier D., Phys. Rev. Lett. 85, 3317 (2000). 10.1103/PhysRevLett.85.3317 [DOI] [PubMed] [Google Scholar]
- Löwen H., J. Phys.: Condens. Matter 13, R415 (2001). 10.1088/0953-8984/13/24/201 [DOI] [Google Scholar]
- Grier D., Nature (London) 424, 810 (2003). 10.1038/nature01935 [DOI] [PubMed] [Google Scholar]
- Collin D., Ritort F., Jarzynski C., Smith S. B., Tinoco J. I., and Bustamante C., Nature (London) 437, 231 (2005). 10.1038/nature04061 [DOI] [PMC free article] [PubMed] [Google Scholar]
- Merrill J., Sainis S., Bławzdziewicz J., and Dufresne E., Soft Matter 6, 2187 (2010). 10.1039/b926845f [DOI] [Google Scholar]
- Carter A., Seol Y., and Perkins T., Biophys. J. 96, 2926 (2009). 10.1016/j.bpj.2008.12.3933 [DOI] [PMC free article] [PubMed] [Google Scholar]
- Abbondanzieri E., Greenleaf W., Shaevitz J., Landick R., and Block S., Nature (London) 438, 460 (2005). 10.1038/nature04268 [DOI] [PMC free article] [PubMed] [Google Scholar]
- Moffitt J., Chemla Y., Izhaky D., and Bustamante C., Proc. Natl. Acad. Sci. U.S.A. 103, 9006 (2006). 10.1073/pnas.0603342103 [DOI] [PMC free article] [PubMed] [Google Scholar]
- Comstock M., Ha T., and Chemla Y., Nat. Methods 8, 335 (2011). 10.1038/nmeth.1574 [DOI] [PMC free article] [PubMed] [Google Scholar]
- Greene E. and Mizuuchi K., Mol. Cell 9, 1079 (2002). 10.1016/S1097-2765(02)00514-2 [DOI] [PubMed] [Google Scholar]
- Appleyard D., Vandermeulen K., Lee H., and Lang M., Am. J. Phys. 75, 5 (2007). 10.1119/1.2366734 [DOI] [Google Scholar]
- Luo G., Wang M., Konigsberg W., and Xie X., Proc. Natl. Acad. Sci. U.S.A. 104, 12610 (2007). 10.1073/pnas.0700920104 [DOI] [PMC free article] [PubMed] [Google Scholar]
- Brewer L. and Bianco P., Nat. Methods 5, 517 (2008). 10.1038/nmeth.1217 [DOI] [PMC free article] [PubMed] [Google Scholar]
- Paik D., Seol Y., Halsey W., and Perkins T., Nano Lett. 9, 2978 (2009). 10.1021/nl901404s [DOI] [PubMed] [Google Scholar]
- Schlingman D. J., Mack A. H., Mochrie S. G. J., and Regan L., Colloids Surf., B 83, 91 (2011). 10.1016/j.colsurfb.2010.11.002 [DOI] [PMC free article] [PubMed] [Google Scholar]
- Nugent-Glandorf L. and Perkins T., Opt. Lett. 29, 2611 (2004). 10.1364/OL.29.002611 [DOI] [PubMed] [Google Scholar]
- Carter A., King G., Ulrich T., Halsey W., Alchenberger D., and Perkins T., Appl. Opt. 46, 421 (2007). 10.1364/AO.46.000421 [DOI] [PubMed] [Google Scholar]
- Mahamdeh M. and Schäffer E., Opt. Express 17, 17190 (2009). 10.1364/OE.17.017190 [DOI] [PubMed] [Google Scholar]
- Gittes F. and Schmidt C. F., Opt. Lett. 23, 7 (1998). 10.1364/OL.23.000007 [DOI] [PubMed] [Google Scholar]
- Clapp A., Ruta A., and Dickinson R., Rev. Sci. Instrum. 70, 2627 (1999). 10.1063/1.1149820 [DOI] [Google Scholar]
- Neuman K., Abbondanzieri E., and Block S., Opt. Lett. 30, 1318 (2005). 10.1364/OL.30.001318 [DOI] [PMC free article] [PubMed] [Google Scholar]
- Deufel C. and Wang M. D., Biophys. J. 90, 657 (2006). 10.1529/biophysj.105.065458 [DOI] [PMC free article] [PubMed] [Google Scholar]
- Chen Y.-F., Blab G. A., and Meiners J.-C., Biophys. J. 96, 4701 (2009). 10.1016/j.bpj.2009.03.009 [DOI] [PMC free article] [PubMed] [Google Scholar]
- Forns N., de Lorenzo S., Manosas M., Hayashi K., Huguet J., and Ritort F., Biophys. J. 100, 1765 (2011). 10.1016/j.bpj.2011.01.071 [DOI] [PMC free article] [PubMed] [Google Scholar]
- de Messieres M., Brawn-Cinani B., and Porta A. L., Biophys. J. 100, 27362744 (2011). 10.1016/j.bpj.2011.03.067 [DOI] [PMC free article] [PubMed] [Google Scholar]
- Rohrbach A. and Stelzer E., Appl. Opt. 41, 2494 (2002). 10.1364/AO.41.002494 [DOI] [PubMed] [Google Scholar]
- Vermeulen K., Wuite G., Stienen G., and Schmidt C., Appl. Opt. 45, 1812 (2006). 10.1364/AO.45.001812 [DOI] [PubMed] [Google Scholar]
- Jákl P., Šerý M., Ježek J., Liška M., and Zemánek P., J. Opt. A, Pure Appl. Opt. 9, S251 (2007). 10.1088/1464-4258/9/8/S19 [DOI] [Google Scholar]
- Schäffer E., Nørrelykke S., and Howard J., Langmuir 23, 3654 (2007). 10.1021/la0622368 [DOI] [PubMed] [Google Scholar]
- Dreyer J., Berg-Sørensen K., and Oddershede L., Appl. Opt. 43, 1991 (2004). 10.1364/AO.43.001991 [DOI] [PubMed] [Google Scholar]
- Lang M., Asbury C., Shaevitz J., and Block S., Biophys. J. 83, 491 (2002). 10.1016/S0006-3495(02)75185-0 [DOI] [PMC free article] [PubMed] [Google Scholar]
- Berg-Sørensen K. and Flyvbjerg H., Rev. Sci. Instrum. 75, 594 (2004). 10.1063/1.1645654 [DOI] [Google Scholar]
- Atakhorrami M., Mizuno D., Koenderink G., Liverpool T., MacKintosh F., and Schmidt C., Phys. Rev. E 77, 061508 (2008). 10.1103/PhysRevE.77.061508 [DOI] [PubMed] [Google Scholar]
- Svoboda K. and Block S. M., Ann. Rev. Biophys. Biomol. Struct. 23, 247 (1994). 10.1146/annurev.bb.23.060194.001335 [DOI] [PubMed] [Google Scholar]
- Tolić-Nørrelykke S., Schäffer E., Howard J., Pavone F., Jülicher F., and Flyvbjerg H., Rev. Sci. Instrum. 77, 103101 (2006). 10.1063/1.2356852 [DOI] [Google Scholar]
- van Ommering K., Lamers C., Nieuwenhuis J., van IJzendoorn L., and Prins M., J. Appl. Phys. 105, 104905 (2009). 10.1063/1.3118500 [DOI] [Google Scholar]
- Hansen P., Dreyer J., Ferkinghoff-Borg J., and Oddershede L., J. Colloid Interface Sci. 287, 561 (2005). 10.1016/j.jcis.2005.01.098 [DOI] [PubMed] [Google Scholar]
- Wright W., Sonek G., and Berns M., Appl. Opt. 33, 1735 (1994). 10.1364/AO.33.001735 [DOI] [PubMed] [Google Scholar]
- Dufresne E., Altman D., and Grier D., Europhys. Lett. 53, 264 (2001). 10.1209/epl/i2001-00147-6 [DOI] [Google Scholar]
- Leach J., Mushfique H., Keen S., Di Leonardo R., Ruocco G., Cooper J., and Padgett M., Phys. Rev. E 79, 026301 (2009). 10.1103/PhysRevE.79.026301 [DOI] [PubMed] [Google Scholar]
- Roichman Y., Waldron A., Gardel E., and Grier D., Appl. Opt. 45, 3425 (2006). 10.1364/AO.45.003425 [DOI] [PubMed] [Google Scholar]
- Ghislain L. P., Switz N. A., and Webb W. W., Rev. Sci. Instrum. 65, 27622768 (1994). 10.1063/1.1144613 [DOI] [Google Scholar]
- Pralle A., Prummer M., Florin E.-L., Stelzer E. H. K., and Horber J. K. H., Microsc. Res. Tech. 44, 378386 (1999). [DOI] [PubMed] [Google Scholar]
- Singer W., Bernet S., Hecker N., and Ritsch-Marte M., J. Mod. Opt. 47, 2921 (2000). 10.1080/095003400750039799 [DOI] [Google Scholar]
- Rohrbach A., Phys. Rev. Lett. 95, 168102 (2005). 10.1103/PhysRevLett.95.168102 [DOI] [PubMed] [Google Scholar]
- Marko J. and Siggia E., Macromolecules 28, 8759 (1995). 10.1021/ma00130a008 [DOI] [Google Scholar]
- Brower-Tolland B., Smith C. L., Yeh R. C., Lis J. T., Peterson C. L., and Wang M. D., Proc. Natl. Acad. Sci. U.S.A. 99, 1960 (2002). 10.1073/pnas.022638399 [DOI] [PMC free article] [PubMed] [Google Scholar]


