

Abstract
The Eph receptors and their ligands, the ephrins, play an important role during neural development. In particular, ephrin-A5 is highly expressed in the developing nervous system in several brain regions including the olfactory bulb, frontal cortex, striatum and hypothalamus. Although a number of studies have characterized the expression of ephrin-A5 in these regions, very little is known about the functional consequences that might follow alterations in the expression of this ligand. Previously, we demonstrated that ephrin-A5 acts as a guidance molecule regulating the trajectory of the ascending midbrain dopaminergic pathways. In light of this finding and the critical role of dopamine in modulating a number of behaviors, we sought to determine whether loss of ephrin-A5 altered neurobehavioral development. Our results indicate that ephrin-A5-null mice exhibit delays in reaching developmental milestones and in the maturation of motor skills. In addition, they exhibit increased locomotor activity and reduced levels of brain monoamines. Therefore, we conclude that ephrin-A5 expression appears to be critical for proper development of central monoaminergic pathways and that its loss results in a number of neurodevelopmental abnormalities. Because alterations in monoamine function are associated with a variety of neurodevelopmental disorders, these data suggest that further study on the potential role of ephrin-A5 in such disorders is warranted.
Keywords: Eph receptor, hanging wire grip strength, mid-air righting, motor activity, negative geotaxis
1. Introduction
Proper development of the central nervous system is dependent on cell to cell communication mediated by cell surface molecules including receptor tyrosine kinases (RTKs) and their ligands [1]. Members of the largest RTK family, the Eph receptors and their ephrin ligands, have been shown to play critical roles in neural development [reviewed in 2, 3, 4]. In mammals, the Eph family has 14 receptors and nine ligands which can be subdivided into two classes based on structural homology and binding affinities. The A class consists of nine receptors (EphA1–A8, A10) and five glycerophosphatidyl-inositol (GPI) linked ligands (ephrin-A1–A5), whereas the B class includes six receptors (EphB1–B4, B6) and three trans-membrane ligands (ephrin-B1–B3) [2]. In contrast to other RTKs, interactions between the Eph receptors and ephrins generate signals that propagate bi-directionally into both receptor and ligandexpressing cells. These processes are known as forward and reverse signaling [5–7]. The Eph/ephrin family is involved in a wide variety of physiological processes including cell migration, axon topographic termination, and neural plasticity [8, 9] and has been shown to regulate the development of several axon pathways including the retinotectal [10, 11], the hippocamposeptal [12, 13] and the thalamacortical projections [14].
Ephrin-A5, a GPI-linked ligand for the EphA family is of particular interest with respect to neural development. It is highly expressed in the developing nervous system from early organogenesis to postnatal life [15, 16]. During embryogenesis, ephrin-A5 transcripts are highly expressed in sensory and motor regions of the cortex [17], in the pituitary, the hypothalamus, [18] the olfactory system [19] and in both the dorsolateral and ventromedial striatum [20, 21]. Its expression in the striatum was found to regulate the formation of the ascending midbrain dopaminergic pathways [20, 21] which are important for the integration of sensorimotor, reward, and social interactions [22].
Because of its high expression during early development and its role in axon guidance, we hypothesized that loss of ephrin-A5 may result in impaired behavioral development. To test this hypothesis, we compared developmental milestones and behaviors as well as brain neurochemistry in wild-type and ephrin-A5-null mice. Specifically, we used a battery of behavioral tests to monitor motor development throughout the early postnatal life of mice of both genotypes. In addition, brain neurochemistry was examined at postnatal days (PND) 15 and 30. We found that loss of ephrin-A5 in the mouse caused delays in motor development and increased locomotor activity. These behavioral deficits were associated with decreased monoamine levels in several brain regions that have been associated with motor functions. Taken together, these data demonstrate that ephrin-A5 expression is important for proper neurobehavioral development and the development of central monoaminergic pathways.
2. Materials and Methods
2.1. Animals
Ephrin-A5 animals were originally generated on a mixed background (C57BL/6 and 129/SV) as described earlier [23]. This line was maintained in our colony in the same background. Animals used in this study were generated using the following breeding scheme: heterozygous ephrin-A5 mice were bred with each other to generate wild-type, heterozygous, and homozygous knockout animals. Due to the large number of animals needed for the assays, additional animals were generated using wild-type x wild-type and homozygous knockout x knockout mating using siblings from the initial heterozygous x heterozygous mating. Male and female wild-type (n=22 and 14 respectively from 6 litters) and ephrin-A5-null mice (n=16 and 16 respectively from 6 litters) were separately housed in plastic cages with standard beta chip bedding and free access to food and water. Lights were set on a 12 h on 12 h off reverse cycle (lights off from 07:00 to 19:00 h), and temperature was maintained at 25° C.
All behavioral experiments were performed during the first phase of the dark cycle. Pregnant females were housed separately until time of birth. Day of birth was recorded as PND0 and pup body weights were recorded. All pups were labeled for individual identification by marking their tails. A maximum of 4 male and 4 female offspring were used from each litter. Following PND 5, body weight was measured every 4 days.
Genotyping was performed by tail DNA polymerase chain reaction (PCR) analyses as described previously [23]. Primers 1 (TCCAGCTGTG CAGTTCTCCAAAACA) and 2 (ATTCCAGAGGGGTGACTACCACATT) were used for amplification of wild-type sequences (397 bp) and primers 1 and 3 (AGCCCAGAAAGCGAAGGAGCAAAGC) for amplification of the null sequences (513 bp).
2.2. Developmental and behavioral assessment
Testing ranged from P7 to P30 and consisted of eye opening, negative geotaxis test, hanging wire grip strength, mid-air righting, social interaction and motor activity. Pups were randomly picked and tests were performed in the order stated above (Figure 1). For tests that were done on the same day, tests were performed with one hour breaks in between.
Figure1.

Developmental and behavioral assessment-timeline
2.2.1. Eye opening
Starting at PND7 pups were examined daily to determine the first day that both eyes were open.
2.2.2. Negative geotaxis test
General coordination and strength were evaluated using the negative geotaxis test on PNDs 9–19 by placing the pup on a grid wire surface (30 cm × 18 cm divided into 1.2 cm grid squares) facing downward along a 45° incline. Latency to turn 180° such that the head was facing upward along the incline was recorded with a maximum of 60 s each trial. The test was repeated daily until the pup reached the test criteria, performing the behavior correctly in less than 30 seconds for two consecutive days.
2.2.3. Hanging wire grip strength
Wire grip strength is commonly used as a test for neuromuscular strength and stamina [24]. Pups were placed on a wire 30 cm above a padded surface on PNDs 13–19 and the latency to fall was recorded with a maximum of 60 s each trial.
2.2.4. Mid-air righting
Ability to right in mid-air was tested on PNDs 13–19 to examine motor coordination and reflex. Pups were held 30 cm above a padded surface by the scruff of the neck ventral side up with all four paws extended upward. The ability to right was scored positive if the mouse landed on all four paws. There were three trials each day and a score of 0–3 was recorded. A score of 0 means that the animal was not able to complete the test successfully (landing on its 4 paws) in all 3 trails. A score of 1 means that the animal was able to complete the test successfully 1 out of the 3 trails. A score of 2 means that the animal was able to complete the test successfully 2 out of the 3 trails and a score of 3 means that the animal was able to complete the test successfully 3 out of the 3 trails.
2.2.5. Social Interaction and Play Behavior
The behavior chamber was a standard large cage with fresh bedding. Locomotor behavior was recorded via photocell beams located around the cage (Opto-Varimex, Columbus, OH). Naïve mice were individually housed for one week prior to the test session. Pairs of non-sibling, 30 day old, ephrin-A5-null and wild-type male mice were observed for social interactions for one 30 min session and scored by two trained observers for the number of times that a member of the pair engaged in a behavior. All observers were blind to the genotype, and were trained on mouse pairs not used in this study until there was 98% agreement in the observation scores. Testing was conducted at the start of the dark cycle and the testing room was illuminated by red light. During testing, the behaviors observed were: face sniffs, crawl-under/over behaviors (defined as one mouse crawling under or over another mouse) self-grooming, and allogrooming (defined as one mouse rising up on its hind legs to touch paws and snout to the other mouse to perform grooming motions).
2.2.6. Motor activity
Horizontal motor activity was tested under both social and non-social conditions. In the non-social test, young (PND 21) and adult (PND 60) mice were placed in an empty plastic cage which was then placed into a black Plexiglass box. Interuptions of horizontal-projecting photocell sensors (placed approximately 7 cm apart and 2.5 cm above the floor) were recorded for 30 minutes with six, five minute bouts per session. The social interaction test was done as described above.
2.3. HPLC analysis
A separate group of naïve, wild-type and ephrin-A5-null mice were sacrificed at PND15 and 30 and the brains removed. Selected brain regions were dissected on ice, snap frozen, and stored at −80 °C until analysis, as described previously [25]. Briefly, frozen samples were sonicated in 500 μL of 0.1 N perchloric acid and centrifuged at 15,000 × g for 20 min at 4 °C. The pellets were kept for protein assay and the supernatants were re-centrifuged as above. The resulting supernatants were filtered and an aliquot of 20 μl was injected into the HPLC with electrochemical detection (Waters, Milford, MA, USA) for neurochemical analysis of norepinephrine (NE), dopamine (DA) and its metabolites, 3, 4-dihydroxyphenylacetic acid (DOPAC) and homovanillic acid (HVA) and 5-hydroxytryptamine (5-HT) and its metabolite 5-hydroxyindoleacetic acid (5-HIAA). The components were separated on a cation exchange column (MD-150 × 3.2 column, ESA Biosciences Inc.) using isocratic mobile phase (MD-TM, ESA Biosciences Inc.) containing 2.2 mM NaCl pumped at a constant flow rate of 0.5 ml/min. The compounds were quantified by electrochemical detection (flow cell, 2 mm GC WE, ISAC, Waters, Milford, MA, USA).
2.4. Western immunoblotting
Western blots were used to quantify the amount of the dopamine transporter (DAT), tyrosine hydroxylase (TH), the vesicular monoamine transporter 2 (VMAT2), and syntaxin present in samples of striatal tissue from wild-type and knockout mice as described previously [26]. Briefly, samples (15 μg protein) were subjected to polyacrylamide gel electrophoresis on 4–12% precast NuPage gels (Invitrogen, Carlsbad, CA) and transferred to a polyvinylidene difluoride membrane. Membranes were then incubated overnight with a rat monoclonal antibody to the N-terminus of the DAT (Millipore, Temecula, CA, 1:5000). DAT antibody binding was detected using a goat anti-rat horseradish peroxidase secondary antibody and enhanced chemiluminescence. The luminescence signal was captured on an Alpha Innotech Fluorochem imaging system and stored as a digital image prior to densitometric analysis. Membranes were stripped with Pierce Stripping Buffer and sequentially reprobed with rabbit anti-VMAT2 polyclonal antibody (Millipore, 1:5000), rabbit anti-TH polyclonal antibody (Millipore, 1:1000) and monoclonal anti-syntaxin (Sigma, St. Louis, MA, 1:50,000). Syntaxin levels were used to normalize data among samples.
2.5. Statistical analysis
All data were analyzed using the SPSS statistics package. Behavioral analysis was performed using analysis of variance (ANOVA or repeated-measures ANOVA when the data was measured across days or trials) with Tukey's post hoc test where appropriate. Brain chemistry was assessed using multifactorial ANOVA s including genotype and age as main factors with Tukey's post hoc test where appropriate. Western blot data were analyzed using unpaired Student's t-test. Since initial results showed no significant main effects or interaction effects for sex in any test other than body weight, sex was excluded from all behavioral analyses.
3. Results
3.1 Changes in body weight in ephrin-A5-null mice
A repeated measurement ANOVA revealed that there was a significant effect of genotype [F(1,53) = 64.59, p < 0.001], sex [F(1,53) = 12.98, p < 0.001], and PND [F(15,795) = 2646.644, p < 0.001], as well as significant interactions: sex × genotype [F(1,53) = 5.45, p = .0234], day × sex [F(15,795) = 12.356, p < 0.001], day × genotype [F(15,795) = 27.807, p < 0.001], and day × sex × genotype [F(15,795) = 3.130, p < 0.001] (Figure 2A and 2B). Post hoc tests revealed that there were no differences in birth weight regardless of genotype or sex. In wild-type mice, a sex difference developed at PND 29 and persisted through PND 60 with males weighing significantly more than females. However, in knockout mice there were no significant sex differences at any time point. In male animals, a genotypic difference in weight manifested at PND 13 with wild-type mice weighing significantly more than knockout animals (Figure 2A). In female mice, this same genotypic difference was observed slightly later at PND 17 (Figure 2B). To determine whether the decrease in body weight was due to decreased food and water consumption, food and water were monitored daily for a period of 4 days in adult mice. There were no significant differences for total food and water intake between the genotypes (Figure 2C). Since food and water intake could only be measured following weaning, it is unclear whether there were genotypic differences in caloric intake at the time when initial body weight differences emerged.
Figure 2.
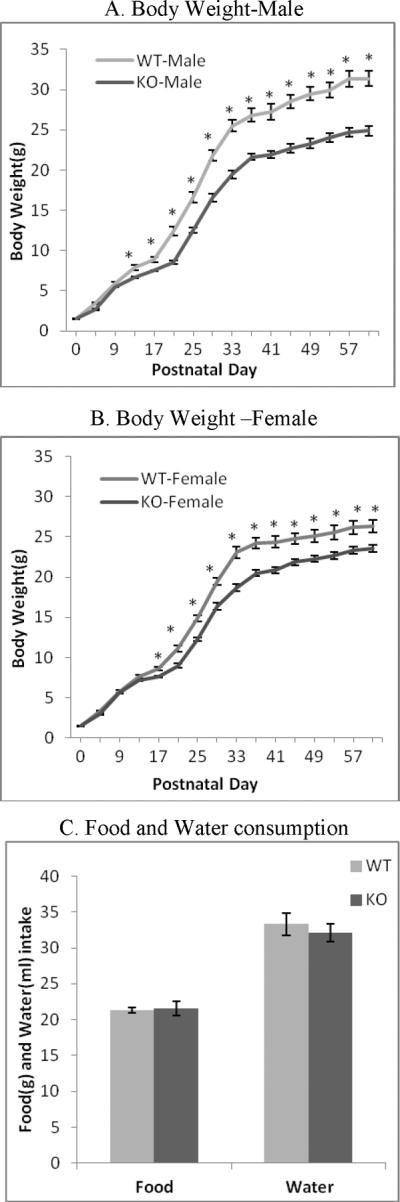
A and B. Changes in body weight during development of ephrin-A5-null and wild-type mice. Ephrin-A5-null and wild-type pups were weight at day of birth (PND0), and following PND5, body weight was measured every 4 days until PND60. Weight was measured in grams. Data represent mean body weight ±SEM. * indicates significantly different from ephrin-A5-null mice; p< 0.05.
C. Food and water consumption by ephrin-A5-null and wild-type mice. Starting on PND60, food and water intake were measured daily for four days in individually housed ephrin-A5-null and wild-type animals (n=10). There were no significant differences between the genotypes. Data represent mean food and water intake ±SEM.
3.2. Motor developmental delays in ephrin-A5-null mice
Loss of ephrin-A5 significantly altered motor function and sensory development in mouse pups starting as early as PND13. Approximately 65 percent of the wild-type pups exhibited eye opening by PND13 compared to only 37.5 percent of the ephrin-A5-null pups [F(1,66) = 4.5, p = 0.037] (Figure 3). Likewise, time to complete the negative geotaxis test as well as day to reach test criteria were significantly longer in ephrin-A5-null mice compared to wild-type controls [F(1,64) = 1471.87, p < 0.001] (Figure 4A). In addition, latency to complete the negative geotaxis test significantly decreased with age in both genotypes [F(8,512) = 32.402, p < 0.001]. Approximately eighty percent of the wild-type pups reached criteria by PND13 and by PND15 all wild-type animals completed the test. In contrast, only ten percent of the ephrin-A5-null mice had reached criteria by PND13 and it was not until PND17 that all had achieved this level (Figure 4B). There were no significant differences for mid-air righting between wild-type and ephrin-A5-null mice (data not shown).
Figure 3. Delayed eye opening in ephrin-A5-null mice.
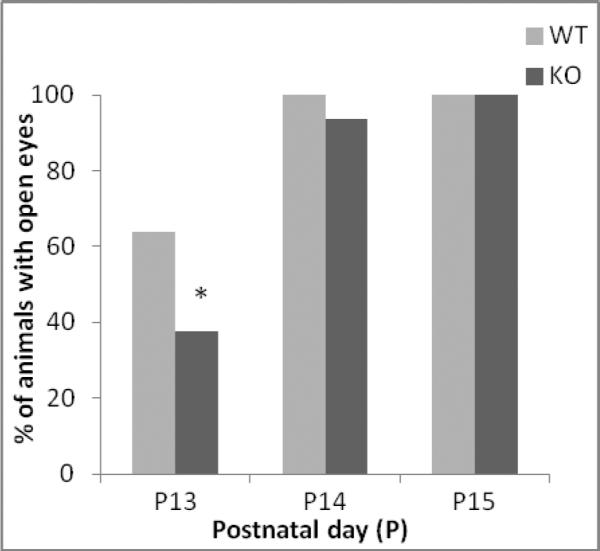
Starting at PND9, ephrin-A5-null (n=32) and wild-type (n=36) mice were observed daily to determine the first day in which both eyes were open. * indicates significantly different from wild-type mice; p< 0.05.
Figure 4. Decreased performance and delay in reaching criteria by ephrin-A5-null mice in the negative geotaxis developmental test.

The ability of ephrin-A5-null (n=32) and wild-type (n=36) mice to display the negative geotaxis response was tested on PND9–17.
A. The mean latency of ephrin-A5-null and wild-type mouse pups to re-orient themselves 180° across nine days of testing. Starting at day three of testing, ephrin-A5-null mice are significantly slower to re-orient themselves compare to wild-type animals. Data represent mean latency to re-orient 180° ±SEM. * indicates significantly different from wild-type pups, p<0.05. B. Wild-type mice reached test criteria two days earlier then ephrin-A5-null mice.
Hanging wire performance significantly increased over the seven days of testing in both genotypes [F(6,396) =94.676, p < 0.001] (Figure 5). However, starting on PND14, ephrin-A5-null mice fell from the wire significantly faster than wild-type animals [F(1,66)= 13.42, p < 0.001] (Figure 5). This poor performance continued until the sixth day of testing (PND18). By PND19 no differences were observed between the genotypes. All motor and developmental milestone testing was done in both male and female pups, however, no sex differences were found.
Figure 5. Delayed development of grip strength in ephrin-A5-null mice.
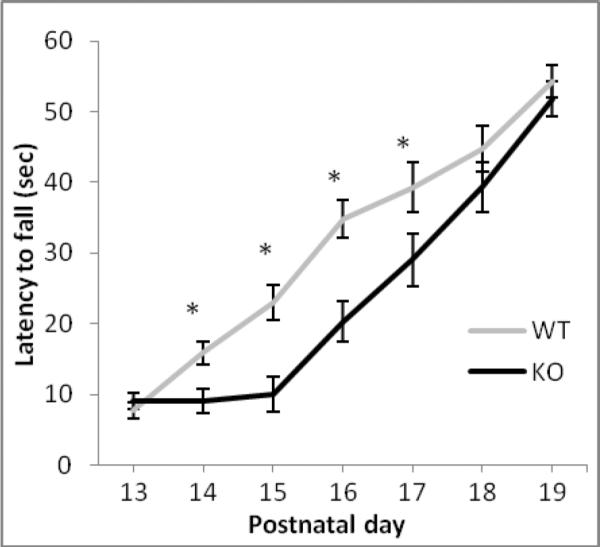
Grip strength ability was measured using the hanging wire tests on PND13–19 in ephrin-A5-null (n=32) and wild-type (n=36) mouse pups. Data represent mean latency to fall ±SEM.
* indicates significantly different from ephrin-A5-null pups; p<0.05.
Overall motor activity was assessed in young (PND21) and adult (PND60) male mice under both social and non-social conditions (Figure 6A and 6B). When examined in the non-social test, the total number of horizontal movements over six 5-min bins was significantly higher for ephrin-A5-null mice compared to wild-type mice [F(1,52) =17.58, p < 0.001] (Figure 6A). In addition there was a significant effect of bin [F(5,260)=98.36, p < 0.001] without bin × genotype or bin × genotype × age interactions. This increased activity persisted as adults and was also observed under social conditions. In the social behavior test, a pair of non-sibling null and wild-type mice was observed for social interactions for a 30 min session. Ephrin-A5-null mice again exhibited a significant increase in motor activity during the 30 minute paired testing period [F(1,16) = 6.37, p= 0.02] (Figure 7B), although no differences were observed for face sniffs, crawl-under/over behaviors, self-grooming, and allogrooming (data not shown).
Figure 6. Ephrin-A5-null mice showed persistent increased locomotor activity.

A. Horizontal locomotor activity of young (PND23) and adult (PND60) ephrin-A5-null and wild-type mice were monitored for 30 min each. Ephrin-A5-null mice exhibited increased locomotor activity at both time points.
B. Social behavior was assessed between genotype, sex and age matched non-sibling pairs during a 30 minutes open field observation session. These observation sessions were run on PND30. The number of horizontal motor movements made by the pair of mice was recorded. Data represent mean ±SEM. * indicates significantly different from wild-type mice; p<0.05.
Figure 7. Alterations in the dopamine system in the brain of ephrin-A5-null mice.

Ephrin-A5-null and wild-type mice were sacrificed on PND15 and 30 and different brain regions were dissected and analyzed for dopamine (DA) and its metabolites using HPLC. The brain regions that were analyzed were hypothalamus, frontal cortex, striatum, hippocampus and cerebellum. Reduction of DA levels in the striatum (A) and the hypothalamus (B) were observed in null mice. In addition, the dopamine metabolite DOPAC (C) and the DOPAC/DA turnover rate were also increased in the striatum. Data represent mean ng of neurotransmitter /mg of protein +SEM. * indicates significantly different from wild-type mice; p < 0.05. ^ indicates significant different from P15 within strain; p < 0.05.
3.3. Decreased monoamine concentrations in the brain of ephrin-A5-null mice
There was an overall decrease in the levels of monoamines in ephrin-A5-null mice (Table 1, Figure 7 and Figure 8) with lower levels of DA in the striatum [F(1,37) = 9.25, p = 0.004] (Figure 7A) and the hypothalamus [F(1,34) = 10.2, p= .003] (Figure 7B), 5-HT in the hippocampus [F(1,35) = 5.2, p= .028] (Figure 8A) and the cerebellum [F(1,34) = 6.5, p = .015] (Figure 8B) and NE in the frontal cortex [F(1,34) = 14.4, p = .001] (Figure 8D). These reductions were consistent in both 15 and 30 day old mice. In addition, DA turnover in the striatum (Figure 7D), as assessed by comparing the ratio of DOPAC to DA, was significantly higher in the null mice compared to wild-types. These results are consistent with the decreased DA and increased DOPAC [F(1,37) = 4.58, p = 0.038] (Figure 7C) seen in the striatum. The 5-HT metabolite 5-HIAA was also significantly lower in the cerebellum of null mice at both ages [F(1,34) = 8.9, p = .005] (Figure 8C).
Table 1.
Neurotransmitter and metabolite levels detected in the cerebellum, hippocampus, striatum, frontal cortex and hypothalamus of ephrin-A5-null and wild-type mice.
| WT 15 | KO 15 | WT 30 | KO 30 | |
|---|---|---|---|---|
| A. Cerebellum | ||||
| 5-HIAA/5-HT | 2.37 ± 0.96 | 4.81 ± 1.15 | 0.83 ± 0.12 | 1.16 ± 0.17 |
| NE | 13.7 ± 0.99 | 11.6 ± 1.67 | 14.4 ± 1.59 | 12.4 ± 0.40 |
| B. Hippocampus | ||||
| 5-HIAA | 1.26 ± 0.20 | 1.02 ± 0.09 | 1.59 ± 0.10 | 1.07 ± 0..12 |
| 5-HIAA/5-HT | 0.97 ± 0.09 | 1.33 ± 0.26 | 0.55 ± 0.10^ | 0.78 ± 0.20^ |
| NE | 8.59 ± 1.01 | 8.02 ± 0.55 | 8.55 ± 0.61 | 7.46 ± 0.63 |
| C. Striatum | ||||
| HVA | 11.2 ± 0.45 | 12.8 ± 0.69 | 9.24 ± 0.73^ | 9.56 ± 0.92^ |
| DOPAC/HVA | 0.25 ± 0.02 | 0.43 ± 0.05* | 0.21 ± 0.04^ | 0.28 ± 0.03^* |
| 5-HT | 2.11 ± 0.50 | 1.79 ± 0.33 | 3.64 ± 0.75 | 2.10 ± 0.50 |
| 5-HIAA | 3.50 ± 0.28 | 4.26 ± 0.41 | 2.62 ± 0.31^ | 3.03 ± 0.46^ |
| 5-HIAA/5-HT | 1.56 ± 0.56 | 1.73 ± 0.33 | 1.58 ± 0.76 | 1.56 ± 0.47 |
| NE | 5.87 ± 0.91 | 4.86 ± 0.94 | 6.59 ± 0.91 | 7.15 ± 0.98 |
| D. Frontal Cortex | ||||
| DA | 7.84 ± 0.93 | 11.0 ± 1.97 | 25.1 ± 4.01^ | 19.9 ± 3.94^ |
| DOPAC | 1.91 ± 0.24 | 3.00 ± 0.40 | 4.17 ± 0.87^ | 3.95 ± 0.78^ |
| HVA | 3.20 ± 0.52 | 3.28 ± 0.37 | 4.42 ± 0.78 | 4.26 ± 0.68 |
| DOPAC/DA | 0.30 ± 0.08 | 0.32 ± 0.07 | 0.16 ± 0.01^ | 0.20 ± 0.02^ |
| DOPAC/HVA | 0.43 ± 0.06 | 0.33 ± 0.02 | 0.17 ± 0.01 | 0.22 ± 0.01 |
| 5-HT | 2.33 ± 0.26 | 1.79 ± 0.23 | 5.49 ± 0.81^ | 4.32 ± 0.69^ |
| 5-HIAA | 1.07 ± 0.11 | 1.22 ± 0.12 | 1.11 ± 0.19 | 1.35 ± 0.13 |
| 5-HIAA/5-HT | 0.49 ± 0.08 | 0.76 ± 0.11* | 0.22 ± 0.03^ | 0.36 ± 0.05*^ |
| E. Hypothalamus | ||||
| DOPAC | 58.0 ± 10.5 | 43.3 ± 4.58 | 48.8 ± 10.0 | 43.5 ± 4.10 |
| HVA | 101 ± 13.3 | 85.0 ± 8.91 | 61.5 ± 10.3^ | 50.8 ± 4.79^ |
| DOPAC/DA | 1.48 ± 0.19 | 2.62 ± 0.80 | 0.77 ± 0.10^ | 1.34 ± 0.20^ |
| DOPAC/HVA | 2.97 ± 0.53 | 4.25 ± 0.86 | 0.98 ± 0.10^ | 1.44 ± 0.14^ |
| 5-HT | 53.4 ± 7.20 | 57.1 ± 13.0 | 64.4 ± 3.81 | 45.0 ± 6.84 |
| 5-HIAA | 62.6 ± 10.3 | 57.5 ± 4.99 | 40.8 ± 5.30^ | 41.9 ± 2.79^ |
| 5-HIAA/5-HT | 1.30 ± 0.22 | 2.28 ± 0.47 | 0.64 ± 0.56 | 1.24 ± 0.43 |
| NE | 16.9 ± 2.00 | 17.0 ± 1.93 | 18.7 ± 2.26 | 13.8 ± 4.83 |
Values are expressed in μg/g of tissue ±SEM.
indicates significantly different from wild-type mice; p < 0.05.
indicates significant different from P15 within strain; p < 0.05.
Figure 8. Alterations in serotonin, its metabolite and norepinephrine levels in the brain of ephrin-A5-null mice.

Ephrin-A5-null and wild-type mice were sacrificed on PND15 and 30 and different brain regions were dissected and analyzed for norepinephrine (NE), serotonin (5HT) and its metabolites using HPLC. The brain regions analyzed were hypothalamus, frontal cortex, striatum, hippocampus and cerebellum. 5HT levels were reduced in the hippocampus (A) and the cerebellum (B) of null mice. In addition, the 5HT metabolite 5HIAA (C) was also reduced in the cerebellum. Finally, NE levels in the frontal cortex (D) were decreased in the frontal cortex. Data represent mean ng of neurotransmitter /mg of protein +SEM. *indicates significantly different from wild-type mice; p < 0.05. ^ indicates significant different from P15 within strain; p < 0.05.
3.4. Decreased DAT and VMAT2 protein levels the striatum of ephrin-A5-null mice
DAT, VMAT2 and TH protein levels in the striatum of 30 day old wild-type and ephrin-A5-null were measured. There was a decrease in both DAT and VMAT2 protein levels in the striatum of ephrin-A5-null mice. DAT levels were decreased by 38 percent (t =−2.914, p =0.03; Figure 9) and VMAT2 levels by 41 percent (t =−3.670, p =0.01; Figure 9). These results are consistent with our HPLC striatal findings. TH protein levels were reduced by 25 percent between wild-types and ephrin-A5-null animals, but this did not reach statistical significance (p = 0.20; Figure 9).
Figure 9. Decreased DAT and VMAT2 protein levels in ephrin-A5-null mice.
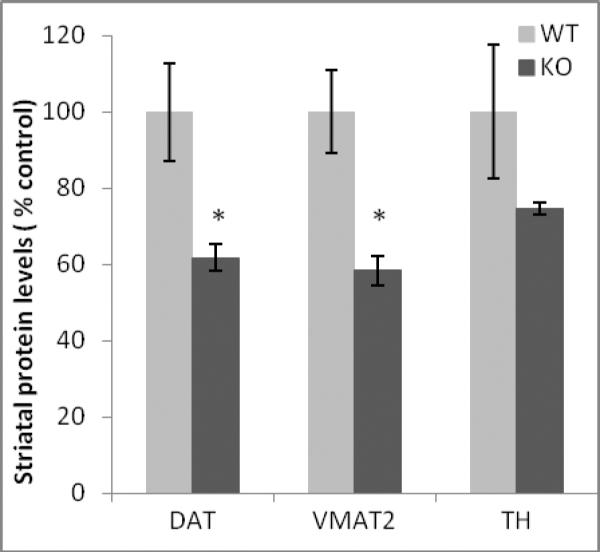
Ephrin-A5-null and wild-type mice were sacrificed on PND30 and the striatum was dissected and analyzed for dopamine transporter (DAT), tyrosine hydroxylase (TH), the vesicular monoamine transporter 2 (VMAT2), and syntaxin protein levels using Western immunoblotting. DAT and VMAT2 levels were reduced in the striatum of ephrin-A5-null mice.
Data represent protein levels (percent of control) ± S.E.M. (n = 4 animals per group). Syntaxin levels were used to ensure equal protein loading across samples.*indicates significantly different from wild-type mice; p < 0.05.
4. Discussion
Previously, we have reported that ephrin-A5 and one of its receptors, EphA5, are important in regulating the proper targeting of dopaminergic axons during neuronal development [20]. As such, disruption of dopaminergic targeting may lead to loss of dopamine and alterations of psychomotor and sensorimotor behaviors which are highly dependent on monaminergic function. Here, we focused on assessing the effects of loss of ephrin-A5 on neurobehavioral development. Our data reveal that loss of ephrin-A5 leads to developmental delays, deficits in sensorimotor development, increased locomotor activity, and global decreases in several monoamines and their metabolites in the brain.
Ephrin-A5-null mice were found to have delayed eye opening and exhibited deficits in their performance of the negative geotaxis and the hanging wire grip strength tests. These developmental delays could be attributed in part to decreased body weight. Since mice of both genotypes ate the same amount of food as adults (Figure 2C), we speculate that the reduction in body weight seen in ephrin-A5-null mice is most likely attributable to alteration in metabolism and/or level of activity.
Ephrin-A5-null mice exhibited significant deficits in their performance in the negative geotaxis and hanging wire tests (Figure 4 and 5). While ephrin-A5-null mice were able to reach wild-type performance levels by PND19 in the hanging wire test, they were never able to reach wild-type performance levels in the negative geotaxis testing period, suggesting a more lasting deficit in certain aspects of motor control. Our neurochemical results indicate that these mice also exhibited decreases in cerebellar 5-HT and its metabolite (5-HIAA) and, therefore, it may be possible to attribute these functional deficits to the alterations in cerebellar monoaminergic system development, although other possibilities exist. In addition to cerebellar monoaminergic changes, ephrin-A5-null mice exhibited decreases in 5-HT in the hippocampus, DA in the striatum and hypothalamus, and NE in the frontal cortex.
Dramatic alteration in central monoaminergic systems such as those observed in ephrin-A5-null mice have been linked to depression, schizophrenia and attention deficit-hyperactivity disorder (ADHD) [27, 28]. In particular, the alterations in regional monoaminergic levels including the cerebellum, frontal cortex and striatum are evident in the same regions most affected in ADHD [29]. For example, neuroimaging studies show that individuals with ADHD have brain volume reductions in the cerebellum, prefrontal cortex, striatum, corpus collosum and the dorsal anterior cingulate cortex as compared to healthy controls [30]. These findings indicate that ADHD symptoms are most likely due to structural and functional alterations that encompass a large portion of the central nervous system and not one isolated brain region. More recently, data from genome-wide association studies have identified a neurodevelopmental network involved in neurite outgrowth to be altered in ADHD [31]. In addition, evidence for the involvement of cell adhesion/axon guidance molecules, in ADHD was reported [32, 33]. Based on these findings and on the role of ephrin-A5 in neurite outgrowth [17] and targeting of dopaminergic axons [20], these data suggest that loss of ephrin-A5 may result in neurodevelopmental alterations that may contribute to behavioral phenotypes such as the ones observed in ADHD.
Many of the core symptoms used for ADHD diagnosis fall under the hyperactivity category. Excessive running and difficulty in engaging in playing or quiet leisure activity falls under this category. In addition, it was found that children diagnosed with ADHD have delays in motor skill development that was reflected in both the physical and neurological examination for subtle signs and in short interval cortical inhibition in the motor cortex [34]. These share some similarity to the developmental delays and hyperlocomotion observed in the ephrin-A5-null mice. Additionally, identified ADHD susceptibility genes are known to be involved in the regulation of monoamine activity [35] and stimulant therapy for ADHD act as broad-spectrum monoaminergic agonists [36, 37]. Given that ephrin-A5-null mice have decreases in DA, NE and 5-HT in the same brain regions implicated in ADHD pathology and that persistent hyperactivity is observed, our data suggest that the ephrin-A5-null mouse may be an appropriate animal model for the study of hyperactivity associated with ADHD. However, further study is needed to assess additional behavioral domains, such as sustained attention and impulsive behaviors.
Monoamines are essential for normal brain development and postnatal survival [38, 39]. Monoamine levels are controlled through a combination of synthesis, storage, and re-uptake, which, if altered, can have significant consequence on proper development. Indeed, significant reductions in monoamines and developmental delays have been observed in vesicular monoamine transporter (VMAT2) and dopamine transporter (DAT) knockout mice. Although VMAT2 knockout is lethal, VMAT2 hypomorphs that express approximately 5 percent VMAT2 have certain similarities with ephrin-A5-null mice, because of the global decreases in brain monoamine levels and the decreased levels of VMAT2. VMAT2 deficient animals have diminished levels of DA, NE and 5-HT and increased monoamine turnover in the striatum, cortex and hippocampus, three of the brain regions in which ephrin-A5-null mice have monoamine decreases [40, 41]. Similarly, DAT knockout mice have decreased levels of DA, developmental delays, and are hyperactive [42]. Thus, alterations in monoamine transporter levels can have significant consequences on monoamine levels, neuronal development, and behavioral function. Here, we found that ephrin-A5-null mice had decreased DAT and VMAT2 levels. Decreased DAT levels have also been observed by neuroimaging in some ADHD patients [43] and VMAT2 levels have been found to be decreased in platelets of ADHD patients in one small study [44].
In summary, ephrin-A5-null mice exhibited increased motor activity and developmental delays as compared to wild-type mice. This increase in motor behavior was replicated under several different testing conditions, both in social and non-social conditions. Decreased brain region levels of monoamines, increased locomotor activity and developmental delays are all key components in the diagnosis of ADHD. Future studies should examine the sensitivity of these mice to psychomotor stimulants and whether these mice have alterations in working memory, attention, and impulsive behavior to better assess the relevance of ephrin-A5-null mice to ADHD behavior.
Highlights
-
➢
Ephrin-A5-null mice exhibit delays in the maturation of several motor skills
-
➢
Ephrin-A5 -null mice exhibit increased locomotor activity under both social and non-social conditions
-
➢
Ephrin-A5-null mice have reduced levels of brain monoamines
Acknowledgements
We would like to thanks Chris Medvecky for his help with the statistical analysis.
This research was supported in part by NIH Grants R01ES015991, P30ES005022, T32ES007148 and 2P01HD023315.
Footnotes
Publisher's Disclaimer: This is a PDF file of an unedited manuscript that has been accepted for publication. As a service to our customers we are providing this early version of the manuscript. The manuscript will undergo copyediting, typesetting, and review of the resulting proof before it is published in its final citable form. Please note that during the production process errors may be discovered which could affect the content, and all legal disclaimers that apply to the journal pertain.
References
- [1].Palmer A, Klein R. Multiple roles of ephrins in morphogenesis, neuronal networking, and brain function. Genes & development. 2003;17:1429–50. doi: 10.1101/gad.1093703. [DOI] [PubMed] [Google Scholar]
- [2].Klein R. Bidirectional modulation of synaptic functions by Eph/ephrin signaling. Nature neuroscience. 2009;12:15–20. doi: 10.1038/nn.2231. [DOI] [PubMed] [Google Scholar]
- [3].Reber M, Hindges R, Lemke G. Eph receptors and ephrin ligands in axon guidance. Advances in experimental medicine and biology. 2007;621:32–49. doi: 10.1007/978-0-387-76715-4_3. [DOI] [PubMed] [Google Scholar]
- [4].Wilkinson DG. Multiple roles of EPH receptors and ephrins in neural development. Nature reviews Neuroscience. 2001;2:155–64. doi: 10.1038/35058515. [DOI] [PubMed] [Google Scholar]
- [5].Daar IO. Non-SH2/PDZ reverse signaling by ephrins. Seminars in cell & developmental biology. 2011 doi: 10.1016/j.semcdb.2011.10.012. [DOI] [PMC free article] [PubMed] [Google Scholar]
- [6].Pasquale EB. Eph receptor signalling casts a wide net on cell behaviour. Nature reviews Molecular cell biology. 2005;6:462–75. doi: 10.1038/nrm1662. [DOI] [PubMed] [Google Scholar]
- [7].Xu NJ, Henkemeyer M. Ephrin reverse signaling in axon guidance and synaptogenesis. Seminars in cell & developmental biology. 2011 doi: 10.1016/j.semcdb.2011.10.024. [DOI] [PMC free article] [PubMed] [Google Scholar]
- [8].Adams RH, Eichmann A. Axon guidance molecules in vascular patterning. Cold Spring Harbor perspectives in biology. 2010;2:a001875. doi: 10.1101/cshperspect.a001875. [DOI] [PMC free article] [PubMed] [Google Scholar]
- [9].Pasquale EB. Eph-ephrin bidirectional signaling in physiology and disease. Cell. 2008;133:38–52. doi: 10.1016/j.cell.2008.03.011. [DOI] [PubMed] [Google Scholar]
- [10].Feldheim DA, O'Leary DD. Visual map development: bidirectional signaling, bifunctional guidance molecules, and competition. Cold Spring Harbor perspectives in biology. 2010;2:a001768. doi: 10.1101/cshperspect.a001768. [DOI] [PMC free article] [PubMed] [Google Scholar]
- [11].Klein R. Eph/ephrin signaling in morphogenesis, neural development and plasticity. Current opinion in cell biology. 2004;16:580–9. doi: 10.1016/j.ceb.2004.07.002. [DOI] [PubMed] [Google Scholar]
- [12].Brownlee H, Gao PP, Frisen J, Dreyfus C, Zhou R, Black IB. Multiple ephrins regulate hippocampal neurite outgrowth. The Journal of comparative neurology. 2000;425:315–22. doi: 10.1002/1096-9861(20000918)425:2<315::aid-cne12>3.0.co;2-#. [DOI] [PubMed] [Google Scholar]
- [13].Chen ZY, Sun C, Reuhl K, Bergemann A, Henkemeyer M, Zhou R. Abnormal hippocampal axon bundling in EphB receptor mutant mice. The Journal of neuroscience : the official journal of the Society for Neuroscience. 2004;24:2366–74. doi: 10.1523/JNEUROSCI.4711-03.2004. [DOI] [PMC free article] [PubMed] [Google Scholar]
- [14].Bolz J, Uziel D, Muhlfriedel S, Gullmar A, Peuckert C, Zarbalis K, et al. Multiple roles of ephrins during the formation of thalamocortical projections: maps and more. Journal of neurobiology. 2004;59:82–94. doi: 10.1002/neu.10346. [DOI] [PubMed] [Google Scholar]
- [15].Deschamps C, Morel M, Janet T, Page G, Jaber M, Gaillard A, et al. EphrinA5 protein distribution in the developing mouse brain. BMC neuroscience. 2010;11:105. doi: 10.1186/1471-2202-11-105. [DOI] [PMC free article] [PubMed] [Google Scholar]
- [16].Zhang JH, Cerretti DP, Yu T, Flanagan JG, Zhou R. Detection of ligands in regions anatomically connected to neurons expressing the Eph receptor Bsk: potential roles in neuron-target interaction. The Journal of neuroscience : the official journal of the Society for Neuroscience. 1996;16:7182–92. doi: 10.1523/JNEUROSCI.16-22-07182.1996. [DOI] [PMC free article] [PubMed] [Google Scholar]
- [17].Gao WQ, Shinsky N, Armanini MP, Moran P, Zheng JL, Mendoza-Ramirez JL, et al. Regulation of hippocampal synaptic plasticity by the tyrosine kinase receptor, REK7/EphA5, and its ligand, AL-1/Ephrin-A5. Molecular and cellular neurosciences. 1998;11:247–59. doi: 10.1006/mcne.1998.0696. [DOI] [PubMed] [Google Scholar]
- [18].Zarbalis K, Wurst W. Expression domains of murine ephrin-A5 in the pituitary and hypothalamus. Mechanisms of development. 2000;93:165–8. doi: 10.1016/s0925-4773(00)00252-5. [DOI] [PubMed] [Google Scholar]
- [19].Cutforth T, Moring L, Mendelsohn M, Nemes A, Shah NM, Kim MM, et al. Axonal ephrin-As and odorant receptors: coordinate determination of the olfactory sensory map. Cell. 2003;114:311–22. doi: 10.1016/s0092-8674(03)00568-3. [DOI] [PubMed] [Google Scholar]
- [20].Cooper MA, Kobayashi K, Zhou R. Ephrin-A5 regulates the formation of the ascending midbrain dopaminergic pathways. Developmental neurobiology. 2009;69:36–46. doi: 10.1002/dneu.20685. [DOI] [PMC free article] [PubMed] [Google Scholar]
- [21].Passante L, Gaspard N, Degraeve M, Frisen J, Kullander K, De Maertelaer V, et al. Temporal regulation of ephrin/Eph signalling is required for the spatial patterning of the mammalian striatum. Development. 2008;135:3281–90. doi: 10.1242/dev.024778. [DOI] [PubMed] [Google Scholar]
- [22].Robinson DL, Zitzman DL, Williams SK. Mesolimbic dopamine transients in motivated behaviors: focus on maternal behavior. Frontiers in psychiatry / Frontiers Research Foundation. 2011;2:23. doi: 10.3389/fpsyt.2011.00023. [DOI] [PMC free article] [PubMed] [Google Scholar]
- [23].Frisen J, Yates PA, McLaughlin T, Friedman GC, O'Leary DD, Barbacid M. Ephrin-A5 (AL-1/RAGS) is essential for proper retinal axon guidance and topographic mapping in the mammalian visual system. Neuron. 1998;20:235–43. doi: 10.1016/s0896-6273(00)80452-3. [DOI] [PubMed] [Google Scholar]
- [24].Crawley JN. Whats Wrong With my Mouse: A. John Wiley & Sons; 2000. [Google Scholar]
- [25].Schuh RA, Richardson JR, Gupta RK, Flaws JA, Fiskum G. Effects of the organochlorine pesticide methoxychlor on dopamine metabolites and transporters in the mouse brain. Neurotoxicology. 2009;30:274–80. doi: 10.1016/j.neuro.2008.12.015. [DOI] [PMC free article] [PubMed] [Google Scholar]
- [26].Caudle WM, Richardson JR, Wang M, Miller GW. Perinatal heptachlor exposure increases expression of presynaptic dopaminergic markers in mouse striatum. Neurotoxicology. 2005;26:721–8. doi: 10.1016/j.neuro.2004.09.003. [DOI] [PMC free article] [PubMed] [Google Scholar]
- [27].Maletic V, Robinson M, Oakes T, Iyengar S, Ball SG, Russell J. Neurobiology of depression: an integrated view of key findings. International journal of clinical practice. 2007;61:2030–40. doi: 10.1111/j.1742-1241.2007.01602.x. [DOI] [PMC free article] [PubMed] [Google Scholar]
- [28].Parkitna JR, Bilbao A, Rieker C, Engblom D, Piechota M, Nordheim A, et al. Loss of the serum response factor in the dopamine system leads to hyperactivity. The FASEB journal : official publication of the Federation of American Societies for Experimental Biology. 2010;24:2427–35. doi: 10.1096/fj.09-151423. [DOI] [PubMed] [Google Scholar]
- [29].Bush G. Cingulate, frontal, and parietal cortical dysfunction in attention-deficit/hyperactivity disorder. Biological psychiatry. 2011;69:1160–7. doi: 10.1016/j.biopsych.2011.01.022. [DOI] [PMC free article] [PubMed] [Google Scholar]
- [30].Emond V, Joyal C, Poissant H. Structural and functional neuroanatomy of attention-deficit hyperactivity disorder (ADHD) L'Encephale. 2009;35:107–14. doi: 10.1016/j.encep.2008.01.005. [DOI] [PubMed] [Google Scholar]
- [31].Poelmans G, Pauls DL, Buitelaar JK, Franke B. Integrated genome-wide association study findings: identification of a neurodevelopmental network for attention deficit hyperactivity disorder. The American journal of psychiatry. 2011;168:365–77. doi: 10.1176/appi.ajp.2010.10070948. [DOI] [PubMed] [Google Scholar]
- [32].Lesch KP, Timmesfeld N, Renner TJ, Halperin R, Roser C, Nguyen TT, et al. Molecular genetics of adult ADHD: converging evidence from genome-wide association and extended pedigree linkage studies. J Neural Transm. 2008;115:1573–85. doi: 10.1007/s00702-008-0119-3. [DOI] [PubMed] [Google Scholar]
- [33].Sandau US, Alderman Z, Corfas G, Ojeda SR, Raber J. Astrocyte-specific disruption of SynCAM1 signaling results in ADHD-like behavioral manifestations. PLoS One. 2012;7:e36424. doi: 10.1371/journal.pone.0036424. [DOI] [PMC free article] [PubMed] [Google Scholar]
- [34].Gilbert DL, Isaacs KM, Augusta M, Macneil LK, Mostofsky SH. Motor cortex inhibition: a marker of ADHD behavior and motor development in children. Neurology. 2011;76:615–21. doi: 10.1212/WNL.0b013e31820c2ebd. [DOI] [PMC free article] [PubMed] [Google Scholar]
- [35].Faraone SV, Mick E. Molecular genetics of attention deficit hyperactivity disorder. The Psychiatric clinics of North America. 2010;33:159–80. doi: 10.1016/j.psc.2009.12.004. [DOI] [PMC free article] [PubMed] [Google Scholar]
- [36].Meijer WM, Faber A, van den Ban E, Tobi H. Current issues around the pharmacotherapy of ADHD in children and adults. Pharmacy world & science : PWS. 2009;31:509–16. doi: 10.1007/s11096-009-9302-3. [DOI] [PMC free article] [PubMed] [Google Scholar]
- [37].Zametkin AJ, Rapoport JL. Neurobiology of attention deficit disorder with hyperactivity: where have we come in 50 years? Journal of the American Academy of Child and Adolescent Psychiatry. 1987;26:676–86. doi: 10.1097/00004583-198709000-00011. [DOI] [PubMed] [Google Scholar]
- [38].Takahashi N, Miner LL, Sora I, Ujike H, Revay RS, Kostic V, et al. VMAT2 knockout mice: heterozygotes display reduced amphetamine-conditioned reward, enhanced amphetamine locomotion, and enhanced MPTP toxicity. Proceedings of the National Academy of Sciences of the United States of America. 1997;94:9938–43. doi: 10.1073/pnas.94.18.9938. [DOI] [PMC free article] [PubMed] [Google Scholar]
- [39].Zhou QY, Quaife CJ, Palmiter RD. Targeted disruption of the tyrosine hydroxylase gene reveals that catecholamines are required for mouse fetal development. Nature. 1995;374:640–3. doi: 10.1038/374640a0. [DOI] [PubMed] [Google Scholar]
- [40].Caudle WM, Richardson JR, Wang MZ, Taylor TN, Guillot TS, McCormack AL, et al. Reduced vesicular storage of dopamine causes progressive nigrostriatal neurodegeneration. The Journal of neuroscience : the official journal of the Society for Neuroscience. 2007;27:8138–48. doi: 10.1523/JNEUROSCI.0319-07.2007. [DOI] [PMC free article] [PubMed] [Google Scholar]
- [41].Taylor TN, Caudle WM, Shepherd KR, Noorian A, Jackson CR, Iuvone PM, et al. Nonmotor symptoms of Parkinson's disease revealed in an animal model with reduced monoamine storage capacity. The Journal of neuroscience : the official journal of the Society for Neuroscience. 2009;29:8103–13. doi: 10.1523/JNEUROSCI.1495-09.2009. [DOI] [PMC free article] [PubMed] [Google Scholar]
- [42].Giros B, Jaber M, Jones SR, Wightman RM, Caron MG. Hyperlocomotion and indifference to cocaine and amphetamine in mice lacking the dopamine transporter. Nature. 1996;379:606–12. doi: 10.1038/379606a0. [DOI] [PubMed] [Google Scholar]
- [43].Volkow ND, Wang GJ, Newcorn J, Fowler JS, Telang F, Solanto MV, et al. Brain dopamine transporter levels in treatment and drug naive adults with ADHD. NeuroImage. 2007;34:1182–90. doi: 10.1016/j.neuroimage.2006.10.014. [DOI] [PubMed] [Google Scholar]
- [44].Toren P, Rehavi M, Luski A, Roz N, Laor N, Lask M, et al. Decreased platelet vesicular monoamine transporter density in children and adolescents with attention deficit/hyperactivity disorder. European neuropsychopharmacology : the journal of the European College of Neuropsychopharmacology. 2005;15:159–62. doi: 10.1016/j.euroneuro.2004.07.002. [DOI] [PubMed] [Google Scholar]