

Abstract
Here we provide the first evidence that tetraspanin CD151 can support de novo carcinogenesis. During two-stage mouse skin chemical carcinogenesis, CD151 reduces tumor lag time and increases incidence, multiplicity, size, and progression to malignant squamous cell carcinoma (SCC), while supporting both cell survival during tumor initiation and cell proliferation during the promotion phase. In human skin SCC, CD151 expression is selectively elevated compared to other skin cancer types. CD151 support of keratinocyte survival and proliferation may depend on activation of transcription factor STAT3, a regulator of cell proliferation and apoptosis. CD151 also supports PKCα-α6β4 integrin association and PKC-dependent β4 S1424 phosphorylation, while regulating α6β4 distribution. CD151-PKCα effects on integrin β4 phosphorylation and subcellular localization are consistent with epithelial disruption to a less polarized, more invasive state. CD151 ablation, while minimally affecting normal cell and normal mouse functions, markedly sensitized mouse skin and epidermoid cells to chemicals/drugs including DMBA (mutagen) and camptothecin (topoisomerase inhibitor), as well as to agents targeting EGFR, PKC, Jak2/Tyk2, and STAT3. Hence, CD151 ‘co-targeting’ may be therapeutically beneficial. These findings not only support CD151 as a potential tumor target, but also should apply to other cancers utilizing CD151-laminin-binding integrin complexes.
Keywords: tetraspanin CD151, skin squamous cell carcinoma, chemical carcinogenesis, integrin α6β4, STAT3, PKCα
Introduction
Cell surface protein CD151, a tetraspanin protein family member, is expressed in epithelial, endothelial, Schwann and dendritic cells, and in skeletal, smooth and cardiac muscle (52). CD151 associates closely with laminin-binding integrins (i.e. α3β1, α6β1, α6β4, α7β1) and modulates their functions (8; 18; 32; 48; 51; 53–55; 70; 74; 75). CD151-null mice are mostly viable, healthy and fertile (68). However, humans and mice (in particular strains, and under specific conditions) lacking CD151 have kidney and skin deficiencies (6; 13; 30; 44). Absence of laminin-binding integrins also causes kidney and skin pathology (7), consistent with CD151 being functionally linked to laminin-binding integrins. CD151 may affect functions of laminin-binding integrins by regulating integrin diffusion (72), glycosylation (5), and/or internalization (67). Also, CD151 can recruit proteins such as phosphoinositide 4-kinase, protein kinase C, and other tetraspanins (e.g. CD9, CD81, CD82, CD63) into complexes with laminin-binding integrins (12; 74; 76), which potentially affects integrin functions (26).
Because laminin and laminin-binding integrins contribute both negatively and positively to carcinogenesis (14; 24; 39; 63), CD151 conceivably also could play negative and/or positive roles. For example, integrin α6β4 suppresses tumor-initiating mouse skin cell growth (42) and induces apoptosis in carcinoma cells expressing p53 (4). Hence, while supporting α6β4, CD151 might inhibit early carcinogenesis stages. Alternatively, studies with cancer cell lines show CD151 contributing to epidermoid carcinoma cell migration and metastasis (77), breast cancer cell invasion and migration in vitro, and breast tumor xenograft growth in vivo (45; 73). Also, CD151 in host tissues facilitates tumor angiogenesis (57), and tumor cell CD151 supports ErbB2 drug resistance in cells plated on specific laminin isoforms (71). CD151 has not previously been reported to affect de novo carcinogenesis or specific stages of carcinogenesis (i.e. initiation, promotion, progression). Furthermore, there is little precedent from studies of related molecules (i.e. other tetraspanin proteins) for regulation of early carcinogenesis stages.
To evaluate CD151’s role during de novo carcinogenesis, we used two-stage skin chemical carcinogenesis (1). During skin tumor initiation, carcinogen DMBA is metabolized to reactive diol-epoxides that bind DNA and mutate target keratinocytes. Initiated cells escaping DNA repair and apoptosis may clonally expand during TPA-induced tumor promotion. This model is ideally suited for investigating CD151 functions in de novo carcinogenesis at specific carcinogenesis stages. Furthermore, mouse skin chemical carcinogenesis results are relevant to human skin SCC (1; 33). Among epidermoid carcinomas, squamous cell carcinoma (SCC) is one of the most common forms of cancer in the United States. There are ~250,000 new cases/year (2), with 2-9.9% metastasis incidence, which leads to poor long term prognosis (65).
We show significant and selective CD151 upregulated on human skin SCC samples. Also CD151 knockout mice, subjected to skin chemical carcinogenesis, showed extended tumor latency and decreased tumor incidence, multiplicity and size. Furthermore, CD151 contributed during skin tumor initiation, promotion, and progression stages, and supported chemical/drug resistance. Also we provide mechanistic insights involving CD151 effects on STAT3, PKCα and integrin α6β4. These results are relevant not only towards understanding human skin SCC, but also for other epithelial cancers similarly using CD151-integrin complexes.
Results
CD151 elevation in human skin SCC
To assess CD151 protein expression in human skin tumors, we examined 83 skin cancer microarray samples. Representative images (Figs. 1A–C) show abundant CD151 staining of human skin SCC samples, especially at cell surfaces, with also some intracellular staining (Fig. 1B). In normal human skin, CD151 is abundant only in basal and parabasal cell layers (Fig. 1C, left panel). Most human skin SCC samples showed elevated CD151 staining (67% with score of >1; Figure 1D.). Samples from grade II SCC trended towards more elevated CD151 staining (score =3, N=14), compared to Grade I SCC (score =2.35, N=36, p=0.1). Contrasting with skin SCC, other skin cancer types showed weak staining. Staining scores were =1 (Fig. 1D) for most basal cell carcinomas (BCC, 92%), metastatic melanoma (91%), and dermatofibrosarcoma protuberans (DFSP, 100%) samples. Overall, CD151 is selectively and significantly elevated in human skin SCC compared to other skin tumors (Fig. 1D; mean scores in right panel), and thus is well positioned for significant functional contributions.
Figure 1.

CD151 is elevated in human skin tissues. A, Staining of human skin SCC samples (5 left rows) and normal skin (right row). B, Enlarged CD151 staining of a human SCC sample. Red arrows indicate representative intracellular and peripheral CD151 staining. C, Immunohistochemical images show CD151 in normal skin (left panel) and skin SCC tumors with representative scoring = 1–4 (see Methods). D, Quantitation of results from a panel of different human skin cancer samples, such as shown in parts A and B. The right panel shows mean scores for 51 skin SCC and 32 combined BCC, MM and DFSP samples ± 95% C.I. *, P < 0.0001; Mann Whitney U test.
Response of CD151 null mice to two-stage carcinogenesis
To address CD151 functions, we used a two-stage mouse chemical carcinogenesis protocol, which models human skin SCC initiation, promotion and progression (1). CD151 wild type, heterozygous, and null mice (129/Sv strain) were backcrossed four generations into FVB/N background, which is substantially more sensitive to skin tumor formation (27). Mice were treated once with initiating agent DMBA (100 nmole), and then weekly with 8 nmole TPA (12-O-tetradecanoyl phorbol 13-acetate). Figure 2A shows markedly reduced tumor development in CD151-null, compared to +/+ and +/− mice. Tumors appeared in most +/+ mice by 7 weeks, in significantly greater numbers (up to 14/mouse). By contrast, −/− mouse tumors appeared later (after 9 weeks) and less frequently (2–4/mouse) (Figs. 2A–C), and were smaller (Figure 2D). Tumor appearance, multiplicity and size were only partly impaired in CD151+/− compared to CD151 +/+ mice (Fig. 2A–D). After 20 weeks, 6.4% of +/+ mouse tumors showed conversion to malignant squamous cell carcinoma (SCC). By contrast, malignant conversion was significantly reduced for +/− (2.3%) and −/− (0%) mouse tumors, as judged by histological analysis (Table 1). In summary, CD151 contributes to mouse skin tumor appearance, multiplicity, size, and malignant conversion.
Figure 2.

CD151 contribution to mouse skin tumor formation. A, Skin tumors in CD151+/+, +/−, and −/− mice 20 weeks after DMBA initiation. B, Delayed tumor appearance in CD151−/− mice. *, P < 0.0001 (log rank test). C, Average tumor numbers per mouse are indicated (± 95% CI). For data obtained after 20 weeks: **, P < 0.0001; *, P = 0.002 (Mann-Whitney U test). D, For each mouse group, tumor sizes are separated into three categories. Statistical analyses are based on two categories (Large; Medium+Small). For WT vs Null, P = 0.001; For Het vs Null, P = 0.009 (Fisher exact test).
Table 1.
Histological analysis of skin tumors at 20 weeks
| CD151 genotypes | +/+ | +/− | −/− |
|---|---|---|---|
| Number of mice | 19 | 32 | 20 |
| Total tumors | 235 | 306 | 66 |
| Benign tumors | 220 | 299 | 66 |
| SCC tumors | 15 | 7 | 0 |
| SCC tumors/total tumors | 6.4% | 2.3% | 0% |
| aP (+/+ vs. +/−, −/−) | -- | 0.026 | 0.048 |
| aP (+/− vs. −/−) | -- | -- | 0.61 |
Fisher’s exact test
CD151 contributions during tumor initiation and promotion stages
Before treatment, +/+ and −/− mouse skin differed minimally in apoptosis (seen by caspase staining of epidermis; Figs. 3A,B), epidermal proliferation (Fig. 4C,D), and epidermal STAT3 activation (Figs 5C,D). Also, morphology and epidermal thickness was essentially identical, as seen in H&E stained cross-sections of dermis and epidermis (Fig. 4A). In addition, untreated +/+ and −/− primary keratinocytes showed essentially identical background apoptosis (Fig. 3C).
Figure 3.

DMBA-induced apoptosis in CD151 deficient mice. A, Representative active caspase-3 staining of epidermis from (a) untreated +/+, (b) +/+ mice with DMBA, (c) untreated −/−, and (d) −/− mice with DMBA. Caspase-3 positive cells appear in both hair follicle bulge regions (arrows) and interfollicular epidermis (arrowhead); Bar = 50 um. B, Quantitation of caspase-3 positive cells per unit area from data as in panel A. Shown are means ± SEM, n = 5; *, P < 0.001. C, Quantitation of keratinocyte apoptosis, after 4 hr of chemical treatment, based on accumulation of cytoplasmic histone-associated DNA fragments (see "Materials and methods"). Shown are means ± SEM, n = 5; *, P < 0.005; **, P < 0.006 (students t test)
Figure 4.

TPA-induced epidermal proliferation. A, Mice (n = 5 per group) were treated with TPA and sacrificed 24 hrs after the last treatment. BrdU was injected 2 hr prior to sacrifice. H&E staining of epidermis from (a) untreated +/+, (b) +/+ treated with TPA, (c) untreated −/−, and (d) −/− mice treated with TPA. Bar = 50 um. B, Quantitation of epidermal thickness from wild type (black bar) and CD151 null mice (white bar). n = 5; *, P < 0.02. C, Immunohistochemical analysis of proliferation marker BrdU in dorsal skin after TPA treatment. D, Quantitation of BrdU positive cells in the epidermis of wild type (black bar) and CD151 null mice (white bar) after treatment with TPA. n = 5; *, P < 0.001
Figure 5.

CD151 influences STAT3 activation. A, Mouse derived skin cell lines were lysed in 1% Triton X-100, and blotted for pSTAT3 (Tyr705, mAb from Cell Signaling Co.), total STAT3 (rabbit polyclonal Ab, Santa Cruz Co.), and β actin. B, CD151 was stably ablated in human A431 cells. Knockdown and control cells were treated with TPA (50 ng/ml) for indicated times, lysed, and then blotted as in part A. CD151 was detected using mAb 1A5. CD151 knockdown was >90% (bottom panel). Bar graphs, based on densitometry scans, show relative STAT3 activation C, Epidermis from +/+ and −/− mice was isolated 24 hr following DMBA treatment, and lysate proteins were blotted for activated STAT3, total STAT3 and β actin. Bar graphs show relative STAT3 activation. N = 5; *, P < 0.01. D, Epidermis from +/+ and −/− mice was isolated 24 hr following the last TPA treatment, and lysate proteins were blotted for activated STAT3, total STAT3 and β actin. Bar graphs show relative STAT3 activation. N = 5; *, P<0.02
To determine CD151 effects on keratinocytes during tumor initiation, we treated mouse skin with DMBA alone, and then intact skin sections were assessed for apoptosis by caspase 3 staining. DMBA treatment stimulated more keratinocyte apoptosis in CD151 null mice (Figs. 3A, 3B). Cultured CD151-null keratinocytes also showed increased DMBA-induced apoptosis (Fig. 3C). Another type of DNA-damaging agent, camptothecin, also increased apoptosis in CD151-null keratinocytes (Fig. 3C). Thus, CD151−/− keratinocytes appear sensitized to chemical stress.
To study tumor promotion, mice were treated 4 times with TPA, over 2 weeks, without prior DMBA treatment. Epidermal thickness increased to a lesser extent in CD151−/− mice (Figs. 4A,B). Likewise, CD151−/− mice incorporated 45% less bromodeoxyuridine (BrdU) (Figs. C,D). Thus, reduced tumor development in CD151-null skin may arise from changes in both DMBA-induced apoptosis and TPA-induced proliferation.
CD151 affects STAT3 activation
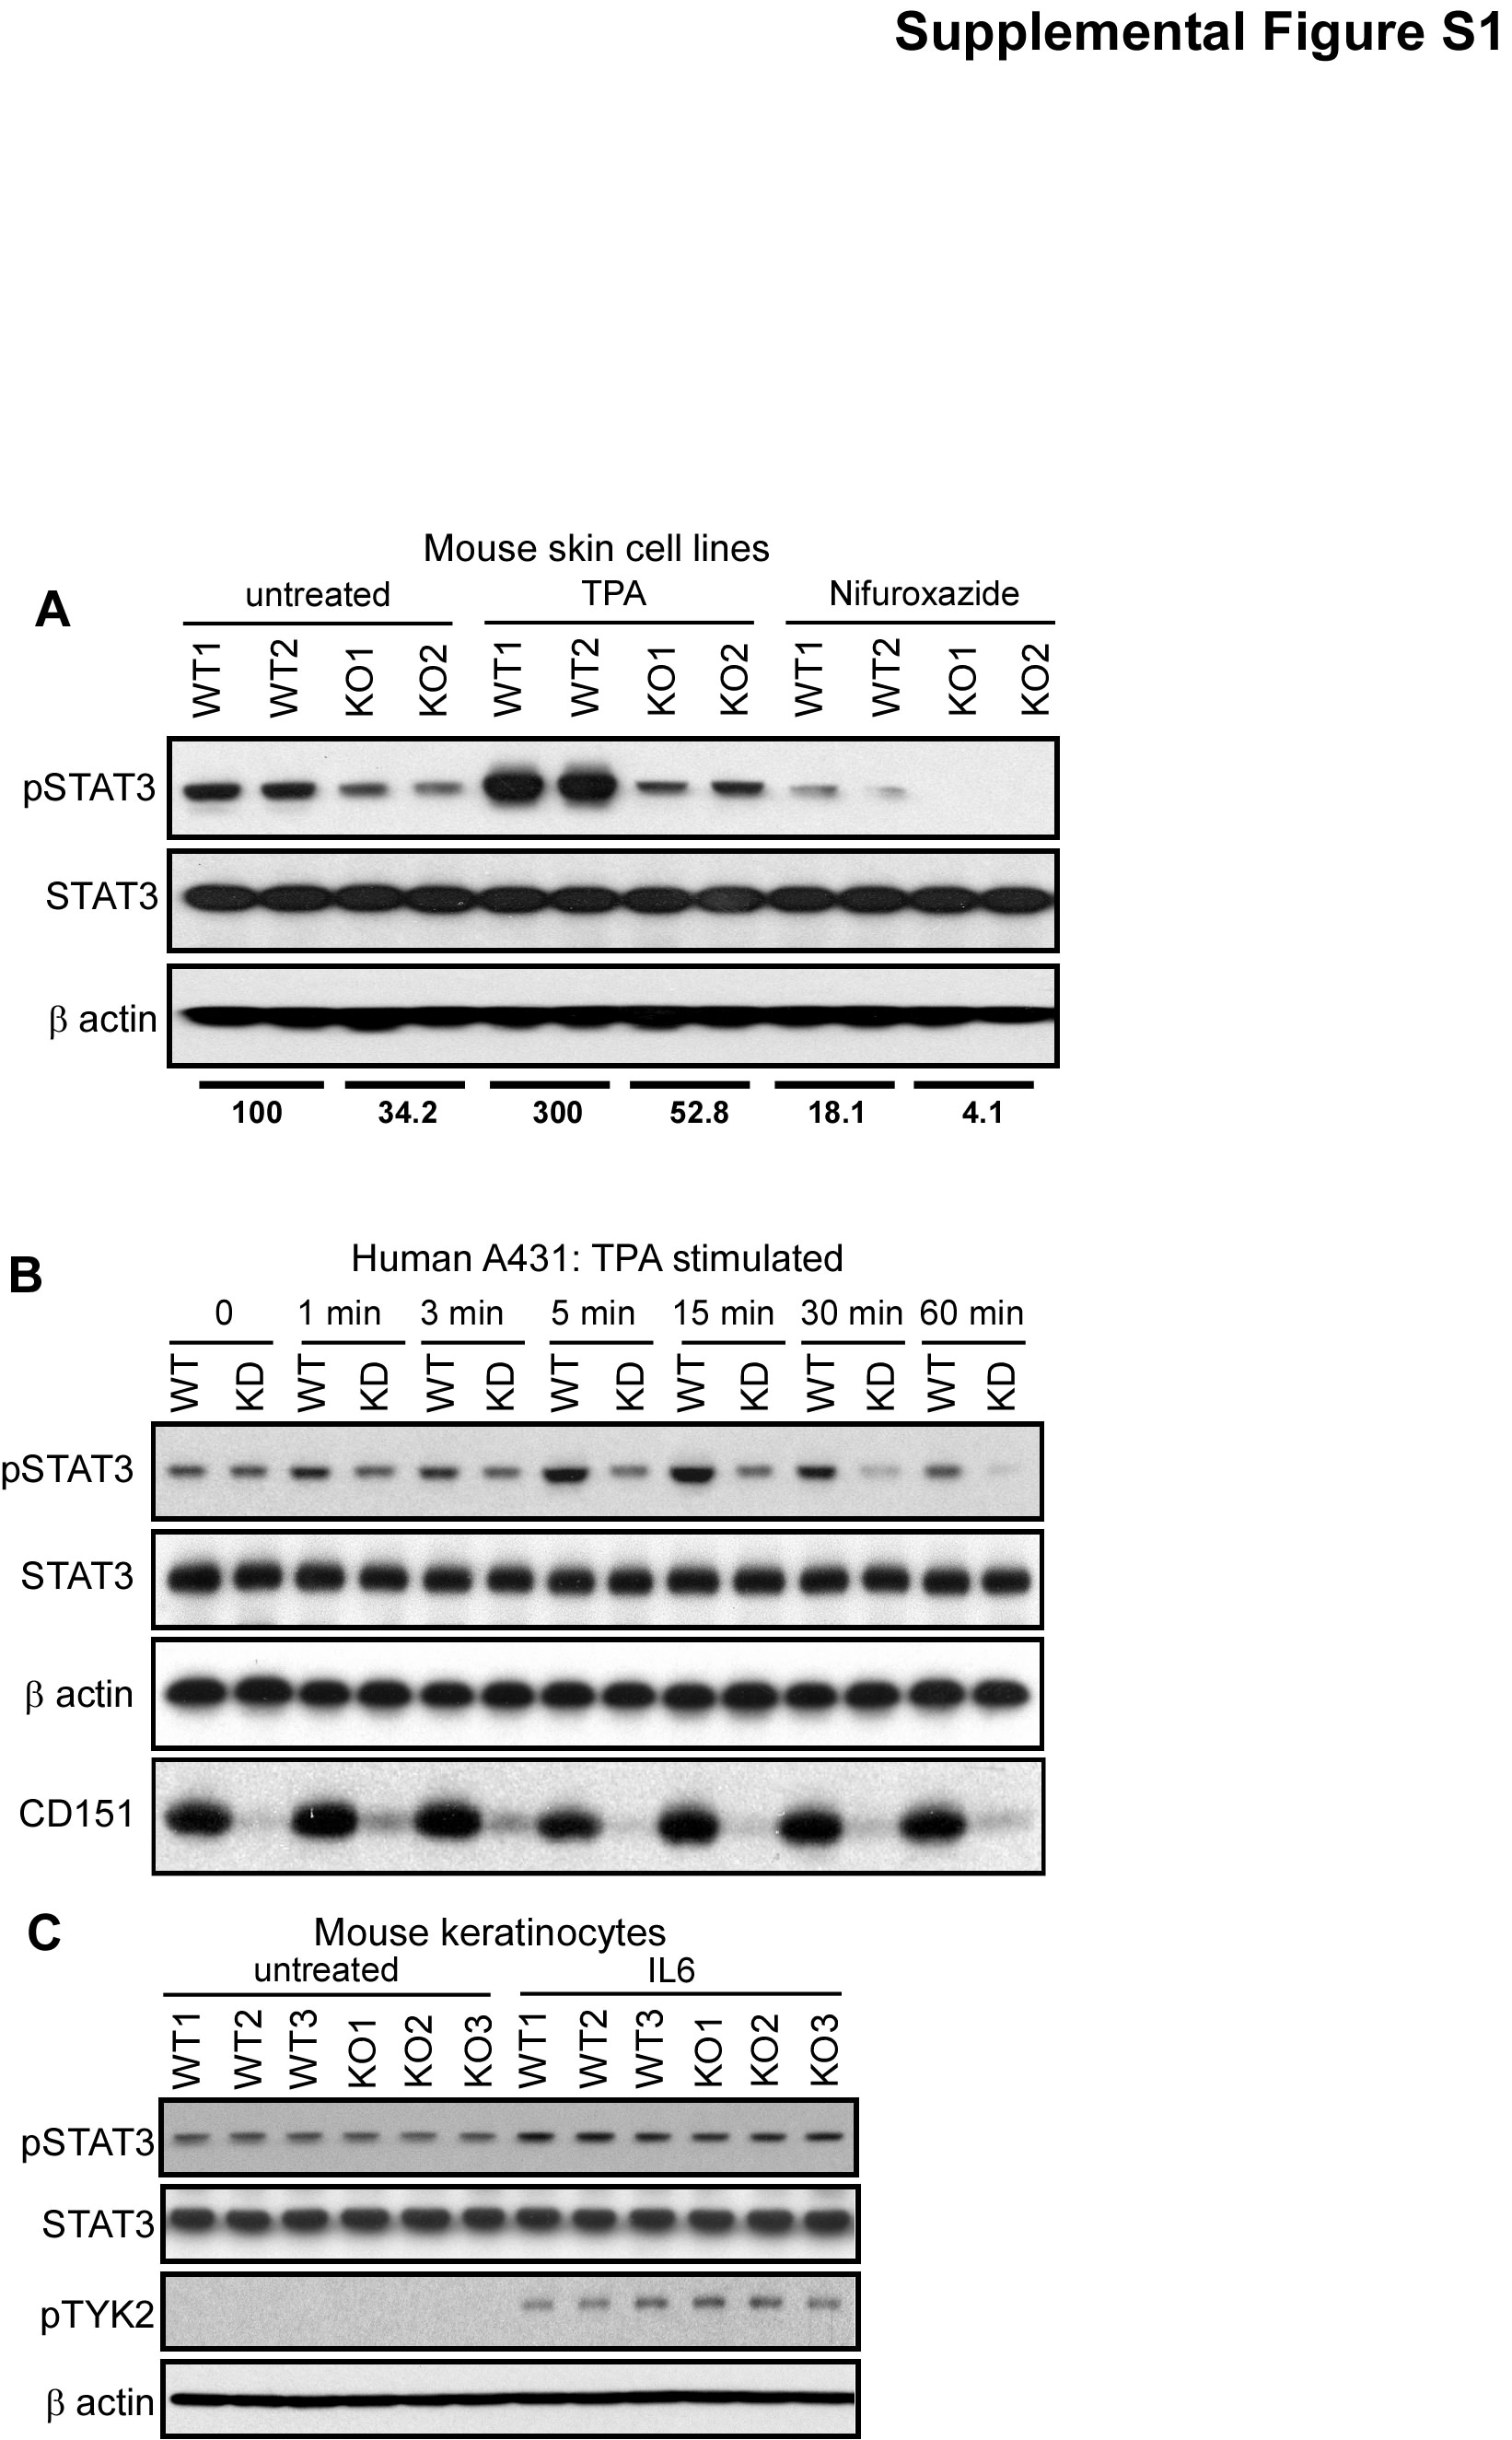
STAT3, a transcription factor constitutively active in many human malignancies (20), is essential for epidermal survival and proliferation during skin carcinogenesis leading to SCC (10; 11). Mouse skin cell lines derived from CD151−/− papillomas showed 40–60% less activated STAT3, while total STAT3 was unchanged (Fig. 5A). After 1 hr TPA stimulation, −/− skin cell lines also showed diminished increase in STAT3 activation (~1.5-fold, compared to 3-fold for +/+ cells) (Supp. Fig. S1A).
In unstimulated human A431 epidermoid carcinoma cells, CD151 knockdown minimally affected STAT3 activation (Fig. 5B, Supp. Fig. S1B). However CD151-ablated cells showed markedly less STAT3 activation after TPA 5–30 min stimulation, and showed almost complete STAT3 inactivation after 30–60 min. Total STAT3 levels were unchanged (Figs.5B, Supp. Fig. S1B). These results suggest a possible combination of diminished kinase and enhanced tyrosine phosphatase activities affecting STAT3 in CD151−/− cells.
Following treatment with DMBA alone (as in Fig. 3A), mouse skin samples were lysed and analyzed for STAT3 activation. Again, STAT3 was less activated in samples from CD151−/− mice (Fig. 5C), suggesting that loss of STAT3 activation contributes to increased apoptosis (Figs. 3A,B). After mouse skin treatment with TPA alone (as in Fig. 4), STAT3 activation substantially increased in CD151+/+, but not CD151−/− mouse samples (Fig. 5D). Thus, failure to increase STAT3 activation may contribute to diminished epidermal proliferation in CD151−/− skin. Presence or absence of CD151 minimally affected total STAT3 levels (Fig. 5C,D).
CD151-null cultured primary keratinocytes showed diminished proliferation (measured two different ways; Fig. 6A), likely due to diminished response to EGF in keratinocyte growth media. This difference disappeared upon cell treatment (for 2–3 days) with nifuroxazide, which inhibits Jak2 and Tyk2 kinases immediately upstream of STAT3 (38), consistent with CD151 functions depending on STAT3. Results in Fig. 6B confirm that nifuroxazide indeed inhibits STAT3 activation in both CD151-null and control cells.
Figure 6.

CD151 and STAT3 inhibition effects. A, Equal numbers of freshly isolated primary mouse keratinocytes were cultured ± 5 µM nifuroxazide. After 2 days, cell proliferation was assessed using the MTT assay, which measures metabolic energy (left panel) and after 3 days total cell numbers were counted (right panel). Bars represent mean +/− SD for 3 independent experiments. *, P<0.05; **, P<0.001. B, STAT3 activation (pSTAT3-Y705) is shown for primary mouse keratinocytes treated for 2 days with 5 µM nifuroxazide. C, CD151 knockdown and control A431 cells were treated with nifuroxazide (2 µM or 5 µM) for indicated times, lysed, and then pSTAT3 (Y705) and total STAT3 were blotted, and ratios were determined from densitometric quantitation of blot intensities. See blots in supplemental Fig. S2A. D, A431 cells ± CD151 were treated with lapatinib, and then blotted for pSTAT3, total STAT3, pEGFR, and CD151 as indicated. Densitometric quantitation showed CD151 ablation causing pSTAT3/STAT3 ratios to decrease by 0%, 64%, and 84% (with 0, 1, 5 µM lapatinib, respectively). E, A341 cells ± CD151 were treated with STAT3 inhibitor ST3-01 (36), and then STAT3 activity was determined as indicated in supplemental Fig. S2B.
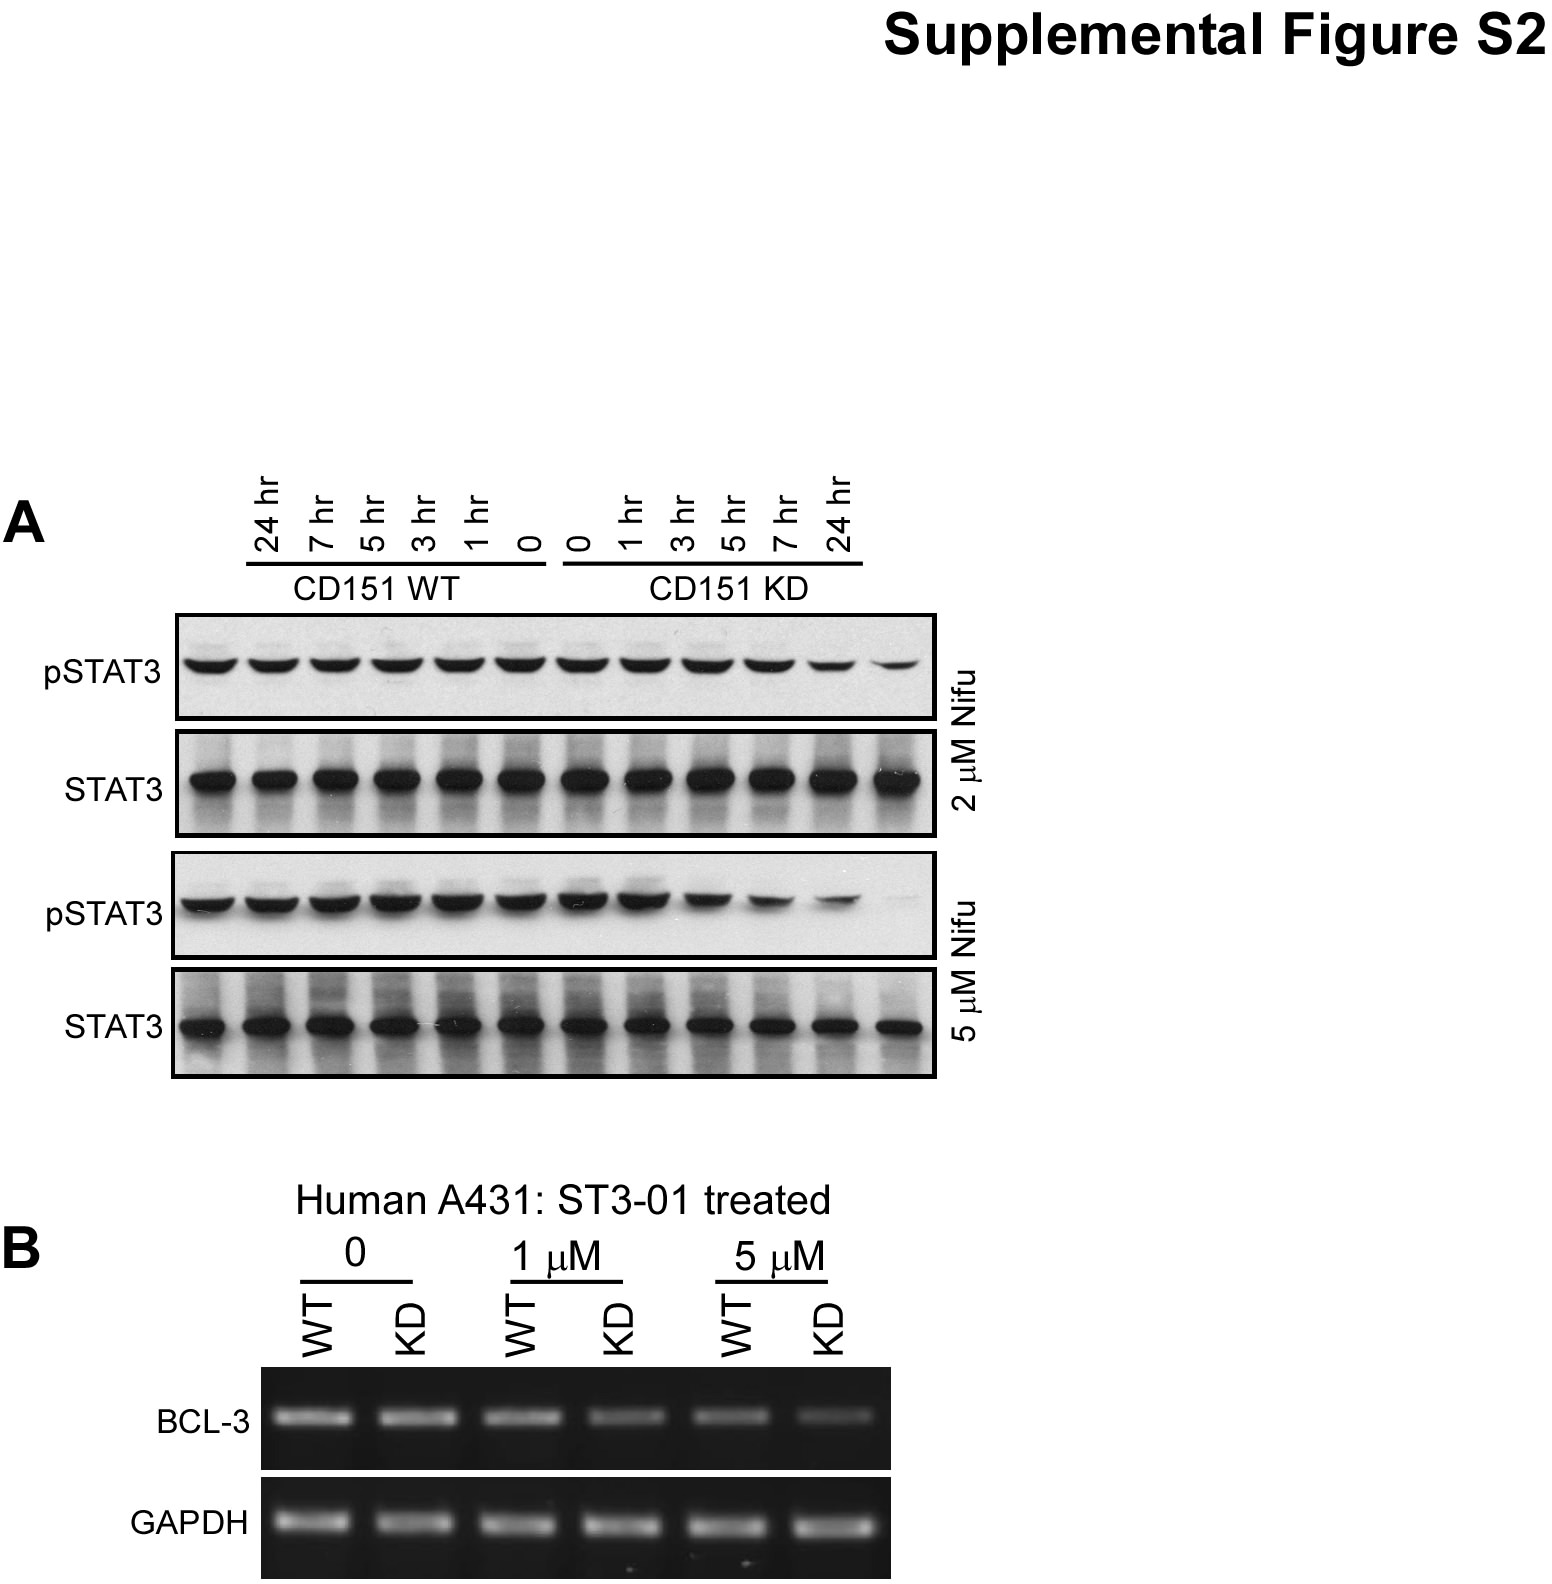
Next we found that CD151 affects the entire EGFR-Jak2/Tyk2-STAT3 signaling pathway, as evidenced by enhanced drug sensitivity in CD151-ablated cells, using a STAT3 activation readout. Indeed, in papilloma-derived mouse skin cell lines lacking CD151, potency of nifuroxazide inhibition of STAT3 activation was enhanced (Supp. Fig. S1A). To explore this further, we analyzed STAT3 activation in A431 cells. In untreated cells, CD151 ablation minimally affected STAT3 activation. However, CD151 absence markedly enhanced sensitivity to nifuroxazide. STAT3 activation in control A431 cells was relatively unaffected by 2–5 µM nifuroxazide (Fig. 6C, supplemental Fig.S2A). By contrast, CD151-ablated cells were sensitized, showing markedly diminished STAT3 activation, especially 5 hr after treatment at the higher nifuroxazide dose. Using EGFR inhibitor lapatinib (69), we again saw CD151 ablation increasing drug sensitivity, resulting in greater loss of constitutive STAT3 activation (Fig. 6D, top panel, lanes 4, 6). Total STAT3 levels were unaffected (2nd panel). Although EGFR activation decreased with higher lapatinib doses, this was unaffected by CD151 (Fig. 6D, 3rd panel). A direct inhibitor of STAT3, ST3-01 (36), again preferentially inhibited STAT3 activation in A431 cells lacking CD151 (Fig. 6E, supplemental Fig. S2B).
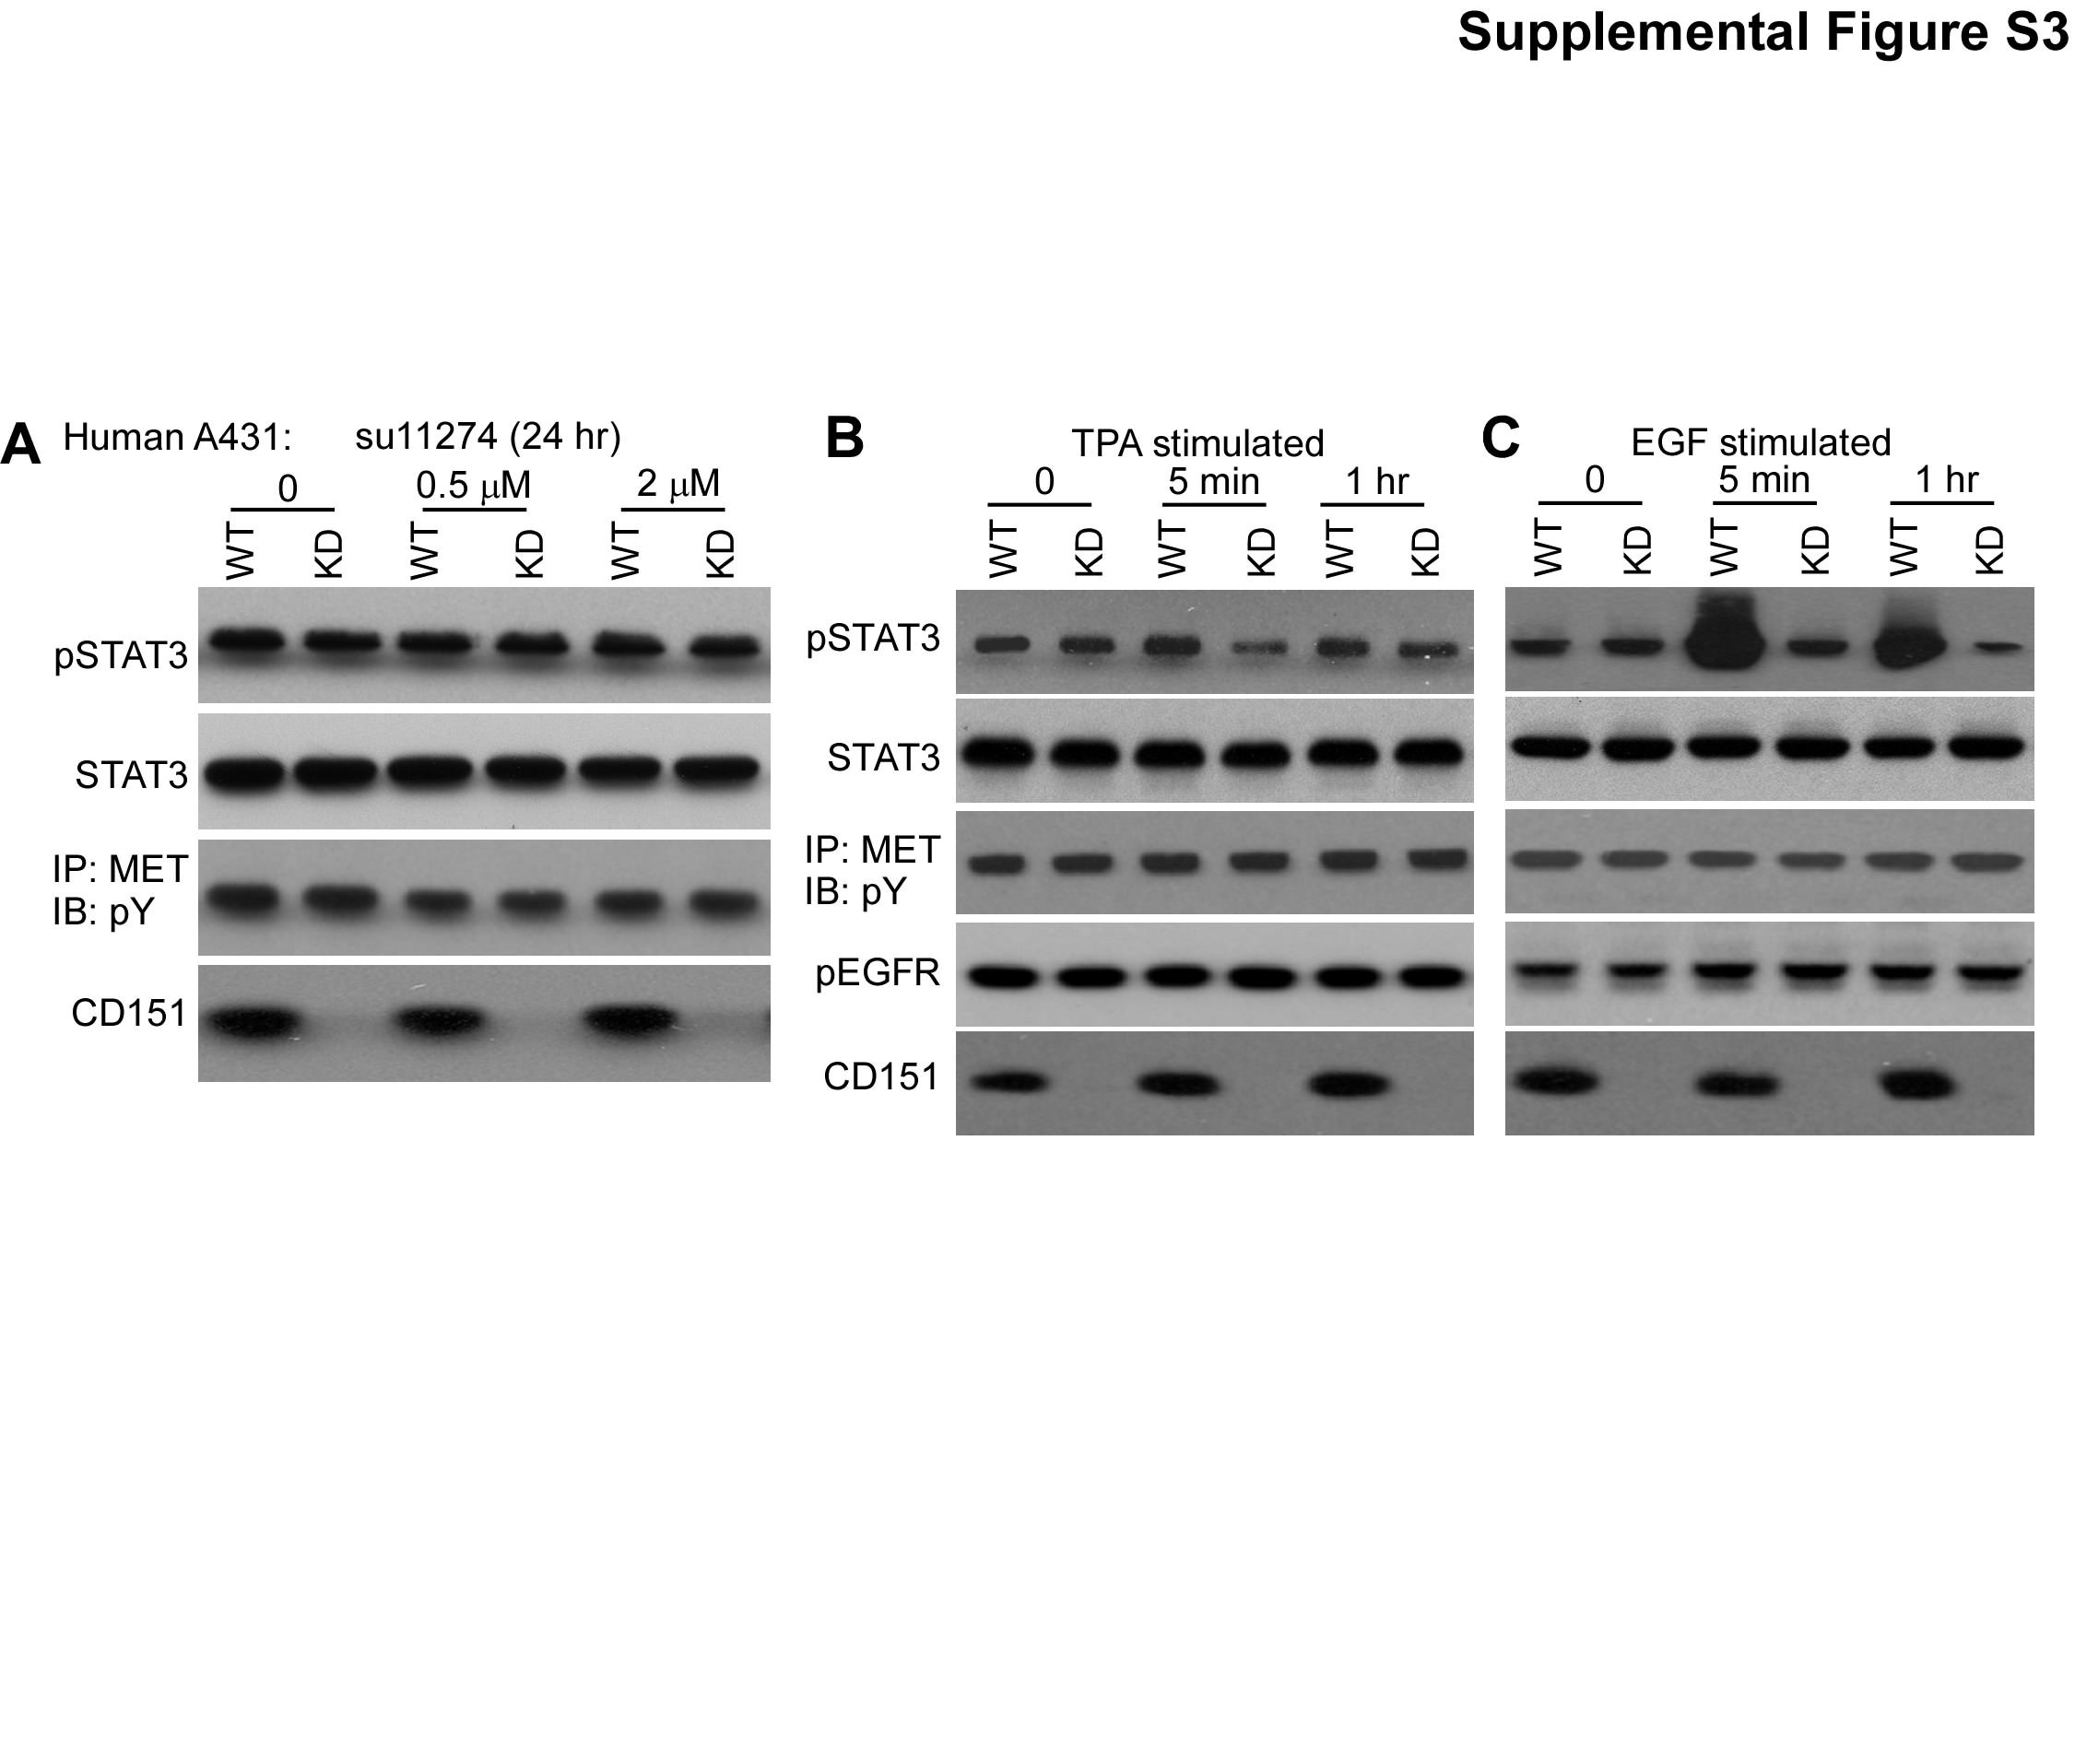
CD151 has been suggested to affect c-MET signaling, β4 integrin collaboration, and support of tumor xenograft growth (19), and c-MET may signal through STAT3 (56). However, using c-MET inhibitor su11274 (46), we did not see altered STAT3 activation ±CD151 ablation (supplemental Fig. S3A). A consistent 25–30% decrease in c-MET activation affirms that su11274 is functional (Fig. S3A, 3rd panel). Furthermore, diminished stimulation of STAT3 activation in CD151-ablated cells (supplemental Figs. S3B,C, top panels) was not accompanied by altered c-MET activation (supplemental Figs. S3B,C, 3rd panels).
CD151 affects β4 integrin phosphorylation
Among laminin-binding integrins, α6β4 makes critical contributions during skin cancer progression to SCC (31; 42; 60). CD151 affects subcellular distribution of tumor cell α6β4 (73). Indeed, within CD151−/− skin tumor cells, β4 integrin was considerably more punctate and/or distributed towards the cell periphery. By contrast, CD151+/+ cell β4 was distributed more diffusely (Fig. 7A). Also, CD151−/− cells were less well spread, and less tightly clustered (Fig. 7A). Similarly, cultured primary CD151−/− keratinocyte β4 was more distributed to the cell periphery (Fig. 7B).
Figure 7.

CD151 affects β4 distribution and phosphorylation. A, Mouse tumor-derived cell lines were permeabilized and stained for integrin β4. B, Keratinocytes were isolated from wild type and null mice and then cultured for a few weeks before integrin β4 subunit staining. Bar = 5 µm. (A, B) Linear staining intensity, across the diameter of representative cells, was measured using the Image J program (from NIH). C, Human A431 cells, stably ablated for CD151, were treated with TPA (50ng/ml) or EGF (100ng/ml) for 5 min and 1 hr, and then blotted for the indicated proteins, using antibodies for β4-S1424, β4-S1356, and total β4.
During keratinocyte carcinogenesis, EGF/TPA stimulates β4 serine phosphorylation at key sites, including S1424 (22) and S1356 (31; 66). This enables β4 dissociation from the intermediate filament cytoskeleton, as hemidesmosomes are disrupted and epithelial cells lose polarity while becoming more invasive (22; 31; 66). Reagents were unavailable for analyzing mouse serine site-specific β4 phosphorylation. However in CD151-ablated human A431 cells, S1424 phosphorylation was notably impaired in response to TPA (38% of WT) or EGF (51% of WT) (Fig. 7C). By contrast, β4 S1356 phosphorylation was similarly stimulated by TPA and EGF regardless of CD151 presence (Figure 7C, second row).
CD151 affects conventional PKC (cPKC) location and function
Phosphorylation of β4 at S1424 (22), but not S1356 (21) requires conventional PKC (cPKC) isoforms. Integrin β4 in A431 cells co-immunoprecipitated with a cPKC isoform (PKCα) after cell stimulation with phorbol ester or EGF for 5–60 min. However, PKCα-α6β4 association was markedly diminished (especially 5 min after TPA or EGF stimulation) if CD151 was ablated, even though equal amounts of β4 and PKCα were retained (Figure 8A). These results are consistent with CD151 linking PKCα to α6β4. We also addressed cPKC effects on STAT3 activation. As indicated (Fig. 8B), cPKC inhibitor Go6976 markedly inhibited STAT3 activation in CD151-ablated A431 cells, but not in control cells. The PKC inhibitor did not affect total levels of STAT3 and PKCα.
Figure 8.

CD151 affects cPKC localization and function. A, A431 cells were stimulated with TPA (50ng/ml) or EGF (5 min and 1 hr), and then lysed in 1% Brij 56 detergent. PKCα and integrin β4 were immunoprecipitated (IP), followed by immunoblotting (IB) with antibodies to β4 and PKCα as indicated. WCL = whole cell lysates. *Numbers below the right panel represent mean density values for PKCα (associated with β4) from three independent experiments, including the one shown in the top right panel. B, A431 cells were stimulated with cPKC inhibitor Go 6976 for 2 hr, and then cells were lysed and blotted for pSTAT3, total STAT3, total PKC and CD151.
Possible indirect effects of CD151 on skin tumor formation
Since CD151 can support tumor angiogenesis (57), we considered that CD151 ablation may diminish chemical carcinogenesis due to decreased angiogenesis. However, mouse skin tumor microarray analyses revealed no decrease, in CD151 null tumors, in VEGF or CD31 expression (Supplemental Table 1). Furthermore, wild type and null tumor vessel densities did not differ.
Cytokines (e.g. IL-6, IL-12, IL-17, IL-23) play key roles in skin disease, SCC, and/or during STAT3 activation (15; 23; 28; 61; 62). However, levels of cytokines (IL-6, IL-12, IL-17, IL-23) in skin did not change upon CD151 ablation (Supplemental Table 2). Furthermore, CD151 ablation caused no decrease in IL-6-stimulated activation of TYK2 (Supplemental Fig. 1C), a major cytokine-responsive STAT3-activating kinase (47). Likewise, IL-6-induced STAT3 activation was undiminished in mouse keratinocytes lacking CD151 (Supplemental Fig. 1C). Hence, CD151 removal does not perturb major cytokine networks important for regulating STAT3 and skin carcinogenesis.
Discussion
Based on prior studies (see Introduction), it was unclear whether CD151 would positively or negatively affect de novo tumor formation. Here we show that during mouse chemical carcinogenesis CD151: reduced tumor lag time; promoted tumor incidence, multiplicity, size and progression to SCC; contributed to both tumor initiation and promotion stages; and markedly altered signaling through β4 integrin, EGFR, PKCα and STAT3.
CD151 and skin SCC
Although many epithelial tumor types upregulate CD151 (3; 43; 45; 64; 73), appearance on human skin SCC had not been reported. Tissue microarray data now show CD151 selectively upregulated in human skin SCC, but not other human skin tumors (basal cell carcinoma, metastatic melanoma, dermatofibrosarcoma protuberans). Laminin-binding integrins are not known to play major roles in those other skin cancers, which may explain lack of CD151 upregulation. Although CD151 trended towards elevated expression in higher grade skin SCC, patient prognosis data were unavailable. However CD151 associates with poor patient prognosis in breast cancer and other cancers (3; 43; 45; 64), and correlates with metastasis in esophageal SCC (19). CD151 is not only present, but also is a key contributor in the genesis of skin SCC, as seen using a mouse model that has previously yielded many results relevant to multistage genesis of human epithelial cancers, including skin SCC (1; 33).
CD151 effects during the tumor initiation stage
Absence of CD151 markedly enhanced apoptosis induced by DMBA (during carcinogenesis initiation) and by camptothecin (a chemotherapeutic agent). Thus, CD151 absence has a general sensitizing effect to different types of chemical agents. CD151 acts by modulating functions of laminin-binding integrins, including α6β4, which plays a particularly important role during skin SCC pathogenesis (42; 60). CD151 can affect α6 distribution (73), adhesion strengthening (35), diffusion mode (58), and sometimes cell adhesion (67). On CD151-null cultured mouse keratinocytes and tumor-derived cells, α6β4 became less diffusely distributed, while showing more punctate and/or peripheral staining. Changes in molecular organization of α6β4, possibly coupled with altered laminin adhesion, likely contribute to chemical sensitization. In this regard, integrins, including laminin-binding integrins (49; 71), support cell resistance to a variety of drugs/chemicals.
Increased DMBA-induced apoptosis in CD151-null keratinocytes was accompanied by decreased STAT3 activation. This result helps explain reduced CD151-null skin tumor formation, because STAT3 activation plays a major role during chemical carcinogenesis initiation (11). Decreased STAT3 activation accompanies decreased resistance to multiple types of cellular stresses (17). In this regard, CD151 removal enhanced sensitivity to DMBA (a mutagen), camptothecin (an inducer of DNA fragmentation), and to STAT3 pathway inhibitors, thus indicating general chemical stress sensitization. Decreased STAT3 activity in keratinocytes might arise not only from decreased activation, but also from enhanced de-activation, due to phosphatases (34), which would be consistent with our results.
CD151 and tumor promotion
Mice (and cells) lacking CD151 showed major decreases in TPA-induced epidermal hyperplasia, epidermal cell proliferation and STAT3 activation, thus further explaining diminished tumor yield during 2-stage carcinogenesis. Mouse skin TPA responses require a functioning EGFR (9). Integrin α6β4 may associate physically and/or functionally with the EGFR (37), with CD151 also supporting EGFR functions (73). In this regard, CD151 ablation diminished β4 phosphorylation responses to both TPA and EGF (Fig. 7C). Hence EGFR disruption, due to CD151 removal, may explain diminished TPA responses.
SCC tumor promotion during chemical carcinogenesis requires STAT3 activation (11). Thus, impaired TPA-induced STAT3 activation (and/or enhanced TPA-induced STAT3 inactivation) may be central to diminished tumor promotion and skin tumor formation in CD151-null mice. Because the EGFR makes major contributions to STAT3 activation during tumor promotion (9), loss of CD151-integrin regulation of the EGFR should contribute to diminished STAT3 activation. Disrupted recruitment of PKCα also likely contributes to diminished TPA induction of STAT3 activation in CD151-ablated cells (next section).
CD151 and tumor progression
CD151-null mice did not progress to SCC. Since activated STAT3 promotes malignant progression during chemical carcinogenesis (10), reduced STAT3 activation likely underlies absence of CD151-null tumor progression. SCC may arise from keratinocyte stem cells (29), implying that stem cell oncogenesis could be deficient in CD151-null mice. Since α6 integrins serve as keratinocyte stem cell markers (59), CD151 is well positioned to possibly contribute to stem cell oncogenesis.
CD151 effects on PKCα
Besides disrupting α6β4-EGFR collaborations, CD151 ablation also impairs α6β4-PKC connections. TPA stimulation activates conventional PKC (cPKC) isoforms, such as PKCα in skin (25). Hence, PKCα dysregulation could underlie deficient TPA stimulation in absence of CD151. TPA (and EGF) stimulate PKCα-dependent phosphorylation of β4 at S1424 (22). Phosphorylation of β4 S1424 (and three other serines) contributes to β4 dissociation from intermediate filament (IF) hemidesmosomes (HD’s), while switching to an actin-connected invasive state (31; 40; 66). Hence, diminished S1424 phosphorylation, due to CD151 absence, is consistent with maintenance of α6β4 in a more IF-anchored state, less susceptible to epithelial disruption and less likely to increase invasion. Shifting of β4 in keratinocytes and mouse tumor lines towards a peripheral/punctate staining pattern appears consistent with diminished HD association. Unfortunately, antibody specific for mouse β4 S1424 was not available to confirm expected loss of S1424 phosphorylation in mouse cells.
Phosphorylation of β4 at S1356, which is independent of cPKC isoforms (21), was unaffected by CD151 absence, thus emphasizing selective CD151 support for PKCα function. Only when CD151 was present did we observe TPA stimulation of PKCα association with α6β4, thus supporting a role for CD151 in recruiting PKCα into proximity with α6β4. Previously CD151 was shown to recruit, upon TPA stimulation, conventional PKC isoform PKCβII into proximity with laminin-binding integrins (76). Selective loss of PKCα recruitment to α6 integrins could explain not only diminished β4 S1424 phosphorylation, but also other impaired TPA-stimulated functions (i.e. epidermal proliferation and STAT3 activation – see Fig. 9).
Figure 9.

Scheme for CD151 contributions to chemical carcinogenesis in skin. Stimulation of epidermoid cells by EGF and TPA, through EGFR and PKCα, are enhanced when CD151 is present. Signaling is weakened when CD151 is absent, as evidenced by increased potency of agents inhibiting EGFR, PKCα, JAK2/TYK2, and STAT3. CD151 recruits PKC into proximity with β4 integrin. The β4 cytoplasmic tail has previously been linked to JAK2-STAT3 activation (24). It remains to be determined the extent to which CD151- and PKCα-dependent β4 S1424 phosphorylation directly contributes to STAT3 activation and skin oncogenesis. Results obtained here support previously demonstrated links of STAT3 to skin tumor initiation, promotion, and progression (10; 11).
CD151 and STAT3
CD151 had not previously been linked to STAT3 signaling. Integrin α6β4 may signal through STAT3 in ErBB2-driven breast cancer cells, but this did not involve proliferation or apoptosis (24). Hence, our results uncover a new link between CD151-α6β4 complexes and STAT3 signaling during the tumor initiation and promotion stages.
Several findings point to CD151 acting through STAT3 during skin tumor formation. First, activated STAT3 is essential for tumor progression in the DMBA/TPA model (10). Hence, decreased STAT3 activation, due to CD151 removal, must affect tumor progression. Second, inhibition of STAT3 eliminated CD151 effects on proliferation (see Fig. 6A), thus linking CD151 functions to STAT3. Third, STAT3 is required for skin tumor initiation and tumor promotion (11). Therefore, diminished STAT3 activation caused by CD151 absence can explain contributions of CD151 during tumor initiation and tumor promotion stages.
Are CD151 effects ‘keratinocyte-specific’?
CD151 effects on skin tumor formation appear to be largely ‘keratinocyte-specific’. Decades of research show skin chemical carcinogenesis initiation and promotion occur entirely through keratinocyte mutation and selection (1; 33). Furthermore, CD151 ablation from purified epidermoid cell populations definitively alters cell survival, proliferation, STAT3 activation, STAT3 drug sensitivity, integrin β4 distribution and phosphorylation, and β4-PKC association (consistent with altered TPA response).
We considered that CD151 on other cell types might affect skin tumor formation by altering angiogenesis (57), immune cell functions (50), or cytokines that activate STAT3 (15; 23; 28; 61; 62). However, key cytokine levels in skin were unchanged, and evidence obtained thus far does not support altered angiogenesis. In this regard, implanted melanoma cells did not show altered angiogenesis when CD151 was absent from the host (57, 58). Furthermore, immune cells in CD151-ablated tumor-bearing mice were unaltered with respect to tumor infiltration, subset sizes, activation, or trafficking (58). In conclusion, available data point to keratinocyte CD151 as being largely responsible for supporting chemical carcinogenesis.
Summary and broader implications
CD151 absence had no detectable effect on normal mouse skin morphology or histology, as seen previously (44; 68) and confirmed here. However, CD151 absence markedly diminished cell survival during tumor initiation, proliferation during the promotion phase, and progression to SCC. A pattern has emerged in which CD151 may be dispensable for normal physiologic processes, while contributing to pathologic events. For example, CD151 is unnecessary for normal development of blood vessels and skin in C57Bl6 mice (57; 68), but plays a critical role during pathologic events such as tumor angiogenesis (57), skin wound healing (13), and skin tumor formation (shown here). Because CD151 effects are more obvious in pathological situations, CD151 prospects as a tumor target are enhanced.
Neoplastic transformation in many cell types is supported by activated STAT3 (20) and by α6 integrins (e.g. (24)), which invariably associate with CD151. Hence, CD151 should contribute to de novo tumor formation, progression and STAT3 activation in many other epithelial cancers. CD151 contributions to a) cell survival during tumor initiation, b) cell proliferation during tumor promotion, and c) tumor progression, represent major additions to the growing list of CD151 cancer roles, during angiogenesis (57), tumor metastasis (77), tumor xenograft growth (45; 73), and on stem-like prostate tumor initiating cells (41). Consequently, targeting CD151 should have multi-pronged anti-cancer effects. Also, because CD151 removal sensitizes tumor cells to agents targeting EGFR/ErbB2, STAT3, and PKCα, co-targeting of CD151 may enhance effectiveness of other agents directed at α6 integrins and associated signaling pathways.
Materials and Methods
Human tissue arrays
Paraffin sections containing 106 human skin tissue samples (SK483 and BC21011, US Biomax, Rockville, MD) were stained with anti-CD151 (clone RLM30) by Brigham and Women’s Hospital Histopathology Core. CD151 expression score (0–4) combines %CD151-positive tumor area and graded positive area intensity, each determined by blind visual inspection.
Cells, antibodies, chemicals and shRNA
A431 cells were maintained in DMEM, 10% fetal calf serum, at 37°C in humidified 5% CO2. Mouse tumor-derived cell lines were cultured in DMEM/F12, containing 5% fetal calf serum, 5µg/ml insulin, 100ng/ml Cholera toxin, 10mM HEPES, 1µg/ml Hydrocortisone and 10ng/ml Epidermal Growth Factor. Anti-β-actin was from Sigma-Aldrich (St. Louis, MO), anti-STAT3 and anti-PKCα were from Santa Cruz Biotechnology (Santa Cruz, CA), and anti-pSTAT3(Tyr705) was from Cell signaling technologies (Beverly, MA). Monoclonal antibodies to CD151 were 5C11 (74), 1A5 (gift from A. Zijlstra), and RLM30 (Novacostra Co). Anti-phospho-EGFR (to activated EGFR) was from BD Biosciences, anti-c-MET was from Santa Cruz, and anti-pTyr antibody was from Millipore. Monoclonal and polyclonal anti-integrin β4 were from Chemicon, and polyclonal anti-β4 S1356, and β4 S1424 were described (22; 31). DMBA (7,12-dimethylbenz[α]anthracene), BrdU, camptothecin and TPA (12-O-tetradecanoylphorbol-13-acetate) were from Sigma-Aldrich. Nifuroxazide (38) and ST3-01 (also called ML116)(36) were from Dr. DA Frank, Dana-Farber Institute. Lapatinib was from LC Laboratories (Woburn, MA), and SU11274 was from Sigma Aldrich. CD151 was stably ablated from A431 cells as described (67). CD151-null cells were negatively selected by flow cytometry (using mAb 5C11). Knockdown efficiency was evaluated by flow cytometry and immunoblotting using mAb 1A5.
Skin carcinogenesis experiments and histologic examinations
CD151-null mice in Sv129 background (57), were crossed 4 generations onto FVB/N background, to increase chemical carcinogenesis sensitivity (27). CD151−/− mice were not further backcrossed into FVB/N to avoid kidney pathology complications (6). All mice used were viable, fertile, and lacked obvious defects in kidneys or elsewhere. Supplemental Fig. S4 shows representative diagnostic PCR image and primer sequences used for CD151 genotyping. For two-stage carcinogenesis, 7-week-old female mouse dorsal skin was shaved, and after one week treated once with DMBA (100 nmol in 0.2 ml acetone). After another week, mice were treated with TPA (8 nmol in 0.2 ml acetone) twice-weekly for 19 more weeks. Control mice were treated with 0.2 ml acetone for 20 weeks. Mice were examined weekly. Growths >1 mm diameter, persisting for ≥2 weeks, were recorded as tumors.
For “initiation only” experiments, mice were treated on dorsal skin once (DMBA, 100 nmol) or with acetone alone and sacrificed after 24 hrs. To assess apoptosis, skin sections were stained with anti-active caspase-3 (R&D Systems Inc.) followed by biotinylated anti-rabbit IgG and HRP-conjugated ABC reagent (Vector Laboratories Inc.). For “promotion only” experiments, 8-week-old female mice were treated twice weekly for two weeks with TPA (8 nmol) or acetone vehicle and sacrificed after another 24 hours. Some mice were injected intraperitoneally with BrdU (2 mg/mouse) in PBS 2 hr prior to sacrifice. Dorsal skin was formalin-fixed, paraffin-embedded, sectioned at 4 µm, stained with H&E and anti-BrdU antibody (BD Biosciences-Pharmingen), and then with biotinylated anti-mouse IgG and HRP-conjugated ABC reagent (Vector Laboratories Inc.). H&E stained skin thickness was measured by micrometer. To determine epidermal cell proliferation, BrdU-positive cells were counted, per unit area. Paraffin sectioning and H&E and immunohistochemical staining were performed by Harvard Medical School Histology Core. All treatments were approved by Dana-Farber Animal Care Committee and followed NIH guidelines.
In vitro tumor and keratinocyte cultures
To establish mouse tumor lines, specimens were collected (after 20 weeks DMBA/TPA treatment), minced, and resuspended in collagenase (Worthington Biochemical Corporation, CLS3 type; 200 U/ml) in Medium-199 plus gentamycin (5µg/ml). After 4 hr at 37°C, suspended cells were cultured in DMEM/F12 medium.
Mouse primary keratinocytes were isolated and cultured as described (16). Briefly, newborn mouse skin specimens were trypsinized (0.25% trypsin, Invitrogen) for 8–10 hr at 4°C, and epidermis was separated from dermis. Isolated keratinocytes were plated (60 cm dishes), precoated with collagen type I (BD Biosciences), and containing keratinocyte medium (EMEM; Fisher) supplemented with 0.1 mM monoethanolamine, 0.1 mM phosphoryl ethanolamine, 0.5 µM hydrocortisone at 37°C in 5% CO2. After 5 hours unattached cells were removed by PBS washing, and attached cells were further cultured in media minus growth factors. Twenty-four hours later, DMBA (30 nM) was added. Apoptosis was determined using Cell Death Detection ELISA kit (Roche Molecular Biochemicals, Mannheim, Germany) and proliferation was determined using MTT assay (Roche), and by cell counting (Countless™ automated counter, Invitrogen).
Protein lysates preparation
Cell lines were lysed in 50 mM HEPES, 150 mM NaCl, 5mM MgCl2, 1% Triton X-100 and protease inhibitor cocktail. Excised mouse dorsal skin (2×2 cm2) was placed on ice-cold glass, epidermis was removed with a blade, and then tissue was lysed in buffer containing 50 mM Tris-HCl (pH 8.6), 1% NP-40, 0.25% Na-deoxycholate, 150 mM NaCl, 1 mM EDTA, 1 mM PMSF and protease inhibitor cocktail (Roche Diagnostics, Indianapolis, IN). After 10 min at 4°C, lysates were snap-frozen in liquid nitrogen, thawed, and centrifuged (14,000g, 15 min, 4°C). Supernatant was resolved on 8–12% SDS/polyacrylamide gels, prior to immunoblotting.
Immunofluorescence microscopy
For confocal analyses, cells on coverslips were stained with primary, then secondary antibody (Alexa 488 or Alexa 594–conjugated goat anti-mouse or anti-rat) alone or combined (Invitrogen, Eugene, OR). Cells were visualized using Leica SP5X laser-scanning confocal microscope (Leica Microsystems, Chicago, IL).
Supplementary Material
Acknowledgements
We thank Dr. R. Bronson for assistance with mouse histopathology, Dr. Julie Aldridge for assistance with statistical analyses, and Drs. David Frank, Sarah Walker and coworkers for nifuroxazide, ST3-01, assistance with STAT3 functional assay and helpful discussions. This work was supported by NIH grant CA42368 (to MEH), and a S.G. Komen Career Catalyst Award (to XHY).
Footnotes
Conflict of Interest
The authors declare no competing financial interests related to the work described.
Supplementary information is available at the Oncogene website.
Reference List
- 1.Abel EL, Angel JM, Kiguchi K, DiGiovanni J. Nat Protoc. 2009;4:1350–1362. doi: 10.1038/nprot.2009.120. [DOI] [PMC free article] [PubMed] [Google Scholar]
- 2.Alam M, Ratner D. N Engl J Med. 2001;344:975–983. doi: 10.1056/NEJM200103293441306. [DOI] [PubMed] [Google Scholar]
- 3.Ang J, Lijovic M, Ashman LK, Kan K, Frauman AG. Cancer Epidemiol Biomarkers Prev. 2004;13:1717–1721. [PubMed] [Google Scholar]
- 4.Bachelder RE, Ribick MJ, Marchetti A, Falcioni R, Soddu S, Davis KR, Mercurio AM. J Cell Biol. 1999;147:1063–1072. doi: 10.1083/jcb.147.5.1063. [DOI] [PMC free article] [PubMed] [Google Scholar]
- 5.Baldwin G, Novitskaya V, Sadej R, Pochec E, Litynska A, Hartmann C, Williams J, Ashman L, Eble JA, Berditchevski F. J Biol Chem. 2008;283:35445–35454. doi: 10.1074/jbc.M806394200. [DOI] [PubMed] [Google Scholar]
- 6.Baleato RM, Guthrie PL, Gubler MC, Ashman LK, Roselli S. Am J Pathol. 2008;173:927–937. doi: 10.2353/ajpath.2008.071149. [DOI] [PMC free article] [PubMed] [Google Scholar]
- 7.Belkin AM, Stepp MA. Microsc Res Tech. 2000;51:280–301. doi: 10.1002/1097-0029(20001101)51:3<280::AID-JEMT7>3.0.CO;2-O. [DOI] [PubMed] [Google Scholar]
- 8.Berditchevski F, Odintsova E. J Cell Biol. 1999;146:477–492. doi: 10.1083/jcb.146.2.477. [DOI] [PMC free article] [PubMed] [Google Scholar]
- 9.Chan KS, Carbajal S, Kiguchi K, Clifford J, Sano S, DiGiovanni J. Cancer Res. 2004;64:2382–2389. doi: 10.1158/0008-5472.can-03-3197. [DOI] [PubMed] [Google Scholar]
- 10.Chan KS, Sano S, Kataoka K, Abel E, Carbajal S, Beltran L, Clifford J, Peavey M, Shen J, DiGiovanni J. Oncogene. 2008;27:1087–1094. doi: 10.1038/sj.onc.1210726. [DOI] [PubMed] [Google Scholar]
- 11.Chan KS, Sano S, Kiguchi K, Anders J, Komazawa N, Takeda J, DiGiovanni J. J Clin Invest. 2004;114:720–728. doi: 10.1172/JCI21032. [DOI] [PMC free article] [PubMed] [Google Scholar]
- 12.Charrin S, Manie S, Billard M, Ashman L, Gerlier D, Boucheix C, Rubinstein E. Biochem Biophys Res Commun. 2003;304:107–112. doi: 10.1016/s0006-291x(03)00545-x. [DOI] [PubMed] [Google Scholar]
- 13.Cowin AJ, Adams D, Geary SM, Wright MD, Jones JC, Ashman LK. J Invest Dermatol. 2006;126:680–689. doi: 10.1038/sj.jid.5700142. [DOI] [PMC free article] [PubMed] [Google Scholar]
- 14.Dajee M, Lazarov M, Zhang JY, Cai T, Green CL, Russell AJ, Marinkovich MP, Tao S, Lin Q, Kubo Y, Khavari PA. Nature. 2003;421:639–643. doi: 10.1038/nature01283. [DOI] [PubMed] [Google Scholar]
- 15.de WJ, Souwer Y, van Beelen AJ, de GR, Muller FJ, Klaasse BH, Jorritsma T, Kapsenberg ML, de Jong EC, van Ham SM. Blood. 2011 doi: 10.1182/blood-2011-05-352682. [DOI] [PubMed] [Google Scholar]
- 16.Dlugosz AA, Glick AB, Tennenbaum T, Weinberg WC, Yuspa SH. Methods Enzymol. 1995;254:3–20. doi: 10.1016/0076-6879(95)54003-2. [DOI] [PubMed] [Google Scholar]
- 17.Dudley AC, Thomas D, Best J, Jenkins A. Cell Commun Signal. 2004;2:8. doi: 10.1186/1478-811X-2-8. [DOI] [PMC free article] [PubMed] [Google Scholar]
- 18.Fitter S, Sincock PM, Jolliffe CN, Ashman LK. Biochem J. 1999;338(Pt 1):61–70. [PMC free article] [PubMed] [Google Scholar]
- 19.Franco M, Muratori C, Corso S, Tenaglia E, Bertotti A, Capparuccia L, Trusolino L, Comoglio PM, Tamagnone L. J Biol Chem. 2010;285:38756–38764. doi: 10.1074/jbc.M110.145417. [DOI] [PMC free article] [PubMed] [Google Scholar]
- 20.Frank DA. Cancer Lett. 2007;251:199–210. doi: 10.1016/j.canlet.2006.10.017. [DOI] [PubMed] [Google Scholar]
- 21.Frijns E, Sachs N, Kreft M, Wilhelmsen K, Sonnenberg A. J Biol Chem. 2010;285:37650–37662. doi: 10.1074/jbc.M110.138818. [DOI] [PMC free article] [PubMed] [Google Scholar]
- 22.Germain EC, Santos TM, Rabinovitz I. Mol Biol Cell. 2009;20:56–67. doi: 10.1091/mbc.E08-06-0646. [DOI] [PMC free article] [PubMed] [Google Scholar]
- 23.Grivennikov SI, Karin M. Cytokine Growth Factor Rev. 2010;21:11–19. doi: 10.1016/j.cytogfr.2009.11.005. [DOI] [PMC free article] [PubMed] [Google Scholar]
- 24.Guo W, Pylayeva Y, Pepe A, Yoshioka T, Muller WJ, Inghirami G, Giancotti FG. Cell. 2006;126:489–502. doi: 10.1016/j.cell.2006.05.047. [DOI] [PubMed] [Google Scholar]
- 25.Hara T, Saito Y, Hirai T, Nakamura K, Nakao K, Katsuki M, Chida K. Cancer Res. 2005;65:7356–7362. doi: 10.1158/0008-5472.CAN-04-4241. [DOI] [PubMed] [Google Scholar]
- 26.Hemler ME. Nat Rev Mol Cell Biol. 2005;6:801–811. doi: 10.1038/nrm1736. [DOI] [PubMed] [Google Scholar]
- 27.Hennings H, Glick AB, Lowry DT, Krsmanovic LS, Sly LM, Yuspa SH. Carcinogenesis. 1993;14:2353–2358. doi: 10.1093/carcin/14.11.2353. [DOI] [PubMed] [Google Scholar]
- 28.Hirano T, Ishihara K, Hibi M. Oncogene. 2000;19:2548–2556. doi: 10.1038/sj.onc.1203551. [DOI] [PubMed] [Google Scholar]
- 29.Kangsamaksin T, Park HJ, Trempus CS, Morris RJ. Mol Carcinog. 2007;46:579–584. doi: 10.1002/mc.20355. [DOI] [PubMed] [Google Scholar]
- 30.Karamatic CV, Burton N, Kagan A, Green CA, Levene C, Flinter F, Brady LR, Daniels G, Anstee DJ. Blood. 2004;104:2217–2223. doi: 10.1182/blood-2004-04-1512. [DOI] [PubMed] [Google Scholar]
- 31.Kashyap T, Germain E, Roche M, Lyle S, Rabinovitz I. Lab Invest. 2011;91:1414–1426. doi: 10.1038/labinvest.2011.104. [DOI] [PMC free article] [PubMed] [Google Scholar]
- 32.Kazarov AR, Yang X, Stipp CS, Sehgal B, Hemler ME. J Cell Biol. 2002;158:1299–1309. doi: 10.1083/jcb.200204056. [DOI] [PMC free article] [PubMed] [Google Scholar]
- 33.Kemp CJ. Semin Cancer Biol. 2005;15:460–473. doi: 10.1016/j.semcancer.2005.06.003. [DOI] [PubMed] [Google Scholar]
- 34.Kim DJ, Tremblay ML, DiGiovanni J. PLoS ONE. 2010;5:e10290. doi: 10.1371/journal.pone.0010290. [DOI] [PMC free article] [PubMed] [Google Scholar]
- 35.Lammerding J, Kazarov AR, Huang H, Lee RT, Hemler ME. Proc Natl Acad Sci U S A. 2003;100:7616–7621. doi: 10.1073/pnas.1337546100. [DOI] [PMC free article] [PubMed] [Google Scholar]
- 36.Madoux F, Koenig M, Sessions H, Nelson E, Mercer BA, Cameron M, Roush W, Frank D, Hodder P. Probe Reports from the NIH Molecular Libraries Program [Internet]. Bethesda (MD): National Center for Biotechnology Information (US) 2010 [PubMed] [Google Scholar]
- 37.Mariotti A, Kedeshian PA, Dans M, Curatola AM, Gagnoux-Palacios L, Giancotti FG. J Cell Biol. 2001;155:447–458. doi: 10.1083/jcb.200105017. [DOI] [PMC free article] [PubMed] [Google Scholar]
- 38.Nelson EA, Walker SR, Kepich A, Gashin LB, Hideshima T, Ikeda H, Chauhan D, Anderson KC, Frank DA. Blood. 2008;112:5095–5102. doi: 10.1182/blood-2007-12-129718. [DOI] [PMC free article] [PubMed] [Google Scholar]
- 39.Owens DM, Watt FM. Cancer Res. 2001;61:5248–5254. [PubMed] [Google Scholar]
- 40.Rabinovitz I, Toker A, Mercurio AM. J Cell Biol. 1999;146:1147–1160. doi: 10.1083/jcb.146.5.1147. [DOI] [PMC free article] [PubMed] [Google Scholar]
- 41.Rajasekhar VK, Studer L, Gerald W, Socci ND, Scher HI. Nat Commun. 2011;2:162. doi: 10.1038/ncomms1159. [DOI] [PMC free article] [PubMed] [Google Scholar]
- 42.Raymond K, Kreft M, Song JY, Janssen H, Sonnenberg A. Mol Biol Cell. 2007;18:4210–4221. doi: 10.1091/mbc.E06-08-0720. [DOI] [PMC free article] [PubMed] [Google Scholar]
- 43.Romanska HM, Berditchevski F. J Pathol. 2011;223:4–14. doi: 10.1002/path.2779. [DOI] [PubMed] [Google Scholar]
- 44.Sachs N, Kreft M, van den Bergh Weerman MA, Beynon AJ, Peters TA, Weening JJ, Sonnenberg A. J Cell Biol. 2006;175:33–39. doi: 10.1083/jcb.200603073. [DOI] [PMC free article] [PubMed] [Google Scholar]
- 45.Sadej R, Romanska H, Baldwin G, Gkirtzimanaki K, Novitskaya V, Filer AD, Krcova Z, Kusinska R, Ehrmann J, Buckley CD, Kordek R, Potemski P, Eliopoulos AG, Lalani e, Berditchevski F. Mol Cancer Res. 2009;7:787–798. doi: 10.1158/1541-7786.MCR-08-0574. [DOI] [PubMed] [Google Scholar]
- 46.Sattler M, Pride YB, Ma P, Gramlich JL, Chu SC, Quinnan LA, Shirazian S, Liang C, Podar K, Christensen JG, Salgia R. Cancer Res. 2003;63:5462–5469. [PubMed] [Google Scholar]
- 47.Schindler C, Darnell JE., Jr Annu Rev Biochem. 1995;64:621–651. doi: 10.1146/annurev.bi.64.070195.003201. [DOI] [PubMed] [Google Scholar]
- 48.Serru V, Naour FL, Billard M, Azorsa DO, Lanza F, Boucheix C, Rubinstein E. Biochem J. 1999;340(Pt 1):103–111. [PMC free article] [PubMed] [Google Scholar]
- 49.Sethi T, Rintoul RC, Moore SM, MacKinnon AC, Salter D, Choo C, Chilvers ER, Dransfield I, Donnelly SC, Strieter R, Haslett C. Nat Med. 1999;5:662–668. doi: 10.1038/9511. [DOI] [PubMed] [Google Scholar]
- 50.Sheng KC, van Spriel AB, Gartlan KH, Sofi M, Apostolopoulos V, Ashman L, Wright MD. Eur J Immunol. 2009;39:50–55. doi: 10.1002/eji.200838798. [DOI] [PubMed] [Google Scholar]
- 51.Sincock PM, Fitter S, Parton RG, Berndt MC, Gamble JR, Ashman LK. J Cell Sci. 1999;112:833–844. doi: 10.1242/jcs.112.6.833. [DOI] [PubMed] [Google Scholar]
- 52.Sincock PM, Mayrohofer G, Ashman LK. J Histochem Cytochem. 1997;45:515–525. doi: 10.1177/002215549704500404. [DOI] [PubMed] [Google Scholar]
- 53.Sterk LM, Geuijen CA, Oomen LC, Calafat J, Janssen H, Sonnenberg A. J Cell Biol. 2000;149:969–982. doi: 10.1083/jcb.149.4.969. [DOI] [PMC free article] [PubMed] [Google Scholar]
- 54.Sterk LM, Geuijen CA, van Den Berg JG, Claessen N, Weening JJ, Sonnenberg A. J Cell Sci. 2002;115:1161–1173. doi: 10.1242/jcs.115.6.1161. [DOI] [PubMed] [Google Scholar]
- 55.Stipp CS. Expert Rev Mol Med. 2010;12:e3. doi: 10.1017/S1462399409001355. [DOI] [PMC free article] [PubMed] [Google Scholar]
- 56.Syed ZA, Yin W, Hughes K, Gill JN, Shi R, Clifford JL. BMC Cancer. 2011;11:180. doi: 10.1186/1471-2407-11-180. [DOI] [PMC free article] [PubMed] [Google Scholar]
- 57.Takeda Y, Kazarov AR, Butterfield CE, Hopkins BD, Benjamin LE, Kaipainen A, Hemler ME. Blood. 2007;109:1524–1532. doi: 10.1182/blood-2006-08-041970. [DOI] [PMC free article] [PubMed] [Google Scholar]
- 58.Takeda Y, Li Q, Kazarov AR, Epardaud M, Elpek K, Turley SJ, Hemler ME. Blood. 2011;118:464–472. doi: 10.1182/blood-2010-08-302240. [DOI] [PMC free article] [PubMed] [Google Scholar]
- 59.Tani H, Morris RJ, Kaur P. Proc Natl Acad Sci U S A. 2000;97:10960–10965. doi: 10.1073/pnas.97.20.10960. [DOI] [PMC free article] [PubMed] [Google Scholar]
- 60.Tennenbaum T, Weiner AK, Belanger AJ, Glick AB, Hennings H, Yuspa SH. Cancer Res. 1993;53:4803–4810. [PubMed] [Google Scholar]
- 61.Tokura Y, Mori T, Hino R. J UOEH. 2010;32:317–328. doi: 10.7888/juoeh.32.317. [DOI] [PubMed] [Google Scholar]
- 62.Torrero MN, Henk WG, Li S. Clin Cancer Res. 2006;12:257–263. doi: 10.1158/1078-0432.CCR-05-1514. [DOI] [PubMed] [Google Scholar]
- 63.Tran M, Rousselle P, Nokelainen P, Tallapragada S, Nguyen NT, Fincher EF, Marinkovich MP. Cancer Res. 2008;68:2885–2894. doi: 10.1158/0008-5472.CAN-07-6160. [DOI] [PubMed] [Google Scholar]
- 64.Voss MA, Gordon N, Maloney S, Ganesan R, Ludeman L, McCarthy K, Gornall R, Schaller G, Wei W, Berditchevski F, Sundar S. Br J Cancer. 2011;104:1611–1618. doi: 10.1038/bjc.2011.80. [DOI] [PMC free article] [PubMed] [Google Scholar]
- 65.Weinberg AS, Ogle CA, Shim EK. Dermatol Surg. 2007;33:885–899. doi: 10.1111/j.1524-4725.2007.33190.x. [DOI] [PubMed] [Google Scholar]
- 66.Wilhelmsen K, Litjens SH, Kuikman I, Margadant C, van Rheenen J, Sonnenberg A. Mol Biol Cell. 2007;18:3512–3522. doi: 10.1091/mbc.E07-04-0306. [DOI] [PMC free article] [PubMed] [Google Scholar]
- 67.Winterwood NE, Varzavand A, Meland MN, Ashman LK, Stipp CS. Mol Biol Cell. 2006;17:2707–2721. doi: 10.1091/mbc.E05-11-1042. [DOI] [PMC free article] [PubMed] [Google Scholar]
- 68.Wright MD, Geary SM, Fitter S, Moseley GW, Lau LM, Sheng KC, Apostolopoulos V, Stanley EG, Jackson DE, Ashman LK. Mol Cell Biol. 2004;24:5978–5988. doi: 10.1128/MCB.24.13.5978-5988.2004. [DOI] [PMC free article] [PubMed] [Google Scholar]
- 69.Xia W, Mullin RJ, Keith BR, Liu LH, Ma H, Rusnak DW, Owens G, Alligood KJ, Spector NL. Oncogene. 2002;21:6255–6263. doi: 10.1038/sj.onc.1205794. [DOI] [PubMed] [Google Scholar]
- 70.Yánez-Mó M, Alfranca A, Cabañas C, Marazuela M, Tejedor R, Ursa MA, Ashman LK, De Landázuri MO, Sánchez-Madrid F. J Cell Biol. 1998;141:791–804. doi: 10.1083/jcb.141.3.791. [DOI] [PMC free article] [PubMed] [Google Scholar]
- 71.Yang XH, Flores LM, Li Q, Zhou P, Xu F, Krop IE, Hemler ME. Cancer Res. 2010;70:2256–2263. doi: 10.1158/0008-5472.CAN-09-4032. [DOI] [PMC free article] [PubMed] [Google Scholar]
- 72.Yang XH, Mirchev R, Deng X, Yang HL, Golan DE, Hemler ME. J Cell Sci. 2012 doi: 10.1242/jcs.093963. (ePub). [DOI] [PMC free article] [PubMed] [Google Scholar]
- 73.Yang XH, Richardson AL, Torres-Arzayus MI, Zhou P, Sharma C, Kazarov AR, Andzelm MM, Strominger JL, Brown M, Hemler ME. Cancer Research. 2008;68:3204–3213. doi: 10.1158/0008-5472.CAN-07-2949. [DOI] [PMC free article] [PubMed] [Google Scholar]
- 74.Yauch RL, Berditchevski F, Harler MB, Reichner J, Hemler ME. Mol Biol Cell. 1998;9:2751–2765. doi: 10.1091/mbc.9.10.2751. [DOI] [PMC free article] [PubMed] [Google Scholar]
- 75.Yauch RL, Kazarov AR, Desai B, Lee RT, Hemler ME. J Biol Chem. 2000;275:9230–9238. doi: 10.1074/jbc.275.13.9230. [DOI] [PubMed] [Google Scholar]
- 76.Zhang XA, Bontrager AL, Hemler ME. J Biol Chem. 2001;276:25005–25013. doi: 10.1074/jbc.M102156200. [DOI] [PubMed] [Google Scholar]
- 77.Zijlstra A, Lewis J, Degryse B, Stuhlmann H, Quigley JP. Cancer Cell. 2008;13:221–234. doi: 10.1016/j.ccr.2008.01.031. [DOI] [PMC free article] [PubMed] [Google Scholar]
Associated Data
This section collects any data citations, data availability statements, or supplementary materials included in this article.