

Abstract
Expression of the forkhead box protein 3 (FoxP3) transcription factor is regulated by the E3 ubiquitin ligases Itch and Cbl-b and induces regulatory activity CD4+CD25high T cells. Treatment with interferon (IFN)-β enhances regulatory T cell activity in multiple sclerosis (MS). We studied the phenotype of CD4+CD25high T cells in MS by flow cytometry and its relationship with expression of the FOXP3, ITCH and CBLB genes. We found that untreated MS patients had lower cell surface expression of cytotoxic T lymphocyte antigen 4 (CTLA-4) on CD4+CD25high T cells and higher intracellular CTLA-4 expression than healthy controls. Cell surface expression of CTLA-4 on CD4+CD25high T cells correlated with expression of FOXP3 mRNA in untreated patients and increased significantly with time from most recent injection in patients treated with IFN-β. FOXP3 mRNA expression correlated with CBLB and ITCH and T helper type 2 cytokine mRNA expression in MS patients. These data link expression of FOXP3, CBLB and ITCH mRNA and CTLA-4 expression on the surface of CD4+CD25high T cell in MS. We hypothesize that this may reflect alterations in the inhibitory effect of CTLA-4 or in regulatory T cell function.
Keywords: CTLA-4, interferon treatment, multiple sclerosis, regulatory T cells
Introduction
Activated T cells are thought to play a major role in the pathogenesis of multiple sclerosis (MS) [1]. Myelin-reactive CD4+ T cells can be identified even in healthy controls, but in MS myelin-reactive T cells are in an activated state and have a T helper type 1 (Th1) and Th17 cytokine secretion profile [2–6]. Regulatory T cells (Tregs) are essential in controlling immune responses [7,8]. In mice CD4+CD25+ T cells have a regulatory phenotype; in humans this is restricted mainly to CD4+ T cells that express high levels of the interleukin (IL)-2 receptor α-chain CD25 (CD4+CD25high) [9], and among the CD25high cells regulatory activity is further restricted to a subset that does not express the interleukin (IL)-7 receptor α-chain CD127 [10].
Previous studies suggested that the regulatory activity of CD25highCD4+ T cells is reduced in patients with relapsing–remitting MS, whereas it was normal in patients with secondary progressive MS [11–16]. However, the lower regulatory potential of CD4+CD25high T cells might be due to contamination with CD25high effector cells that co-express CD127 [17], and in one of two studies Treg activity in CD4+CD25highCD127low was found to be normal in MS [17,18].
The development of CD4+CD25+ Tregs is regulated by the transcription factor forkhead box protein 3 (FoxP3) [19–21]. Patients with the rare hereditary disorder immune dysregulation, polyendocrinopathy, enteropathy, X-linked (IPEX) syndrome have mutations in the FOXP3 gene, and loss of FoxP3 protein expression in IPEX is associated with the loss of immunoregulatory activity in CD4+CD25high T cells [22]. The expression of FOXP3, in turn, is controlled by expression of the E3 ubiquitin ligases Itch and Cbl-b [23,24]. The expression of the Cbl-b protein in T cells was reported previously to be decreased in patients with MS, and low expression of CBLB mRNA was related with increased relapse activity [25]. Expression of the ITCH gene has not been studied previously in MS.
Treatment of MS with interferon (IFN)-β decreases disease activity, and treatment with IFN-β was reported recently to improve the functional activity and modulate the phenotype of CD4+CD25high T cells in MS [15,26–28]. We hypothesized that FOXP3, CBLB and CBLB gene expression could be lower in untreated MS patients and increase upon treatment with IFN-β, and therefore compared FOXP3 mRNA expression with expression of CBLB, ITCH mRNA and with the activation status of CD4+CD25high T cells in healthy controls and MS patients before and during treatment with IFN-β 1a.
Material and methods
Patient material
Fifteen patients with relapsing–remitting MS who were scheduled for de-novo treatment with IFN-β (median age 31 years, 80% women) and 15 healthy volunteers (median age 34 years, 60% women) were included into the study. Blood samples were drawn from the patients before initiation of IFN-β therapy (all IFN-β1a) and after 3 months of treatment. Blood samples were collected at varying intervals from 1 to 7 days from the most recent IFN-β injection.
None of these patients had received immunomodulatory treatment for at least 3 months, none of the patients had been treated with methylprednisolone for at least 4 weeks prior to inclusion, and none of the patients had ever been treated with immunosuppressive drugs, e.g. mitoxantrone or cyclophosphamide. None of the patients had suffered from a relapse within 4 weeks and all were judged to be in clinical remission at the time of blood collection. The study was approved by the regional Scientific Ethics Committee, and informed consent was obtained from all study participants.
Flow cytometry studies
For staining of total (intracellular and surface) cytotoxic T lymphocyte antigen-4 (CTLA-4), cells were fixed with 4% paraformaldehylde, washed twice and permeabilized with 0·1% saponin prior to staining. For antibody staining 1–2 × 10⁵ peripheral blood mononuclear cells (PBMCs) in 50 μl florescence activated cell sorter (FACS) phosphate-buffered saline (PBS) were incubated on ice for 30 min in the dark with fluorochrome-conjugated monoclonal antibodies, washed twice with FACS PBS and fixed in 1% paraformaldehyde. The following antibodies were used: allophycocyanin (APC)-conjugated anti-CD4 (clone MT310; Dako, Glostrup, Denmark); peridinin chlorophyll (PerCP)-conjugated anti-CD45RO (clone UCHL1, custom conjugation; BD Pharmingen, San Jose, CA, USA); phycoerythrin (PE)-conjugated anti-CCR4 (clone 1G1; BD Pharmingen), anti-CCR5 (clone 2D7; BD Pharmingen), anti-CCR7 (clone 150503; R&D Systems, Abingdon, UK), anti-CXCR3 (clone 1C6; BD Pharmingen), anti-CXCR6 (clone 56811; R&D Systems), anti-CD28 (clone CD28·1; Dako), anti-VLA-4 (clone 9F10; BD Pharmingen), anti-CD62L (clone DREG-56; BD Pharmingen), anti-CD212 (clone 2B6; BD Pharmingen), anti-Fas (clone DX2; Dako), anti-FasL (clone Alf-2·1a; Ancell, Bayport, MN, USA), anti-CTLA-4 (clone BNI3; BD Pharmingen) and anti-PD-1 (clone MIH4; eBioscience, San Diego, CA, USA).
Real-time reverse transcriptase–polymerase chain reaction (RT–PCR)
Cytokine gene expression in blood mononuclear cells was measured by real-time RT–PCR on an ABI PRISM 7700 Sequence Detection System, as described previously in detail [29,30]. For analysis of the transcription factor FOXP3 and the E3 ubiquitin ligases CBLB and ITCH, total RNA was isolated from PBMC cell pellets using reagents obtained from Qiagen (Crawley, UK), and cDNA was generated by reverse transcription using the high capacity cDNA kit (Applied Biosystems, Foster City, CA, USA). RT–PCR was performed on an ABI PRISM 7500 Sequence Detection System (Applied Biosystems) using a commercially available master mix, predesigned primer/probe kits and a default PCR cycle sequence for the quantitative detection of mRNA (Applied Biosystems). The housekeeping gene GAPDH was used as endogenous control. The relative amount of target mRNA expression was calculated by the ΔΔCT method, which normalizes the copy number of the target mRNA to that of an endogenous reference gene (GAPDH). The resulting mRNA expression index was then normalized to the gene expression of a sample containing pooled cDNA from healthy volunteers, serving as a calibrator. Previously published data on cytokine gene expression in the patients included in the present study were used for an analysis of the relationship between FOXP3 gene expression and cytokine gene expression [30].
Statistics
The distribution of CD25–, CD25low and CD25high cells followed the normal distribution, but the expression of several of the molecules studied in these CD4+ T cell subsets did not follow the normal distribution. For this reason parametric methods were used for the analysis of CD25–, CD25low and CD25high CD4+ T cells and non-parametric methods were used for all other analyses (Mann–Whitney U-test, Wilcoxon's and Spearman's rank correlation analysis). A significance level of P = 0·05 was used for all statistical analyses.
Results
The phenotype of CD4+ T cells from healthy controls was analysed by flow cytometry after gating of three separate subsets: a CD25–, a CD25low and CD25high subset (Fig. 1). CD4+CD25– T cells comprised 73% [mean, standard deviation (s.d.) 7·8%], CD4+CD25low T cells comprised 22% (s.d. 7·5%) and CD4+CD25high T cells 5·1% (mean, s.d. 1·3%) of circulating CD4+ T cells in healthy controls. There were no significant differences between MS patients and healthy controls in the percentage of CD4+ T cells that were CD25–, CD25low or CD25high or in absolute cell counts in these subpopulations (data not shown).
Fig. 1.
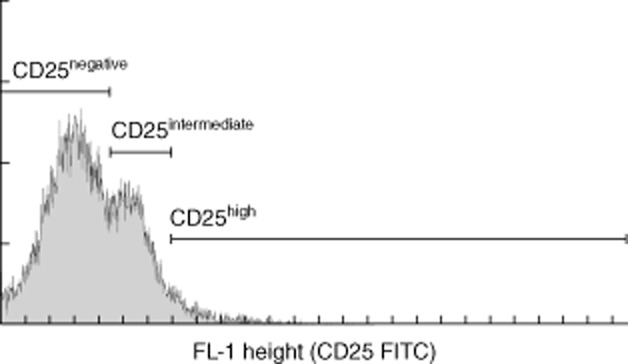
CD25-negative, CD25low and CD25high subsets of CD4+ T cells were identified by flow cytometry in healthy controls and multiple sclerosis (MS) patients before and after therapy with interferon-β.
Surface expression of all molecules under study differed significantly in the CD4+ T cell subsets in healthy controls (Table 1). The results of the flow cytometry studies of CD4+CD25–, CD4+CD25low and CD4+ CD25high T cells activation and gene expression studies in healthy controls, untreated MS patients and MS patients treated with IFN-β are summarized in Table 2. Untreated patients with MS had a lower percentage of CD25highCD4+ T cells with surface expression of CTLA-4 than healthy controls (P = 0·003), whereas the percentage of CD25highCD4+ T cells expressing CTLA-4 (intracellular + surface) was higher in MS than in healthy controls (P = 0·007).
Table 1.
The percentage of CD25–, CD25low and CD25high CD4+ T cells expressing different activation and differentiation markers (median with 25 and 75 percentiles)
| CD25– | CD25low | CD25high | |
|---|---|---|---|
| Highest in CD25high | |||
| CD71 | 6·3% (4·7–8·4) | 14% (8·4–19) | 27% (23–32) |
| CD122 | 1·1% (0·9–2·2) | 2·1% (1·2–3·2) | 7·3% (5·6–8·6) |
| HLA-DR | 5·8% (5·2–7·8) | 8·3% (5·1–10·2) | 32% (25–37) |
| CCR4 | 18% (15–22) | 43% (31–53) | 67% (62–70%) |
| CCR5 | 4·3% (3·0–6·5) | 8·6% (6·8–14) | 14% (11–23) |
| CD103 | 0·9% (0·5–1·1) | 2·4% (1·6–3·4) | 5·3% (3·2–6·8) |
| Surface CTLA-4 | 4·7% (3·1–6·3) | 7·5% (5·8–10·3) | 10% (7·9–14) |
| Intracellular and surface CTLA-4 | 1·2% (0·9–2·6) | 2·9% (1·9–5·9) | 6·2% (3·7–17) |
| GITR | 3·9% (3·2–5·0) | 9·9% (7·7–13) | 14% (11–17%) |
| CD137 | 1·1% (0·8–1·4) | 2·5% (2·0–3·9) | 15% (9·7–18) |
| Lowest in CD25high | |||
| CCR7 | 86% (74–91) | 60% (51–77) | 51% (37–66) |
| CD49dhigh | 31% (23–36) | 41% (33–47%) | 19% (15–22) |
| Highest in CD25low and CD25high | |||
| PD-1 | 2·6% (2·1–4·6) | 4·7% (3·4–7·1) | 4·7% (2·7–8·1) |
| CD134 | 0·5% (0·4–0·9) | 2·8% (2·0–3·9) | 3·3% (2·4–5·8) |
| Highest in CD25– and CD25high | |||
| CD62L | 95% (92–96) | 77% (69–89) | 94% (88–95) |
CTLA-4: cytotoxic T lymphocyte antigen-4; GITR: glucocorticoid-induced tumour necrosis factor receptor family-related; HLA-DR: human leucocyte antigen DR.
Table 2.
Percentage of CD4+CD25–, CD4+CD25low and CD4+CD25high T cells expressing surface and intracellular (i.c.) cytotoxic T lymphocyte antigen 4 (CTLA-4) and expression of forkhead box protein 3 (FoxP3), CBLB and ITCH in mononuclear cells from healthy controls, untreated multiple sclerosis (MS) patients and the same patients 3 months after the initiation of treatment with interferon (IFN)-β. Data are median with interquartile range; statistical testing was by the Mann–Whitney U-test and Wilcoxon test
| Healthy controls | Untreated MS | IFN-β treatment | |
|---|---|---|---|
| CD4+CD25– | |||
| Surface CTLA-4 | 4·7% (3·1–6·3) | 5·0% (2·9–6·0) | 4·1% (3·4–6·0) |
| Surface + i.c. CTLA-4 | 1·2% (0·9–2·6) | 1·9% (1·2–3·5) | 2·1% (1·3–3·4) |
| CD4+CD25low | |||
| Surface CTLA-4 | 7·5% (5·8–10·3) | 7·0% (5·0–8·0) | 7·0% (5·2–9·9) |
| Surface + i.c. CTLA-4 | 2·9% (1·9–5·9) | 4·4% (2·6–9·2) | 4·5% (3·4–6·8) |
| CD4+CD25high | |||
| Surface CTLA-4 | 10% (7·9–14) | 5·0 (3·3–7·6) P = 0·003a | 6·7% (5·0–13) |
| Surface + i.c. CTLA-4 | 6·2% (3·7–17) | 18% (11–30), P = 0·007a | 21% (12–34), P < 0·001a |
| FOXP3 mRNA | 1·14 (0·61–2·20) | 1·49 (0·91–1·80) | 1·45 (0·77–2·63) |
| CBLB mRNA | 1·14 (0·90–1·75) | 1·39 (1·08–1·59) | 1·32 (0·85–2·83) |
| ITCH mRNA | 1·16 (0·87–1·47) | 1·40 (1·09–1·76) | 1·14 (0·88–2·58) |
Compared with healthy controls.
After 3 months of treatment with IFN-β the percentage of CD4+CD25high T cells expressing CTLA-4 (intracellular + surface) had not changed from baseline values, and remained higher in MS patients treated with IFN-β than in healthy controls (Table 2: P < 0·001). By contrast, the percentage of CD4+CD25high T cells with surface expression of CTLA-4 had increased slightly after 3 months of treatment and no longer differed significantly from the level in control subjects, although the increase itself was not statistically significant. Furthermore, CTLA-4 expression on the surface of CD4+CD25high T cells in patients treated with IFN-β was time-dependent, as there was a positive correlation with the number of days during the up to 7-day interval from the most recent injection of IFN-β1a (Fig. 2: Spearman's rank correlation coefficient = 0·81, P = 0·001), and when samples obtained more than 3 days after an injection of IFN-β were analysed separately, CTLA-4 expression on the surface of CD4+CD25high T cells was higher after treatment with IFN-β than at baseline (P = 0·043).
Fig. 2.
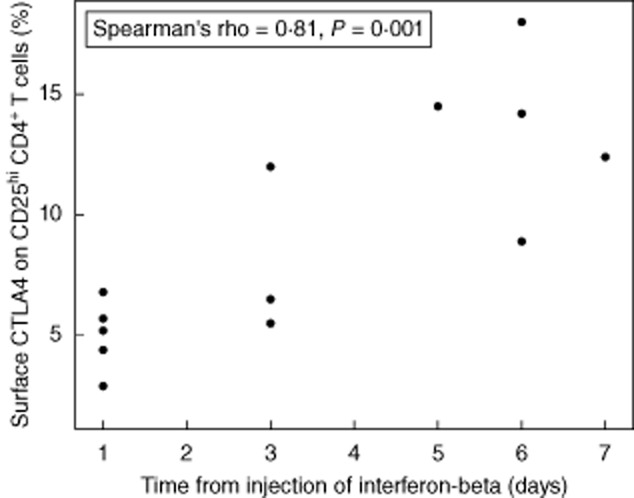
Correlation between the time from the most recent injection of interferon-beta and the percentage of CD25high CD4+ T cells expressing cytotoxic T lymphocyte antigen 4 (CTLA-4) on the cell surface in patients treated with interferon-β for 3 months.
There were no significant differences between untreated MS patients, patients treated with IFN-β and healthy controls in the expression of any of the other molecules studied on CD4+ T cell subsets (data not shown). We found no significant differences between untreated MS patients and controls in the expression of FOXP3, CBLB or ITCH mRNA, and the expression of these molecules did not differ between untreated MS patients and patients treated with IFN-β (Table 2). FOXP3 expression correlated with CBLB expression in untreated MS patients and in patients treated with IFN-β (Table 3). Untreated MS patients also showed significant correlations between FOXP3 expression and the percentage of CD4+CD25high T cells with cell surface expression of CTLA-4. Furthermore, analysing the relationship between the expression of a panel of cytokines studied previously in these patients and FOXP3 gene expression [30], we observed significant correlations between expression of the T helper type 2 transcription factor GATA3 and FOXP3 gene expression in healthy controls, untreated MS patients and MS patients treated with IFN-β (Table 2). Finally, in patients treated with IFN-β, FOXP3 gene expression correlated with expression of ITCH, the Th2 cytokine IL4, TGFB1 and IFNG.
Table 3.
Correlation between the expression of FOXP3 mRNA in blood mononuclear cells (MNC), the percentage CD4+ CD25hi T cell subsets and expression of mRNA encoding the E3 ubiquitin ligases CBLB and ITCH. Expression was studied in healthy controls, untreated patients with multiple sclerosis (MS) and MS patients treated with interferon (IFN)-β. Data are Spearman's rank correlation coefficients with P-values for correlations with FOXP3 expression
| Healthy controls | Untreated MS | IFN-β treated MS | |
|---|---|---|---|
| CD4+ CD25high T cells (% of CD4+ T cells) | n.s. | n.s. | n.s. |
| CD4+ CD25high T cells (% of blood MNCs) | n.s. | n.s. | n.s. |
| CD4+ CD25high T cells with cell surface CTLA-4 (%) | n.s. | 0·66, P = 0·008 | n.s. |
| CBLB | n.s. | 0·80, P < 0·001 | 0·83, P < 0·001 |
| ITCH | n.s. | n.s. | 0·71, P = 0·003 |
| TBX21 | n.s. | n.s. | n.s. |
| IFNG | n.s. | n.s. | 0·66, P = 0·008 |
| TNF | n.s. | n.s. | n.s. |
| GATA3 | 0·78, P = 0·001 | 0·88, P < 0·001 | 0·86, P < 0·001 |
| IL4 | n.s. | n.s. | 0·83, P < 0·001 |
| IL13 | n.s. | n.s. | n.s. |
| TGFB1 | n.s. | n.s. | 0·88, P < 0·001 |
| IL10 | n.s. | n.s. | n.s. |
CTLA-4: cytotoxic T lymphocyte antigen 4; n.s.: not significant.
Discussion
This study addressed changes in the phenotype of CD4+CD25high T cells and the expression of FOXP3, CBLB and ITCH mRNA in untreated MS patients and patients treated with IFN-β. We found that the percentage of CD4+CD25high T cells that expressed CTLA-4 differed significantly in untreated patients with MS and healthy controls. MS patients had a higher percentage of CD4+CD25high T cells with total (intracellular + surface) expression of CTLA-4 than controls, regardless of whether they were untreated or treated with IFN-β, whereas the percentage of CD25high CD4+ T cells with surface expression of CTLA-4 was lower in untreated MS patients than in healthy controls and increased after treatment with IFN-β. Furthermore, we observed correlations between FOXP3 mRNA expression in PBMCs and CTLA-4 surface expression on CD25highCD4+ T cells in untreated MS patients, suggesting a functional link between FOXP3 gene expression and CD25highCD4+ T cell activation or function.
Deficient CD4+CD25high regulatory T cell activity has been reported in MS, and has been linked to lower expression of FOXP3 mRNA and FoxP3 protein and to a decrease in the percentage of CD31+ recent thymic immigrants with a regulatory phenotype in MS [12,14,15,27,31,32]. The use of cell surface markers and FoxP3 expression to identify regulatory T cells in humans is, however, a matter of debate, as FoxP3 is also expressed as a normal response to T cell activation [33], and a decrease in FOXP3 mRNA expression in MS has not been found in all previous studies in MS [13]. Furthermore, the extent to which regulatory T cell function is reduced in MS is still uncertain, as one study indicated that the impaired regulatory potential of CD4+CD25high T cells in MS might be due to contamination with CD25high effector cells that co-express CD127 [10,17]. The regulatory activity of CD4+CD25highCD127low cells was reportedly normal, although another study indicated that a recently identified subset of CD4+CD25highCD39+127low T cells had reduced regulatory activity in MS [17,18].
Circulating human CD4+CD25high T cells are anergic to T cell receptor stimulation, but have an activated phenotype as they express surface CD69, CD71, human leucocyte antigen D-related (HLA-DR) and intracellular and surface CTLA-4 [9,34–38]. Although the expression of these molecules also increases after ex-vivo activation of CD4+CD25– T cells, the increase in CTLA-4 expression is longer-lasting in CD4+CD25high T cells [34–36]. CTLA-4 is related to the CD28 molecule and, like CD28, binds the B7 family members CD80 (B7-1) and CD86 (B7-2). However, whereas CD28 delivers a co-stimulatory signal, CTLA-4 signals are inhibitory [39]. CTLA-4 is stored intracellularly, and T cell activation results in increased transport of CTLA-4 to the cell surface, where it is expressed primarily at sites of T cell receptor activation [40]. Two previous studies reported some increase in CTLA-4 expression on the surface of CD4+ T cells in untreated MS patients [41,42]. We also observed slightly higher CTLA-4 expression on the surface of CD4+CD25– T cells from MS patients, but this difference was not statistically significant, due possibly to the small sample size. By contrast, we found increased total (intracellular + surface) expression but lower cell surface expression of CTLA-4 on CD4+CD25high T cells from MS patients. Whether or not this reflects activation of regulatory T cells or activation of CD25high effector cells remains to be established. Another study investigated the extent to which T cell proliferation was disinhibited by anti-CTLA-4 antibodies, and found a lower effect of anti-CTLA-4 on the proliferation of myelin basic protein-reactive T cells from MS patients than from controls [43]. These findings indicate an altered function of CTLA-4-expressing cells or altered effects of CTLA-4 in MS but, again, functional studies are needed to establish whether this reflects changes in Tregs or effector cells that express CTLA-4.
The FoxP3 molecule is a transcription factor that controls the expression of genes responsible for the regulatory phenotype of CD25highCD4+ T cells, e.g. expression of CTLA-4 and CD25 itself [21,44,45]. Cell surface CTLA-4 expression on CD4+CD25high T cells correlated with FOXP3–expression in untreated MS patients in the present study, and treatment with IFN-β resulted in a time-dependent increase in the surface expression of CTLA-4 on CD4+CD25high T cells when CTLA-4 expression was followed for up to 1 week after the injection of IFN-β. Hence, it is possible that the increase in CTLA-4 expression observed after treatment with IFN-β might reflect transactivation of CTLA-4 gene expression by FoxP3 transcriptional activity. However, as the total (intracellular + surface) expression of CTLA-4 did not change upon treatment with IFN-β, and as there was no increase in FOXP3 mRNA expression, an alternative explanation is that it might reflect that treatment with IFN-β induces the expression of TCIRG1 [46] – also known as TIRC7 – which is crucially involved in the expression and intracellular trafficking of CTLA-4 to the T cell surface [47,48].
Expression of FoxP3 depends on expression of the E3 ubiquitin ligases Itch and Cbl-b, and we found significant correlations between the expression of FOXP3, CBLB and ITCH mRNA [23,24]. Furthermore, FOXP3 gene expression correlated with expression of the Th2 transcription factor GATA3. In patients treated with IFN-β FoxP3 gene expression did, however, also correlate with expression of TGFB1 and IFNG. Expression of FOXP3, ITCH or CBLB mRNA did not differ in healthy controls, untreated MS patients and patients treated with IFN-β. This indicates that although treatment with IFN-β may restore CD4+CD25high regulatory T cell activity, this is not reflected by changes in the expression of these molecules in MNCs from MS patients treated with IFN-β [15,26,27,32].
Acknowledgments
Thanks are due to Susanne Velgaard, Rikke Kroager and Henriette Egeblad for skilled technical assistance. This study was supported by grants from the AFA foundation, the Dagmar Marshall Foundation, the Danish Multiple Sclerosis Society, the Foght Trust Foundation, Knut and Alice Wallenberg's Foundation, the Lily Benthine Lund Foundation and the Swedish Research Council.
Disclosure
F.S. has served on scientific advisory boards for Biogen Idec, Merck Serono, Novartis, Sanofi-Aventis and TEVA, has been on the steering committee of a clinical trial sponsored by Merck Serono, and served as consultant for Biogen Idec and Novo Nordisk; has received support for congress participation from Biogen Idec, Novartis and Sanofi Aventis; has received speaker honoraria from Biogen Idec, Merck Serono, Bayer Schering, Schering-Plough, Sanofi-aventis and Novartis. His laboratory has received research support from Biogen Idec, Bayer Schering, Merck Serono, Sanofi-Aventis and Novartis. T.O. has received honoraria for lectures, participation in advisory boards and unrestricted MS research grants from Biogen Idec, Novartis, Merck Sanofi Aventis and Bayer. P.S.S. has served on scientific advisory boards for Biogen Idec, Merck Serono, Novartis, Genmab, TEVA, Elan, GSK, has been on steering committees or independent data monitoring boards in clinical trials sponsored by Merck Serono, Genmab, TEVA, GSK, Bayer Schering, and he has received funding of travel for these activities, has served as Editor-in-Chief of the European Journal of Neurology, and is currently editorial board member for Multiple Sclerosis Journal, European Journal of Neurology, Therapeutic Advances in Neurological Disorders; has received speaker honoraria from Biogen Idec, Merck Serono, TEVA, Bayer Schering, Sanofi-aventis, and Novartis. His department has received research support from Biogen Idec, Bayer Schering, Merck Serono, TEVA, Baxter, Sanofi-Aventis, BioMS, Novartis, Bayer, RoFAR, Roche, Genzyme, from the Danish Multiple Sclerosis Society, the Danish Medical Research Council, and the European Union Sixth Framework Programme: Life sciences, Genomics and Biotechnology for health.
References
- 1.Weiner HL. The challenge of multiple sclerosis: how do we cure a chronic heterogeneous disease? Ann Neurol. 2009;65:239–248. doi: 10.1002/ana.21640. [DOI] [PubMed] [Google Scholar]
- 2.Bielekova B, Muraro PA, Golestaneh L, et al. Preferential expansion of autoreactive T lymphocytes from the memory T-cell pool by IL-7. J Neuroimmunol. 1999;100:115–123. doi: 10.1016/s0165-5728(99)00200-3. [DOI] [PubMed] [Google Scholar]
- 3.Correale J, Gilmore W, McMillan M, et al. Patterns of cytokine secretion by autoreactive proteolipid protein-specific T cell clones during the course of multiple sclerosis. J Immunol. 1995;154:2959–2968. [PubMed] [Google Scholar]
- 4.Zhang J, Markovic-Plese S, Lacet B, et al. Increased frequency of interleukin 2-responsive T cells specific for myelin basic protein and proteolipid protein in peripheral blood and cerebrospinal fluid of patients with multiple sclerosis. J Exp Med. 1994;179:973–984. doi: 10.1084/jem.179.3.973. [DOI] [PMC free article] [PubMed] [Google Scholar]
- 5.Olsson T, Zhi WW, Hojeberg B, et al. Autoreactive T lymphocytes in multiple sclerosis determined by antigen-induced secretion of interferon-gamma. J Clin Invest. 1990;86:981–985. doi: 10.1172/JCI114800. [DOI] [PMC free article] [PubMed] [Google Scholar]
- 6.Hedegaard CJ, Krakauer M, Bendtzen K, et al. T helper cell type 1 (Th1), Th2 and Th17 responses to myelin basic protein and disease activity in multiple sclerosis. Immunology. 2008;125:161–169. doi: 10.1111/j.1365-2567.2008.02837.x. [DOI] [PMC free article] [PubMed] [Google Scholar]
- 7.Zozulya AL, Wiendl H. The role of regulatory T cells in multiple sclerosis. Nat Clin Pract Neurol. 2008;4:384–398. doi: 10.1038/ncpneuro0832. [DOI] [PubMed] [Google Scholar]
- 8.Anderton SM, Liblau RS. Regulatory T cells in the control of inflammatory demyelinating diseases of the central nervous system. Curr Opin Neurol. 2008;21:248–254. doi: 10.1097/WCO.0b013e3282febf58. [DOI] [PubMed] [Google Scholar]
- 9.Baecher-Allan C, Brown JA, Freeman GJ, et al. CD4+CD25high regulatory cells in human peripheral blood. J Immunol. 2001;167:1245–1253. doi: 10.4049/jimmunol.167.3.1245. [DOI] [PubMed] [Google Scholar]
- 10.Liu W, Putnam AL, Xu-Yu Z, et al. CD127 expression inversely correlates with FoxP3 and suppressive function of human CD4+ Treg cells. J Exp Med. 2006;203:1701–1711. doi: 10.1084/jem.20060772. [DOI] [PMC free article] [PubMed] [Google Scholar]
- 11.Haas J, Hug A, Viehover A, et al. Reduced suppressive effect of CD4+CD25high regulatory T cells on the T cell immune response against myelin oligodendrocyte glycoprotein in patients with multiple sclerosis. Eur J Immunol. 2005;35:3343–3352. doi: 10.1002/eji.200526065. [DOI] [PubMed] [Google Scholar]
- 12.Haas J, Fritzsching B, Trubswetter P, et al. Prevalence of newly generated naive regulatory T cells (Treg) is critical for Treg suppressive function and determines Treg dysfunction in multiple sclerosis. J Immunol. 2007;179:1322–1330. doi: 10.4049/jimmunol.179.2.1322. [DOI] [PubMed] [Google Scholar]
- 13.Kumar M, Putzki N, Limmroth V, et al. CD4+CD25+FoxP3+ T lymphocytes fail to suppress myelin basic protein-induced proliferation in patients with multiple sclerosis. J Neuroimmunol. 2006;180:178–184. doi: 10.1016/j.jneuroim.2006.08.003. [DOI] [PubMed] [Google Scholar]
- 14.Venken K, Hellings N, Hensen K, et al. Secondary progressive in contrast to relapsing–remitting multiple sclerosis patients show a normal CD4+CD25+ regulatory T-cell function and FOXP3 expression. J Neurosci Res. 2006;83:1432–1446. doi: 10.1002/jnr.20852. [DOI] [PubMed] [Google Scholar]
- 15.Venken K, Hellings N, Thewissen M, et al. Compromised CD4+CD25(high) regulatory T-cell function in patients with relapsing–remitting multiple sclerosis is correlated with a reduced frequency of FOXP3-positive cells and reduced FOXP3 expression at the single-cell level. Immunology. 2008;123:79–89. doi: 10.1111/j.1365-2567.2007.02690.x. [DOI] [PMC free article] [PubMed] [Google Scholar]
- 16.Viglietta V, Baecher-Allan C, Weiner HL, et al. Loss of functional suppression by CD4+CD25+ regulatory T cells in patients with multiple sclerosis. J Exp Med. 2004;199:971–979. doi: 10.1084/jem.20031579. [DOI] [PMC free article] [PubMed] [Google Scholar]
- 17.Michel L, Berthelot L, Pettre S, et al. Patients with relapsing–remitting multiple sclerosis have normal Treg function when cells expressing IL-7 receptor alpha-chain are excluded from the analysis. J Clin Invest. 2008;118:3411–3419. doi: 10.1172/JCI35365. [DOI] [PMC free article] [PubMed] [Google Scholar]
- 18.Fletcher JM, Lonergan R, Costelloe L, et al. CD39+Foxp3+ regulatory T Cells suppress pathogenic Th17 cells and are impaired in multiple sclerosis. J Immunol. 2009;183:7602–7610. doi: 10.4049/jimmunol.0901881. [DOI] [PubMed] [Google Scholar]
- 19.Yagi H, Nomura T, Nakamura K, et al. Crucial role of FOXP3 in the development and function of human CD25+CD4+ regulatory T cells. Int Immunol. 2004;16:1643–1656. doi: 10.1093/intimm/dxh165. [DOI] [PubMed] [Google Scholar]
- 20.Walker MR, Kasprowicz DJ, Gersuk VH, et al. Induction of FoxP3 and acquisition of T regulatory activity by stimulated human CD4+ J Clin Invest. 2003;112:1437–1443. doi: 10.1172/JCI19441. [DOI] [PMC free article] [PubMed] [Google Scholar]
- 21.Williams LM, Rudensky AY. Maintenance of the Foxp3-dependent developmental program in mature regulatory T cells requires continued expression of Foxp3. Nat Immunol. 2007;8:277–284. doi: 10.1038/ni1437. [DOI] [PubMed] [Google Scholar]
- 22.Bacchetta R, Passerini L, Gambineri E, et al. Defective regulatory and effector T cell functions in patients with FOXP3 mutations. J Clin Invest. 2006;116:1713–1722. doi: 10.1172/JCI25112. [DOI] [PMC free article] [PubMed] [Google Scholar]
- 23.Venuprasad K, Huang H, Harada Y, et al. The E3 ubiquitin ligase Itch regulates expression of transcription factor Foxp3 and airway inflammation by enhancing the function of transcription factor TIEG1. Nat Immunol. 2008;9:245–253. doi: 10.1038/niXXXX. [DOI] [PMC free article] [PubMed] [Google Scholar]
- 24.Wohlfert EA, Gorelik L, Mittler R, et al. Cutting edge: deficiency in the E3 ubiquitin ligase Cbl-b results in a multifunctional defect in T cell TGF-beta sensitivity in vitro and in vivo. J Immunol. 2006;176:1316–1320. doi: 10.4049/jimmunol.176.3.1316. [DOI] [PubMed] [Google Scholar]
- 25.Zhou WB, Wang R, Deng YN, et al. Study of Cbl-b dynamics in peripheral blood lymphocytes isolated from patients with multiple sclerosis. Neurosci Lett. 2008;440:336–339. doi: 10.1016/j.neulet.2008.05.089. [DOI] [PubMed] [Google Scholar]
- 26.de Andres C, Aristimuno C, de Las Heras V, et al. Interferon beta-1a therapy enhances CD4+ regulatory T-cell function: an ex vivo and in vitro longitudinal study in relapsing–remitting multiple sclerosis. J Neuroimmunol. 2007;182:204–211. doi: 10.1016/j.jneuroim.2006.09.012. [DOI] [PubMed] [Google Scholar]
- 27.Venken K, Hellings N, Broekmans T, et al. Natural naive CD4+CD25+CD127low regulatory T cell (Treg) development and function are disturbed in multiple sclerosis patients: recovery of memory Treg homeostasis during disease progression. J Immunol. 2008;180:6411–6420. doi: 10.4049/jimmunol.180.9.6411. [DOI] [PubMed] [Google Scholar]
- 28.Sellebjerg F, Krakauer M, Limborg S, et al. Endogenous and recombinant type I interferons and disease activity in multiple sclerosis. PLoS ONE. 2012;7:e35927. doi: 10.1371/journal.pone.0035927. [DOI] [PMC free article] [PubMed] [Google Scholar]
- 29.Krakauer M, Sorensen PS, Khademi M, et al. Dynamic T-lymphocyte chemokine receptor expression induced by interferon-beta therapy in multiple sclerosis. Scand J Immunol. 2006;64:155–163. doi: 10.1111/j.1365-3083.2006.01788.x. [DOI] [PubMed] [Google Scholar]
- 30.Krakauer M, Sorensen P, Khademi M, et al. Increased IL-10 mRNA and IL-23 mRNA expression in multiple sclerosis: interferon-beta treatment increases IL-10 mRNA expression while reducing IL-23 mRNA expression. Mult Scler. 2008;14:622–630. doi: 10.1177/1352458507087136. [DOI] [PubMed] [Google Scholar]
- 31.Huan J, Culbertson N, Spencer L, et al. Decreased FOXP3 levels in multiple sclerosis patients. J Neurosci Res. 2005;81:45–52. doi: 10.1002/jnr.20522. [DOI] [PubMed] [Google Scholar]
- 32.Edstrom M, Mellergard J, Mjosberg J, et al. Transcriptional characteristics of CD4+ T cells in multiple sclerosis: relative lack of suppressive populations in blood. Mult Scler. 2011;17:57–66. doi: 10.1177/1352458510381256. [DOI] [PubMed] [Google Scholar]
- 33.Sakaguchi S, Miyara M, Costantino CM, et al. FOXP3+ regulatory T cells in the human immune system. Nat Rev Immunol. 2010;10:490–500. doi: 10.1038/nri2785. [DOI] [PubMed] [Google Scholar]
- 34.Dieckmann D, Plottner H, Berchtold S, et al. Ex vivo isolation and characterization of CD4(+)CD25(+) T cells with regulatory properties from human blood. J Exp Med. 2001;193:1303–1310. doi: 10.1084/jem.193.11.1303. [DOI] [PMC free article] [PubMed] [Google Scholar]
- 35.Jonuleit H, Schmitt E, Stassen M, et al. Identification and functional characterization of human CD4(+)CD25(+) T cells with regulatory properties isolated from peripheral blood. J Exp Med. 2001;193:1285–1294. doi: 10.1084/jem.193.11.1285. [DOI] [PMC free article] [PubMed] [Google Scholar]
- 36.Levings MK, Sangregorio R, Roncarolo MG. Human CD25(+)CD4(+) T regulatory cells suppress naive and memory T cell proliferation and can be expanded in vitro without loss of function. J Exp Med. 2001;193:1295–1302. doi: 10.1084/jem.193.11.1295. [DOI] [PMC free article] [PubMed] [Google Scholar]
- 37.Ng WF, Duggan PJ, Ponchel F, et al. Human CD4(+)CD25(+) cells: a naturally occurring population of regulatory T cells. Blood. 2001;98:2736–2744. doi: 10.1182/blood.v98.9.2736. [DOI] [PubMed] [Google Scholar]
- 38.Taams LS, Smith J, Rustin MH, et al. Human anergic/suppressive CD4(+)CD25(+) T cells: a highly differentiated and apoptosis-prone population. Eur J Immunol. 2001;31:1122–1131. doi: 10.1002/1521-4141(200104)31:4<1122::aid-immu1122>3.0.co;2-p. [DOI] [PubMed] [Google Scholar]
- 39.Rudd CE, Schneider H. Unifying concepts in CD28, ICOS and CTLA4 co-receptor signalling. Nat Rev Immunol. 2003;3:544–556. doi: 10.1038/nri1131. [DOI] [PubMed] [Google Scholar]
- 40.Linsley PS, Bradshaw J, Greene J, et al. Intracellular trafficking of CTLA-4 and focal localization towards sites of TCR engagement. Immunity. 1996;4:535–543. doi: 10.1016/s1074-7613(00)80480-x. [DOI] [PubMed] [Google Scholar]
- 41.Kosmaczewska A, Bilinska M, Ciszak L, et al. Different patterns of activation markers expression and CD4+ T-cell responses to ex vivo stimulation in patients with clinically quiescent multiple sclerosis (MS) J Neuroimmunol. 2007;189:137–146. doi: 10.1016/j.jneuroim.2007.06.021. [DOI] [PubMed] [Google Scholar]
- 42.Mena E, Rohowsky-Kochan C. Expression of costimulatory molecules on peripheral blood mononuclear cells in multiple sclerosis. Acta Neurol Scand. 1999;100:92–96. doi: 10.1111/j.1600-0404.1999.tb01044.x. [DOI] [PubMed] [Google Scholar]
- 43.Oliveira EM, Bar-Or A, Waliszewska AI, et al. CTLA-4 dysregulation in the activation of myelin basic protein reactive T cells may distinguish patients with multiple sclerosis from healthy controls. J Autoimmun. 2003;20:71–81. doi: 10.1016/s0896-8411(02)00106-3. [DOI] [PubMed] [Google Scholar]
- 44.Gavin MA, Rasmussen JP, Fontenot JD, et al. Foxp3-dependent programme of regulatory T-cell differentiation. Nature. 2007;445:771–775. doi: 10.1038/nature05543. [DOI] [PubMed] [Google Scholar]
- 45.Zheng Y, Josefowicz SZ, Kas A, et al. Genome-wide analysis of Foxp3 target genes in developing and mature regulatory T cells. Nature. 2007;445:936–940. doi: 10.1038/nature05563. [DOI] [PubMed] [Google Scholar]
- 46.Sellebjerg F, Datta P, Larsen J, et al. Gene expression analysis of interferon-beta treatment in multiple sclerosis. Mult Scler. 2008;14:615–621. doi: 10.1177/1352458507085976. [DOI] [PubMed] [Google Scholar]
- 47.Bulwin GC, Heinemann T, Bugge V, et al. TIRC7 inhibits T cell proliferation by modulation of CTLA-4 expression. J Immunol. 2006;177:6833–6841. doi: 10.4049/jimmunol.177.10.6833. [DOI] [PubMed] [Google Scholar]
- 48.Utku N, Boerner A, Tomschegg A, et al. TIRC7 deficiency causes in vitro and in vivo augmentation of T and B cell activation and cytokine response. J Immunol. 2004;173:2342–2352. doi: 10.4049/jimmunol.173.4.2342. [DOI] [PubMed] [Google Scholar]