

Abstract
The goal of the present study was to determine if there are global or regionally specific decreases in callosal area in early Alzheimer’s disease (AD) and mild cognitive impairment (MCI). In addition, this study examined the corpus callosum of healthy older adults who have subjective cognitive complaints (CC) but perform within normal limits on neuropsychological tests. We used a semi-automated procedure to examine the total and regional areas of the corpus callosum in 22 patients with early AD, 28 patients with amnestic MCI, 28 healthy older adults with cognitive complaints, and 50 demographically matched healthy controls (HC). The AD, MCI, and CC groups all showed a significant reduction of the posterior region (isthmus and splenium) relative to healthy controls. The AD group also had a significantly smaller overall callosum than the controls. The demonstration of callosal atrophy in older adults with cognitive complaints suggests that callosal changes occur very early in the dementing process, and that these earliest changes may be too subtle for detection by neuropsychological assessments, including memory tests.
Keywords: Alzheimer’s disease, Mild cognitive impairment, Cognitive complaints, Corpus callosum, Magnetic resonance imaging
1. Introduction
Alzheimer’s disease (AD) is a progressive, neurodegenerative disorder associated with impairments in memory, language, and thought [7,13]. In patients with AD, neurofibrillary changes are first seen in the entorhinal region and then progress to other closely related medial temporal areas including the hippocampus [5,6]. Previous magnetic resonance imaging (MRI) studies have shown the corpus callosum is also a structure susceptible to atrophy in AD [12,18,20,21,23,27,34,35,38]. Although the results in AD have been variable regarding which subregions of the corpus callosum are affected, all of these studies except one [12] have found significant atrophy in at least the posterior region.
To our knowledge, no imaging studies to date have examined the corpus callosum of patients who formally meet the criteria for amnestic mild cognitive impairment (MCI); however, one study has examined callosal area in patients with questionable dementia [20]. The specific criteria for amnestic MCI include subjective and informant verified memory complaints and scores on memory tests that are approximately 1.5 standard deviations below the age and education appropriate mean of healthy controls. Patients with MCI do not meet criteria for dementia and have generally normal cognition and the ability to function independently in daily activities [28]. MCI is believed to be a transitional stage between normal aging and dementia [26], and about 10–15% of patients diagnosed with MCI convert to AD each year [29].
We used a semi-automated method to examine callosal area in patients with early AD, in patients with amnestic MCI, and in healthy demographically matched controls (HC). This study is the first, to our knowledge, to also examine the callosum in a group of healthy older adults who have significant subjective cognitive complaints (CC) that are corroborated by an informant, but show no significant impairment on detailed neuropsychological testing, including assessment of the memory domain. By definition, the latter group did not meet criteria for either MCI or AD.
2. Methods
2.1. Participants
Participants (n = 128) were recruited from our medical center’s Geropsychiatry and General Internal Medicine clinics and from the community through flyers, talks, and newspaper advertisements. Patients and controls came from both sources. Exclusion criteria included any uncontrolled or confounding medical, psychiatric, or neurological condition (other than MCI or AD), a history of head trauma with more than a 5-min loss of consciousness, a current or past history of substance abuse or dependence, any factors contraindicating MRI scanning, and left-handedness. Prospective participants were also excluded if they were clinically depressed, as determined by a comprehensive evaluation by a board-certified geriatric psychiatrist (RBS) based on information gathered from structured interviews, informant questionnaires, and the Geriatric Depression Scale [39]. No participants were taking CNS active medications likely to affect cognition. None had significant white matter lesions based on a review of their MRI scans by a board-certified neuroradiologist (ACM). The Dartmouth College Committee for the Protection of Human Subjects approved all procedures used in this study, and all participants gave written informed consent prior to participating.
Each participant underwent a uniform clinical evaluation and was classified into the AD, MCI, CC, or HC group by consensus diagnosis based on clinical interviews, medical chart reviews, subjective questionnaires completed by the participant and an informant, results from a comprehensive neuropsychological testing, and a structural MRI to exclude other disorders. The AD group consisted of 22 patients who met the criteria for diagnosis of probable early AD, as defined by the NINCDS-ADRDA [25]. The MCI group was comprised of 28 patients who met criteria for amnestic MCI [28]. The CC group included 28 participants who had significant cognitive complaints but performed within normal limits on neuropsychological testing including memory measures. Fifty demographically matched participants with no significant cognitive complaints or deficits were included in the healthy control group. Despite the presence of complaints, the CC group did not differ from the HC group on memory measures. The four groups did not significantly differ in age, education, or sex distributions (all p > 0.05).
2.2. Neuropsychological assessment
All participants underwent a detailed neuropsychological evaluation including: Mini Mental State Examination (MMSE) [14], Mattis Dementia Rating Scale (DRS) [24], California Verbal Learning Test (CVLT-I or CVLT-II) [9,10], American National Adult Reading Test (ANART) [17], Boston Naming Test (BNT) [16], Geriatric Depression Scale, Trail Making Test [11], Wechsler Adult Intelligence Scale (WAIS-III; Digit Symbol, Digit Span, Block Design, Vocabulary, and Information subtests) [36], Wechsler Memory Scale (WMS-III; Logical Memory and Visual Reproduction subtests) [37], and Wisconsin Card Sorting Test (WCST, short form) [19]. Table 1 presents demographic and selected cognitive characteristics of the participants, including results from post hoc pair-wise comparisons. As expected, there were significant group differences on the DRS (p < 0.001), MMSE (p < 0.001), and CVLT (p < 0.001).
Table 1.
Demographic and cognitive characteristics
| Characteristics | HC (n = 50) | CC (n = 28) | MCI (n = 28) | AD (n = 22) | p |
|---|---|---|---|---|---|
| Age (years) | 71.9 (5.3) | 73.0 (6.4) | 72.5 (7.2) | 74.4 (7.6) | NS |
| Education (years) | 16.0 (2.7) | 16.9 (2.8) | 15.8 (3.3) | 15.0 (3.3) | NS |
| Sex (M/F) | 22/28 | 12/16 | 15/13 | 12/10 | NS |
| DRSa | 141.1 (2.5) | 141.3 (2.5) | 137.1 (5.1) | 119.3 (10.1) | 0.000b |
| MMSEc | 29.1 (1.2) | 28.9 (1.1) | 27.3 (2.2) | 24.6 (2.7) | 0.000b |
| CVLTd | 50.5 (9.0) | 46.8 (8.2) | 32.6 (6.6) | 20.7 (5.4) | 0.000b |
Values are mean (S.D.).
DRS = dementia rating scale (max = 144); data unavailable for 1 HC and 2 AD participants.
HC, CC > MCI > AD.
MMSE = mini mental state examination (max = 30); data unavailable for 11 HC and 12 AD participants.
CVLT = California verbal learning test, total learning score (max = 80); data unavailable for 11 HC and 10 AD participants.
Each participant’s cognitive complaints were gathered from standardized interviews and self-report inventories that included the Memory Self-Rating Questionnaire [32], self and informant versions of an Activities of Daily Living Scale [31], four cognitive items from the Geriatric Depression Scale, and a short form version of the Informant Questionnaire on Cognitive Decline in the Elderly (IQCODE) [22]. A cognitive complaint index (range: 0–100) was calculated based on the total number of items that could be endorsed by the participant and/or the informant. The decision to characterize a participant as having significant cognitive complaints was determined by a consensus evaluation of each participant’s and informant’s responses. Participants considered to have significant cognitive complaints usually endorsed 20% or more of the items on the cognitive complaint index.
2.3. MRI acquisition
All structural MRI scans were acquired using a single General Electric SIGNA 1.5 T scanner (General Electric Medical Systems, Milwaukee, WI). A coronal T1-weighted 3-D SPGR volumetric scan (slice thickness = 1.5 mm, TR = 25 ms, TE = 3 ms, FOV = 24 cm, NEX = 1) and an axial T2-weighted 3.0 mm scan were obtained for each participant.
2.4. Image processing, total intracranial volume, and corpus callosum area measurements
The software program BRAINS [2] was used to realign the images to the plane of the anterior commissure and posterior commissure (AC-PC) to correct for any minor variability resulting from head positioning during scanning. The images were then resampled into isotropic 1.015625 mm3 voxels. A locally developed script for MATLAB 6 (Mathworks Inc., Natick, MA) was used to extract the midsagittal slice. A semi-automated segmentation program (ALICE™, Parexel International Corp., 1999), based on a Sobel watershed filter, was then used to extract the boundary of the entire corpus callosum. Whenever a trace did not fully encompass the corpus callosum or if it included parts of another structure (e.g. fornix), minor manual editing was conducted by a single investigator (PJW) who was blinded to the diagnoses of all participants. The total area of the midsagittal corpus callosum was calculated using ALICE, based on the number of 1.015625 mm2 pixels located inside the callosal trace.
The corpus callosum was segmented into five subregions using a locally developed MATLAB program (AJS) that placed a rectangle around the AC-PC aligned and segmented corpus callosum. The rectangle with its greatest length along the long axis of the callosum was then divided into five segments of equal length (Fig. 1). The resulting subregions were labeled: C1 (rostrum and genu), C2 (anterior truncus), C3 (middle truncus), C4 (posterior truncus), and C5 (isthmus and splenium). The software counted any inferior portion of C1 that extended underneath into the C2 section as part of C1. Our five subregions are very similar to those used by a study that examined of the topography of the corpus callosum [8].
Fig. 1.
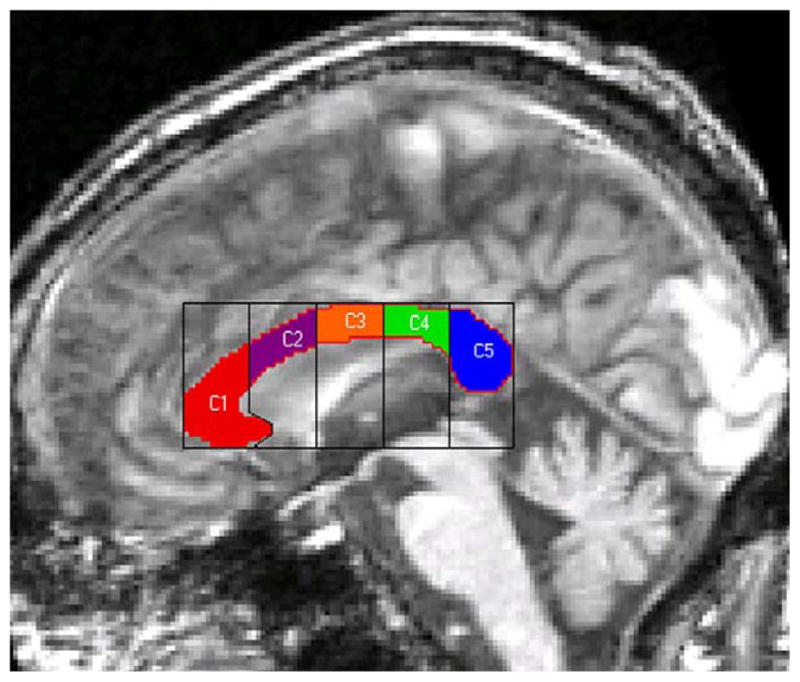
The five subregions of the corpus callosum. C1, rostrum and genu; C2, anterior truncus; C3, middle truncus; C4, posterior truncus; C5, isthmus and splenium.
Inter and intrarater reliability measurements were performed. Total and regional callosal areas from ten random traces were obtained by another researcher (JWM) and compared to those of PJW. The intraclass correlation coefficient for interrater reliability for total area was 0.99. For the regional areas, each was at least 0.95. Ten images were also retraced by PJW, and the intrarater reliability for both total and regional areas was 0.99.
Total intracranial volume (ICV) was obtained by manually tracing the outer boundary of the entire brain, including the cortical CSF, using the BRAINS software package [2–4].
2.5. Statistical analysis
Callosal areas were adjusted for total ICV prior to group comparisons using regression coefficients derived from the 50 healthy controls. We did not compute the adjustment for ICV using a regression with all 128 participants in order to avoid potential biases caused by cortical atrophy as a result of AD or preclinical dementia. Data distributions were assessed and descriptive statistics computed. A repeated measures analysis of variance (ANOVA) of the total and regional callosal areas was performed. Univariate orthogonal contrasts were then used in post hoc pairwise comparisons to test for differences in callosal area between groups.
3. Results
Callosal areas, adjusted for ICV, are presented in Table 2. On the omnibus ANOVA, the groups differed significantly for total callosal area (p < 0.05) and also for the C5 subregion (p < 0.01, Table 2). The overall group difference for the C4 subregion approached significance (p = 0.07, Table 2). Univariate post hoc analyses indicated that the total callosum (p < 0.01) and C4 and C5 subregions were significantly smaller (p < 0.02 and p < 0.01) for AD patients than HCs. Also, both the MCI group (p < 0.01) and the CC (p < 0.05) group had a significantly smaller C5 subregion than the HCs. Although the four groups were balanced for sex distribution, we also analyzed the data stratified by sex and found no significant main effects or interactions for either total or regional areas.
Table 2.
Adjusted corpus callosum areas for the four groups
| HC (n = 50) | CC (n = 28) | MCI (n = 28) | AD (n = 22) | F | p | |
|---|---|---|---|---|---|---|
| Total area | 715.40 ± 12.43 | 693.76 ± 16.62 | 678.19 ± 16.62 | 654.81 ± 18.74 | 2.73 | 0.05a,* |
| Region 1 | 207.32 ± 5.07 | 206.38 ± 6.78 | 195.99 ± 6.78 | 197.40 ± 7.65 | 0.86 | 0.46 |
| Region 2 | 106.59 ± 2.39 | 106.82 ± 3.20 | 104.66 ± 3.20 | 98.48 ± 3.61 | 1.34 | 0.26 |
| Region 3 | 99.93 ± 1.86 | 98.33 ± 2.48 | 98.95 ± 2.48 | 93.22 ± 2.80 | 1.37 | 0.26 |
| Region 4 | 98.03 ± 2.45 | 92.38 ± 3.28 | 95.44 ± 3.28 | 86.45 ± 3.70 | 2.42 | 0.07a,+ |
| Region 5 | 203.53 ± 4.10 | 189.84 ± 5.47 | 183.16 ± 5.47 | 179.26 ± 6.17 | 4.98 | 0.01b,** |
Areas adjusted for ICV from the 50 HC (Mean and Std. Error) (mm2).
HC > AD.
HC > AD, HC > MCI, HC > CC.
Significant difference between the four groups (p < 0.05).
Significant difference between the four groups (p < 0.01).
Trend toward significant difference between the four groups.
4. Discussion
We confirm the presence of regionally selective corpus callosum atrophy in patients with early AD and report the novel finding that this selective posterior callosal area reduction is also present in older adults with amnestic MCI and in those with cognitive complaints but generally intact neuropsychological functioning. Our findings are consistent with previous reports of regionally specific posterior callosal atrophy in mild AD [23,38]. Studies showing more pervasive callosal atrophy have typically involved AD patients with moderate or severe dementia [18,20,21,23,27,34,35]. For example, one study [23] found atrophy in all callosal subregions in their total AD sample; however, when just the mild AD subset from the AD group was analyzed, only the posterior mid-body, isthmus, and splenium showed significant reduction relative to controls. Also, a study [35] compared the extent of atrophy of the hippocampus and amgydala with atrophy of the splenium in mild and moderate AD patients and found that no significant difference existed, even after normalizing for ICV. Our results further support the idea that posterior atrophy is present in the earliest stages of AD and those at increased risk for AD.
The splenium consists of fiber tracts connecting the temporal–parietal–occipital cortex, the superior parietal region, and the occipital lobe [8]. Studies utilizing [18F] fluorodeoxyglucose (FDG) positron emission tomography (PET) have shown that patients with AD have significantly reduced temporoparietal metabolism compared to healthy controls [1,15]. Also, studies using diffusion tensor imaging (DTI) have found a significant reduction in the structural integrity of the white matter tracts in the splenium of AD patients [30,33]. Our posterior callosal findings complement the results from those studies.
The presence of reduced isthmus and splenium areas in our MCI sample suggests that callosal changes may occur prior to the onset of AD. This study is also the first to show callosal changes in older adults who have cognitive complaints in the absence of significant impairment on neuropsychological testing. An early occurrence of most of the expected posterior callosal atrophy, before an individual develops a measurable psychometric memory deficit, would be consistent with our findings of a non-significant difference in C5 area between the CC, MCI, and AD groups.
Future work involving larger samples of older adults in the CC group should yield further information regarding the extent and significance of the subtle atrophic changes that may be occurring in patients with only subjective evidence of cognitive disturbance. Also, longitudinal research involving the early AD, MCI, and CC groups will help determine the onset and progression of these callosal changes. One study [34] found that the annual rate of atrophy of the total corpus callosum, rostrum, anterior truncus, and splenium of AD patients was 7.7%, 12.1%, 10.3% and 7.3%, respectively. An additional important future direction will be the application of computational anatomic approaches to model shape changes in the early preclinical stages of AD and in those at risk for AD.
Acknowledgments
This project was supported in part by funding from the NIA (R01 AG19771), Alzheimer’s Association (IIRG-94-133 and IIRG-99-1653, sponsored by the Hedco Foundation), a Richter Research Grant, the Hitchcock Foundation, the Ira DeCamp Foundation, and New Hampshire Hospital, Concord, NH. This report is derived from an undergraduate Senior Honors Thesis by Mr. Wang. The authors thank the staff of the DHMC MRI Center for their help as well as Leslie Baxter, Cheryl Brown, Kevin Carroll, Stephen Guerin, Sterling Johnson, Jessica Lilly, Chad Moritz, Katherine Nutter-Upham, Judith R. O’Jile, Heather Pixley, Jennifer Ramirez, and Henry J. Riordan of the Brain Imaging Laboratory for their contributions to patient recruitment, assessment, and scanning.
References
- 1.Alexander G, Chen K, Pietrini P, Rapoport S, Reiman E. Longitudinal PET evaluation of cerebral metabolic decline in dementia: a potential outcome measure in Alzheimer’s disease treatment studies. Am J Psychiatry. 2002;159(5):738–45. doi: 10.1176/appi.ajp.159.5.738. [DOI] [PubMed] [Google Scholar]
- 2.Andreasen NC, Cohen G, Harris G, Cizadlo T, Parkkinen J, Rezai K, et al. Image processing for the study of brain structure and function: problems and programs. J Neuropsychiatry Clin Neurosci. 1992;4:125–33. doi: 10.1176/jnp.4.2.125. [DOI] [PubMed] [Google Scholar]
- 3.Andreasen NC, Cizadlo T, Harris G, Swayze VW, O’Leary DS, Cohen G, et al. Voxel processing techniques for the antemortem study of neuroanatomy and neuropathology using magnetic resonance imaging. J Neuropsychiatry Clin Neurosci. 1993;5:121–30. doi: 10.1176/jnp.5.2.121. [DOI] [PubMed] [Google Scholar]
- 4.Andreasen NC, Rajarethinam R, Cizadlo T, Arndt S, Swayze VW, Flashman LA, et al. Automatic atlas-based volume estimation of human brain regions from MR images. J Comp Assist Tomogr. 1996;20(1):98–106. doi: 10.1097/00004728-199601000-00018. [DOI] [PubMed] [Google Scholar]
- 5.Braak H, Braak E. Neuropathological stageing of Alzheimer-related changes. Acta Neuropathol. 1991;82:239–59. doi: 10.1007/BF00308809. [DOI] [PubMed] [Google Scholar]
- 6.Braak H, Braak E. Staging of Alzheimer’s disease-related neurofibrillary changes. Neurobiol Aging. 1995;16(3):271–84. doi: 10.1016/0197-4580(95)00021-6. [DOI] [PubMed] [Google Scholar]
- 7.Cummings JL, Cole G. Alzheimer disease. J Am Med Assoc. 2002;287(18):2335–8. doi: 10.1001/jama.287.18.2335. [DOI] [PubMed] [Google Scholar]
- 8.De Lacoste MC, Kirkpatrick JB, Ross ED. Topography of the human corpus callosum. J Neuropathol Exp Neurol. 1985;44(6):578–91. doi: 10.1097/00005072-198511000-00004. [DOI] [PubMed] [Google Scholar]
- 9.Delis DC, Kramer JH, Kaplan E, Ober BA. California verbal learning test-adult version. San Antonio, TX: The Psychological Corporation; 1987. [Google Scholar]
- 10.Delis DC, Kramer JH, Kaplan E, Ober BA. California verbal learning test-adult version. 2. San Antonio, TX: The Psychological Corporation; 2000. [Google Scholar]
- 11.Delis DC, Kaplan E, Kramer JH. Delis–Kaplan executive function system. San Antonio, TX: The Psychological Corporation; 2001. [Google Scholar]
- 12.Dorion AA, Sarazin M, Hasboun D, Hahn-Barma V, Dubois B, Zouaoui A, et al. Relationship between attentional performance and corpus callosum morphometry in patients with Alzheimer’s disease. Neuropsychologia. 2002;40(7):946–56. doi: 10.1016/s0028-3932(01)00150-6. [DOI] [PubMed] [Google Scholar]
- 13.Duncan BA, Siegal AP. Early diagnosis and management of Alzheimer’s disease. J Clin Psychiatry. 1998;59(S9):15–21. [PubMed] [Google Scholar]
- 14.Folstein MF, Folstein SE, McHugh PR. Mini-mental state: a practical method for grading the cognitive state of patients for the clinician. J Psychiatry Res. 1975;12:189–98. doi: 10.1016/0022-3956(75)90026-6. [DOI] [PubMed] [Google Scholar]
- 15.Friedland R, Budinger T, Ganz E, Yano Y, Mathis C, Koss B, et al. Regional cerebral metabolic alterations in dementia of the Alzheimer type: positron emission tomography with [18F] fluorodeoxyglucose. J Comp Assist Tomogr. 1983;7:590–8. doi: 10.1097/00004728-198308000-00003. [DOI] [PubMed] [Google Scholar]
- 16.Goodglass H, Kaplan E, Barresi B. Boston diagnostic aphasia examination. 3. Philadelphia, PA: Lippincott Williams and Wilkins; 2001. [Google Scholar]
- 17.Grober E, Sliwinski M. Development and validation of a model for estimating premorbid verbal intelligence in the elderly. J Clin Exp Neuropsychol. 1991;13:933–49. doi: 10.1080/01688639108405109. [DOI] [PubMed] [Google Scholar]
- 18.Hampel H, Teipel SJ, Alexander GE, Horwitz B, Teichberg D, Schapiro MB, et al. Corpus callosum atrophy is a possible indicator of region and cell type-specific neuronal degeneration in Alzheimer disease. Arch Neurol. 1998;55:193–8. doi: 10.1001/archneur.55.2.193. [DOI] [PubMed] [Google Scholar]
- 19.Heaton RK, Chelune GJ, Talley JL, Kay GG, Curtiss G. Wisconsin card sorting test manual-revised and expanded. Odessa, FL: Psychological Assessment Resources; 1993. [Google Scholar]
- 20.Hensel A, Wolf H, Kruggel F, Riedel-Heller S, Nikolaus C, Arendt T, et al. Morphometry of the corpus callosum in patients with questionable and mild dementia. J Neurol Neurosurg Psychiatry. 2002;73:59–61. doi: 10.1136/jnnp.73.1.59. [DOI] [PMC free article] [PubMed] [Google Scholar]
- 21.Janowsky JS, Kaye JA, Carper RA. Atrophy of the corpus callosum in Alzheimer’s disease versus healthy aging. J Am Geriatrics Soc. 1996;44:798–803. doi: 10.1111/j.1532-5415.1996.tb03736.x. [DOI] [PubMed] [Google Scholar]
- 22.Jorm AF. A short form of the informant questionnaire on cognitive decline in the elderly (IQCODE): development and cross-validation. Psychol Med. 1994;24(1):145–53. doi: 10.1017/s003329170002691x. [DOI] [PubMed] [Google Scholar]
- 23.Lyoo IK, Satlin A, Lee CK, Renshaw PF. Regional atrophy of the corpus callosum in subjects with Alzheimer’s disease and multi-infarct dementia. Psychiatry Res Neuroimag Sec. 1997;74:63–72. doi: 10.1016/s0925-4927(97)00009-7. [DOI] [PubMed] [Google Scholar]
- 24.Mattis S. Dementia rating scale (DRS) professional manual. Odessa, FL: Psychological Assessment Resources; 1988. [Google Scholar]
- 25.McKhann G, Drachman D, Folstein M, Katzman R, Price D, Stadlan EM. Clinical diagnosis of Alzheimer’s disease: report of the NINCDS-ADRDA work group under the auspices of department of health and human services task force on Alzheimer’s disease. Neurology. 1984;34(7):939–44. doi: 10.1212/wnl.34.7.939. [DOI] [PubMed] [Google Scholar]
- 26.Morris JC, Storandt M, Miller JP, McKeel DW, Price JL, Rubin EH, et al. Mild cognitive impairment represents early-stage Alzheimer disease. Arch Neurol. 2001;58:397–405. doi: 10.1001/archneur.58.3.397. [DOI] [PubMed] [Google Scholar]
- 27.Pantel J, Schroder J, Jauss M, Essig M, Minakaran R, Schonknecht P, et al. Topography of callosal atrophy reflects distribution of regional cerebral volume reduction in Alzheimer’s disease. Psychiatry Res Neuroimag Sec. 1999;90:181–92. doi: 10.1016/s0925-4927(99)00018-9. [DOI] [PubMed] [Google Scholar]
- 28.Petersen RC, Smith GE, Waring SC, Ivnik RJ, Tangalos E, Kokmen E. Mild cognitive impairment: clinical characterization and outcome. Arch Neurol. 1999;56:303–8. doi: 10.1001/archneur.56.3.303. [DOI] [PubMed] [Google Scholar]
- 29.Petersen RC, Doody R, Kurz A, Mohs RC, Morris JC, Rabins PV, et al. Current concepts in mild cognitive impairment. Arch Neurol. 2001;58:1985–92. doi: 10.1001/archneur.58.12.1985. [DOI] [PubMed] [Google Scholar]
- 30.Rose SE, Chen F, Chalk JB, Zelaya FO, Strugnell WE, Benson M, et al. Loss of connectivity in Alzheimer’s disease: an evaluation of white matter tract integrity with colour coded MR diffusion tensor imaging. J Neurol Neurosurg Psychiatry. 2000;69:528–30. doi: 10.1136/jnnp.69.4.528. [DOI] [PMC free article] [PubMed] [Google Scholar]
- 31.Saykin AJ, Janssen RS, Sprehn GC, Kaplan JE, Spira TJ, O’Connor B. Longitudinal evaluation of neuropsychological function in homosexual men with HIV infection: 18-month follow-up. J Neuropsychiatry Clin Neurosci. 1991;3(3):286–98. doi: 10.1176/jnp.3.3.286. [DOI] [PubMed] [Google Scholar]
- 32.Squire LR, Wetzel CD, Slater PC. Memory complaint after electro-convulsive therapy: assessment with a new self-rating instrument. Biol Psychiatry. 1979;14:791–801. [PubMed] [Google Scholar]
- 33.Takahashi S, Yonezawa H, Takahashi J, Kudo M, Inoue T, Tohgi H. Selective reduction of diffusion anisotropy in white matter of Alzheimer disease brains measured by 3. 0 T magnetic resonance imaging. Neurosci Lett. 2002;332:45–8. doi: 10.1016/s0304-3940(02)00914-x. [DOI] [PubMed] [Google Scholar]
- 34.Teipel SJ, Bayer W, Alexander GE, Zebuhr Y, Teichberg D, Kulic L, et al. Progression of corpus callosum atrophy in Alzheimer disease. Arch Neurol. 2002;59:243–8. doi: 10.1001/archneur.59.2.243. [DOI] [PubMed] [Google Scholar]
- 35.Teipel SJ, Bayer W, Alexander GE, Bokde ALW, Zebuhr Y, Teichberg D, et al. Regional pattern of hippocampus and corpus callosum atrophy in Alzheimer’s disease in relation to dementia severity: evidence for early neocortical degeneration. Neurobiol Aging. 2003;24(1):85–94. doi: 10.1016/s0197-4580(02)00044-1. [DOI] [PubMed] [Google Scholar]
- 36.Wechsler D. Wechsler adult intelligence scale. 3. San Antonio, TX: The Psychological Corporation; 1997. [Google Scholar]
- 37.Wechsler D. Wechsler memory scale. 3. San Antonio, TX: The Psychological Corporation; 1997. [Google Scholar]
- 38.Yamauchi H, Fukuyama H, Nagahama Y, Katsumi Y, Hayashi T, Oyanagi C, et al. Comparison of the pattern of atrophy of the corpus callosum in frontotemporal dementia, progressive supranuclear palsy, and Alzheimer’s disease. J Neurol Neurosurg Psychiatry. 2000;69:623–9. doi: 10.1136/jnnp.69.5.623. [DOI] [PMC free article] [PubMed] [Google Scholar]
- 39.Yesavage JA, Brink TL, Rose TL, Lum O, Huang V, Adey M, et al. Development and validation of a geriatric depression screening scale: a preliminary report. J Psychiatric Res. 1983;17:37–49. doi: 10.1016/0022-3956(82)90033-4. [DOI] [PubMed] [Google Scholar]