

Abstract
Microtubules are nearly uniformly oriented in the axons of vertebrate neurons but are non-uniformly oriented in their dendrites. Studies to date suggest a scenario for establishing these microtubule patterns whereby microtubules are transported into the axon and nascent dendrites with plus-ends-leading, and then additional microtubules of the opposite orientation are transported into the developing dendrites. Here, we used contemporary tools to confirm that depletion of kinesin-6 (also called CHO1/MKLP1 or kif23) from rat sympathetic neurons causes a reduction in the appearance of minus-end-distal microtubules in developing dendrites, which in turn causes them to assume an axon-like morphology. Interestingly, we observed a similar phenomenon when we depleted kinesin-12 (also called kif15 or HKLP2). Both motors are best known for their participation in mitosis in other cell types, and both are enriched in the cell body and dendrites of neurons. Unlike kinesin-12, which is present throughout the neuron, kinesin-6 is barely detectable in the axon. Accordingly, depletion of kinesin-6, unlike depletion of kinesin-12, has no effect on axonal branching or navigation. Interestingly, depletion of either motor results in faster growing axons with greater numbers of mobile microtubules. Based on these observations, we posit a model whereby these two motors generate forces that attenuate the transport of microtubules with plus-ends-leading from the cell body into the axon. Some of these microtubules are not only prevented from moving into the axon but are driven with minus-ends-leading into developing dendrites. In this manner, these so-called “mitotic” motors coregulate the microtubule patterns of axons and dendrites.
Introduction
Axons are effectively unlimited in their growth potential, tend to be thin and uniform in diameter, and contain only a subset of organelles found in the cell body of the neuron. Dendrites tend to be shorter, stouter, and contain essentially the same organelles found in the cell body. These differences between axons and dendrites are accompanied by distinct patterns of microtubule polarity orientation. In the vertebrate neurons, axonal microtubules have a nearly uniform pattern, with plus-ends distal to the cell body (Heidemann et al., 1981). Dendritic microtubules have a non-uniform pattern, with many having a minus-end-distal orientation (Baas et al., 1988). Because the polarity orientation of a microtubule determines the directionality of transport of various cargoes, these distinct polarity patterns are essential for establishing and maintaining the composition of each type of process (Black and Baas, 1989; Kapitein et al., 2010). They are also thought to be a major determinant of the morphological differences between axons and dendrites (Baas and Lin, 2011).
Studies to date suggest a scenario for establishing these microtubule patterns whereby microtubules are transported into the axon and nascent dendrites with plus-ends-leading and then additional microtubules of the opposite orientation are transported into the dendrite (Baas et al., 1989). When microtubule assembly is pharmacologically suppressed, microtubules vacate the cell body and enter developing axons and dendrites with the appropriate orientations (Baas and Ahmad, 1993; Sharp et al., 1995), suggesting that the motor proteins that transport the microtubules also orient them. Cytoplasmic dynein is thought to be the principal motor that transports microtubules with their plus-ends-leading (Ahmad et al., 1998; He et al., 2005; Zheng et al., 2008; Baas and Mozgova, 2012), but less is known about how minus-end-distal microtubules specifically enter dendrites. In previous studies, when we depleted cultured neurons of kinesin-6 (also called CHO1/MKLP1 or kif23), minus-end-distal microtubules failed to move into nascent dendrites, and these processes did not acquire dendritic characteristics (Sharp et al., 1997; Yu et al., 2000). We concluded that kinesin-6, a motor protein known previously only for its role in mitosis (Nislow et al., 1992), is essential for transporting minus-end-distal microtubules into developing dendrites. However, these studies were conducted with antisense oligonucleotides, which since then have been mostly abandoned for cell biological studies because of their questionable reliability and specificity (Qiang et al., 2006; Baas and Lin, 2011).
Here, we revisited the role of mitotic kinesins in dendritic differentiation, using a more contemporary RNAi approach. We observed notable effects on dendrites but also an effect on the axon, which is interesting because kinesin-6 is believed to be absent from the axon (Sharp et al., 1997; Yu et al., 1997). In addition to kinesin-6, we investigated the effect on dendritic development of depleting kinesin-12 (also called kif15 or HKLP2), a mitotic motor that is enriched in dendrites but is not absent from the axon (Buster et al., 2003; Liu et al., 2010). Collectively, our results fortify a model in which multiple mitotic motors contribute to coregulating the microtubule patterns of axons and dendrites.
Materials and Methods
Antibodies.
We generated a new monoclonal antibody against a region within the tail domain of rat kinesin-6, raised in mouse hybridomas, which we termed ML-6, as well as a new rabbit polyclonal antibody, which we termed SL-6, raised against peptides corresponding to two different regions of rat kinesin-6, one in the tail domain and one in the stalk domain. In the case of ML-6, the specific region in the tail domain lies within the actin-binding domain of kinesin-6, which was determined to be a particularly favorable antigenic site. In the case of SL-6, the antibody was raised against two broad regions of the molecule, each stretching over 200 amino acids. Both antibodies were produced with the assistance of ABmart, with the monoclonal having excellent properties for both immunolabeling and Western blotting, and the polyclonal proving only useful for Western blotting. In addition, we used a rabbit polyclonal antibody against adult isoforms of MAP2 (provided by Dr. Itzhak Fischer, Drexel University College of Medicine, Philadelphia, PA; Nunez and Fischer, 1997), mouse monoclonal and polyclonal antibodies against β-III-tubulin (catalog #MMS 435P and #PRB 435P, respectively; Thermo Fisher Scientific), a rabbit polyclonal antibody against laminin (catalog #L9393; Sigma-Aldrich), and a monoclonal antibody to glyceraldehyde-3-phosphate dehydrogenase (GAPDH) (catalog #5174P; Cell Signaling Technology). Appropriate fluorescent or peroxide-conjugated secondary antibodies were purchased from Jackson ImmunoResearch.
Plasmids.
An EGFP-tagged kinesin-6 rat full-length (corresponding to the CHO1 isoform) construct was prepared in our laboratory using PCR with rat fetal brain cDNA as the template, followed by cutting with XhoI and BamHI (New England Biolabs). The primers used were as follows: rKif23 sense, ccg ctc gag cat gaa gtc ggc gaa ggc taa g; and rKif23 antisense, cg gga tcc cga ggt ttc ttg cgc ttg ggt tgt. In addition, we used two EGFP-tagged human kinesin-6 constructs, corresponding to the CHO1 and MKLP1 isoforms, acquired as a gift from Dr. Mishima Masanori (University of Warwick, UK) (Douglas et al., 2010). We also used two EGFP-tagged DNA constructs for human kinesin-6, obtained as a gift from Dr. Xiaoqi Liu (Purdue University, Lafayette, IN) (Liu and Erikson, 2007); one of these constructs deleted the two nuclear localization signals in the kinesin-6 tail domain, whereas the other had serine to alanine mutations (S904A/S905A) in these nuclear localization signals. A DNA construct for full-length human kinesin-12 tagged with EGFP was obtained as a gift from Dr. Thomas Mayer (University of Konstanz, Germany) (Florian and Mayer, 2011).
Western blotting.
Total protein from rat superior cervical ganglia (SCGs) and cerebral cortex was extracted from rats (of either sex) at different ages (E18, P1, P3, P6, P14, P30, and adult) and homogenized in Cell Lysis Reagent (catalog #C2978; Sigma) before being lysed in 2× SDS bromophenol blue protein lysis buffer (Bio-Rad). The total protein was quantified using the BCA Protein Assay Kit (catalog #23227; Pierce). To check for efficacy of siRNA, the total protein from cultures of rat SCG neurons (commonly referred to as cultured sympathetic neurons) was extracted 5 d after transfection [5 d in vitro (DIV)] with control or kinesin-6 siRNA. Protein concentrations from the lysates were adjusted to concentrations from samples of cerebral cortical tissue cultures after running out the samples together on an initial gel and testing with β-III tubulin antibody. The Bio-Rad Mini-PROTEAN Tetra Cell system was used for electrophoretic separation of the protein samples by following instructions from Bio-Rad Laboratories. A total of 30 μg of protein samples were loaded into each lane and resolved using 7.5% SDS-PAGE. The gel was transferred onto nitrocellulose membranes (catalog #162-0232; Bio-Rad). The blots were blocked and then probed with ML-6 (or an antibody to GAPDH as an internal loading control) at 4°C overnight. After washing, the blots were incubated with peroxidase-conjugated anti-rabbit IgG. Membrane-bound peroxidase was visualized on Pierce CL-XPosure Film after enhancement with ECL Western Blotting Substrate (catalog #24080; Pierce). Levels of kinesins-6 revealed with the ML-6 antibody were expressed as densitometric ratios with GAPDH for each group.
Cellaxess CX1 transfection.
The traditional cuvette-based nucleofection approach is only useful for transfecting neurons at the time of plating, with the expression of DNA constructs or the suppression of the targeted gene by RNAi persisting for limited periods of time. The siRNA SMARTpools that we used suppress gene expression reliably up to 5 DIV, after which a second treatment with siRNA is needed. We found chemical-based transfection approaches such as Lipofectamine to be detrimental to the vitality of SCG cultures. The Cellaxess CX1 device (Cellectricon) allows transfection of adherent neurons in long-term cultures using a series of high-voltage pulses that enable plasmids and siRNA to enter the nucleus (see Fig. 3A). Only small regions of the culture can be transfected at a time with this approach, although the transfection efficiency in those regions is high. Cells in the center of the region sometimes suffer obvious damage, so attention is focused on neurons lying more toward the periphery of the transfected region. For our studies, the CX1 device was used to boost the siRNA-based depletion of kinesin-6 or kinesin-12 in neurons at 5 DIV, into which the siRNA had first been introduced by cuvette-based nucleofection at the time of plating.
Figure 3.

Neurons depleted of kinesin-6 or kinesin-12 extend experimental dendrites that are thinner and longer than control dendrites. A, Schematic shows how the CX1 device is used to transfect adherent neurons at 5 DIV. 1, The capillary is filled with transfection solution containing DNA and siRNA. 2, The capillary is lowered into the dish containing adherent neurons. 3, The pump is activated and ejects the DNA, siRNA, and transfection solution mixture. 4, Multiple electrical pulses are applied to the capillary; these pulses activate an electrical charge to the surrounding cells. 5, This opens up the cell membrane to permit entry of the DNA and siRNA, thus transfecting the cells in the region around the capillary. B, Neurons transfected at the time of plating using nucleofection and again at 5 DIV on plated neurons using a Cellaxess CX1 system. Control, kinesin-6, or kinesin-12 siRNA was introduced at both transfections, at the time of plating and at the second transfection together with EGFP to indicate which neurons were transfected. Cells were fixed in formaldehyde and glutaraldehyde and then fluorescently labeled with MAP2 immunolabeling and phalloidin. Fluorescence images are presented in an inverted format that converts blacks to whites and whites to blacks and inverts gray levels proportionally. Scale bar, 20 μm. C, The mean dendritic width along the first 100 μm from the cell body was determined in SCG neuronal cultures that had been twice transfected with control siRNA (n = 30), kinesin-6 siRNA (n = 25), or kinesin-12 siRNA (n = 18) at 7 DIV (see Table 1). The dendritic width of neurons transfected with kinesin-6 siRNA was significantly smaller than control neurons for the first 60 μm. The dendritic width of neurons transfected with kinesin-12 siRNA was significantly smaller than in control neurons up to and beyond 100 μm. D, The proportion of experimental dendrites that grew longer than 150 μm (orange and red) increased in kinesin-6 siRNA (20%) and in kinesin-12 siRNA (20%) compared with control cultures (4.3%); n = 20.
The CX1 device was set up as described in the protocol provided by Cellectricon. Inlet and outlet tubes were attached to the pump, pulse generator, and the safety box, and water was placed at the free end of inlet tube. Before electroporation, the pump was flushed three times with water and calibrated to secure high accuracy of filling and dispensing. DNA electroporation solution was mixed and drawn up using the electrode capillary of the safety box. The electroporation and calibration protocols were input into the CX1 command program in the computer and sent via the pulse generator to the safety box electrode. We achieved the most efficient transfection of SCG neurons by using the following protocol, modified from another laboratory (Ascaño et al., 2009): dispense volume, 8 μl; dispense rate, 8 μl/min; voltage, 200 V; pulse length, 25 ms; interval, 10 s; number of pulses, 3; start electroporation, 40 s. Pulse length could be changed to vary the transfection efficiency: A 25 ms pulse enabled transfection of ∼20 neurons in a dish with a plating density of 20,000 neurons in the glass-bottomed dishes described below.
Cell culture and siRNA treatment.
For the generation of primary cultures, SCGs were dissected from P1 pups (of either sex), dissociated, and plated as described previously (He and Baas, 2005). For studies on axons, siRNA (for kinesin-6, kinesin-12, or control) was introduced before plating the dissociated cells with a Nucleofector device (catalog #VSPI-1003; Amaxa) as described previously (He et al., 2005). Neurons were plated densely onto 35 mm plastic dishes that had been treated with 1 mg/ml poly-d-lysine (catalog #P0899; Sigma) and laminin (catalog #23017-015; Sigma), after which the neurons were allowed to grow axons for 3 DIV, sufficient time for the siRNA to deplete the relevant protein. Neurons were then dislodged and replated onto 35 mm glass-bottomed dishes with a 1 cm hole covered by a glass coverslip (catalog #P35G-1.5-14.C; Matek). For most of the studies on axons, unless otherwise indicated, we did not add laminin to the replated cultures because we found it more straightforward to measure morphological parameters of axons such as their length and branching patterns when the axons were more slowly growing. For studies on dendrites, no replating was done. Rather, neurons were transfected with siRNA before plating and plated directly on the glass coverslips in the presence of Matrigel (catalog 35-4234; BD Bioscience) to hasten dendritic development. Under these conditions, dendrites became visible in cultures by 5 DIV, which is also the point at which the siRNA could no longer be relied on to keep the targeted protein levels down. Therefore, at 5 DIV, we used the CX1 device (see above) to provide a boost of siRNA in cells occupying the center of the coverslip. In a small number of experiments, rat RFL-6 fibroblasts were used as described previously (Qiang et al., 2006).
Kinesin-6 and kinesin-12 siRNA SMARTpools (catalog VC30002; Sigma) or nonspecific control siRNA (catalog #AM4636; Ambion) were used at a concentration of 10 μmol/L for nucleofection and 1 μm for CX1 electroporation. DNA (EGFP, EGFP–EB3, EGFP–tubulin, EGFP–kinesin-12, or EGFP–kinesin-6) was used at 10 μg of DNA per 1 million cells for nucleofection or at 10 μg/100 μl for CX1 electroporation. Extra electroporation solution (MIR50112; Mirius) was calculated into the final volume to ensure that no air bubbles were created during the pump filling process.
Quantitative fluorescence microscopy.
Immunofluorescence was conducted as described previously (Liu et al., 2010), as was phalloidin-based labeling of filamentous actin (F-actin). Neurons were fixed with 4% paraformaldehyde and glutaraldehyde or with cold methanol. Fixation was performed at different times: at 24 or 31 h after replating or at 7 DIV. Primary antibodies were incubated overnight, and the secondary antibodies were applied the next day. All images were taken using an Axiovert 200 inverted microscope (Carl Zeiss), and image analysis was done using the Axiovision 4.6 software. Each cell was imaged with a 40× objective, and images used for quantification did not contain saturated pixels in axons or dendrites. Only neurons with clearly definable axons and dendrites that were not obscured by neighboring cells were chosen.
To quantify the levels of kinesin-6 in younger neurons before dendritic development, images were taken of cultures that had been fixed in methanol at 24 h after replating and then double labeled with the ML-6 and β-III tubulin antibodies. To quantify the level of kinesin-6 in older, dendrite-bearing neurons, images were taken of cultures fixed in methanol at 7 DIV and then prepared in the same manner. For these latter experiments, the polyclonal β-III tubulin antibody was used. A box was drawn over a region of the cell body, axon, or dendrite, and the mean pixel intensity was obtained for ML-6 or β-III tubulin in the relevant channels. Both the background pixel value and a value obtained from controls prepared with no primary antibodies were subtracted to obtain the actual pixel value. Other cultures were double labeled for MAP2 and β-III tubulin (using the monoclonal β-III tubulin antibody) or double-labeled for ML-6 and MAP2.
To assess reduction in ML-6 signal as a result of siRNA treatment, younger cultures were prepared as indicated above. For older cultures, we took a somewhat different approach, focusing specifically on those neurons expressing EGFP as an indicator that they had been transfected a second time with the CX1 device. For these cultures, we calculated the axon/dendrite ratio (ADR). Neurons were transfected with siRNA at the time of plating using the nucleofector and then a second time using the CX1 device with EGFP and siRNA at 5 DIV, before fixing at 7 DIV (see above). We calculated the mean fluorescence intensity per pixel of ML-6 (ML-6.ADR) in the axon and dendrite by drawing a box over the corresponding regions and subtracting the background as described above. We normalized this fluorescence intensity by dividing the ratio of the mean fluorescence per pixel in the axon by the mean fluorescence per pixel in the dendrite of β-III tubulin (Tubulin). We repeated this measurement for the dendritic marker, MAP2, and the control marker, EGFP fluorescence, to derive EGFP.ADR, and we also normalized this to the Tubulin.ADR. The following equations were used:
 |
 |
where ADR is axon/dendrite ratio according to the fluorescence associated with tubulin labeling in the axon or dendrite. We drew conclusions based on the premises that ADR = 1 indicates that a protein is equally distributed in the axon and dendrite, that ADR < 1 indicates that the protein is concentrated in the dendrite, and that ADR > 1 indicates that the protein is concentrated in the axon. EGFP.ADR was then defined as 1, and ML-6.ADR or MAP2.ADR were scaled accordingly.
Determination of microtubule polarity orientation.
To ascertain the polarity orientation of microtubules in dendrites, we used the contemporary method of expressing in the neurons fluorescently tagged EB3 (Lin et al., 2011). EB3 appears, when expressed as an EGFP fusion protein, as fluorescent comets at the plus ends of microtubules as they undergo assembly (Stepanova et al., 2003; Nadar et al., 2008). EGFP–EB3 was transfected into neurons together with control, kinesin-6, or kinesin-12 siRNA, as described above, using the CX1 device at 5 DIV. Dendrites of neurons expressing EGFP–EB3 at moderate levels were imaged at 7 DIV, given that high expression of EB3 can cause abnormal microtubule bundling. Images of dendrites were obtained every second for 100 s at an exposure time of 300 ms with 1 × 1 binning using Axiovision 4.6. The number of comets moving forward and backward through 20 μm regions along the length of the dendrite was counted, and the width at each region was measured. Forward-moving comets corresponded to plus-end-distal microtubules, whereas backward-moving comets corresponded to minus-end-distal microtubules. All dendrites with lengths in the range of 100 and 300 μm were divided into proximal, middle, and distal regions, and the numbers of forward-moving and backward-moving comets in each region were tallied. The percentage of comets moving in the forward direction was calculated for each region. The comet trajectories of a few of the transfected neurons were also traced using MetaMorph software, and a kymograph was generated for each experimental condition.
Microtubule transport assay.
The microtubule transport assay for axons was performed as described previously (Hasaka et al., 2004; Liu et al., 2010). Neurons were transfected with either control siRNA or kinesin-6 siRNA together with EGFP–tubulin and replated onto coverslips at 3 DIV (see above). Laminin was added to the cultures, and axons were permitted to grow anew overnight. Neurons expressing EGFP-tubulin were photobleached with the Mosaic device (Photonics) for 300 ms in a 30 μm region along the axon. Thinner axons are needed in this technique to visualize microtubule movements, and the addition of laminin to cultures assisted in this regard because faster growing axons are generally thinner than slower growing axons. Time-lapse images were taken at 200–300 ms exposure at 2 s intervals for 6 min. Microtubules moving through the photobleached region were scored over time. Frequencies for the anterograde and retrograde directions were calculated by dividing the total number of movements by the total imaging time for individual movies.
Growth cone turning assay.
A substrate-based growth cone turning assay was performed as described previously (Liu et al., 2010). Neuronal cultures, transfected with control or kinesin-6 siRNA, were replated onto Matek glass-bottomed dishes that had been coated with 0.1 mg/ml poly-d-lysine, with a 50 μl spot of laminin (25 μg/ml) in the center (catalog #23017-015; Invitrogen). The laminin had been incubated at 37°C for 3 h before being washed. Neurons were grown on the laminin spot for 24 h until most of the growth cones had reached the border and either crossed or turned. The cultures were fixed and double immunolabeled for laminin and mouse β-III tubulin. Fluorescence images were acquired and quantified using Axiovision 4.6 as described previously (Nadar et al., 2008). Cultures were also labeled with β-III tubulin and phalloidin to quantify the mean growth cone size.
Statistical analyses.
All data analyses, statistical comparisons, and graphs were generated using Excel (Microsoft). Data represent mean ± SEM of three or four separate experiments for each assay. Comparison was performed using a two-tailed t test or univariate ANOVA. For statistical analysis, the mean difference was considered to be significant at the 0.05 level.
Presentation of images.
Figures were processed with Adobe Photoshop CS2 (Adobe Systems). In most cases, fluorescence images were subjected to the “invert” function in Adobe Photoshop that converts blacks to whites and whites to blacks and inverts gray levels proportionally, because we found that fine details were more clearly visualized. The resulting images are referred to as “inverted images.”
Results
Kinesin-6 levels and distribution in neurons
Kinesin-6 is expressed as two isoforms in mammals, CHO1 (105 kDa) and MKLP1 (95 kDa), the latter being a minor splice variant that lacks the actin-binding domain present in the full-length isoform (Kuriyama et al., 2002). In previous studies, we used a monoclonal antibody called CHO1 to immunolabel cultures of rat SCGs and hippocampal neurons (Sharp et al., 1997). The CHO1 antibody is an IgM (raised against hamster sequence) not sufficiently sensitive to detect typical protein levels in whole-cell extracts on Western blots. In immunofluorescence analyses with this antibody, there was detectable labeling in cell bodies and dendrites but not in immature processes or axons at any stage of development. Here, we developed a new monoclonal IgG antibody, raised against a region within the actin-binding domain of rat kinesin-6 (Fig. 1A; see Materials and Methods). This antibody, which we named ML-6, is able to detect the same midzonal/midbody structures as the CHO1 antibody in mitotic cells (Fig. 1B) and able to reveal robust, specific and appropriate bands on Western blots. Given that it was raised against a site within the actin-binding domain, ML-6 recognizes CHO1 but not MKLP1. We also generated a polyclonal antibody called SL-6 against two broad regions of rat kinesin-6: a region containing the tail domain and the actin-binding domain but also a region within the stalk domain. Thus, SL-6 should recognize both isoforms of kinesin-6, which it proved capable of doing on Western blots from fibroblasts (data not shown). However, SL-6 did not prove useful for immunofluorescence.
Figure 1.

Kinesin-6 is expressed in the CNS and PNS during development. A, Schematic representation showing kinesin-6 with its motor domain, neck-linker, actin-binding domain, and nuclear localization sites. The new monoclonal kinesin-6 antibody (ML-6) recognizes a site within the actin-binding domain of the CHO1 protein. B, Immunolabeling of RFL-6 rat fibroblast with the ML-6 antibody reveals strong signal in the midbody region during the final stage of cell division (and also in midzonal regions in earlier phases of mitosis; data not shown). Scale bar, 10 μm. C, Western blot of kinesin-6 (using the ML-6 antibody) in rat cortex brain lysate at E18, P1, P6, P14, P30, and adult (Ad). D, Western blot of kinesin-6 (using the ML-6 antibody) in rat SCG lysate at E18, P1, P3, P6, P14, P30, and adult. The band detected by ML-6 migrates at 105 kDa (top row), whereas the band detected by the monoclonal GAPDH antibody, internal control, migrates at 37 kDa (bottom row). Levels of kinesins-6 revealed with the ML-6 antibody were expressed as densitometric ratios with GAPDH for each group. Kinesin-6 protein expression decreases during development in the cortex and SCG with a greater decrease in the cortex compared with SCG. Horizontal axis represents days before and after birth. Similar results were obtained with the SL-6 antibody (data not shown).
In recent studies, we used quantitative Western blotting to assess the levels of two other motor proteins mainly known for their participation in mitosis (kinesin-5 and kinesin-12) in the rodent PNS and CNS (Liu et al., 2010; Lin et al., 2011). To achieve the same goal with kinesin-6, we conducted studies of this kind on homogenates from rat cortex and SCG at various ages (Figs. 1C,D). Western blotting was not possible with the CHO1 antibody used for our previous studies (Sharp et al., 1997), because this antibody is not sensitive enough to detect kinesin-6 in cells unless enriched cytoskeletal fractions are prepared. Using the ML-6 antibody, we detected a single strong band corresponding to the mobility of the CHO1 isoform. This same single band was also detected by the SL-6 antibody (Fig. 2G), suggesting that the MKLP1 isoform is either not expressed in rat neurons or is expressed below detectable quantities. As with kinesin-5 and kinesin-12, the levels of kinesin-6 in the cortex and ganglia are high in the embryo and then progressively diminish during development. The decline is greater and more rapid in the cortex (Fig. 1C) than in the ganglia (Fig. 1D), which is also the case with kinesin-12 (Liu et al., 2010). Faint bands are detectable in adult, although it is important to keep in mind that there are mitotic cells as well as neurons in the tissue that contribute to the signal. We have made similar observations to these at the mRNA level during development of the nervous system for all three mitotic motors (Ferhat et al., 1998a,b; Liu et al., 2010; Lin et al., 2011), as has the Banker laboratory in a recent survey on cultured hippocampal neurons (Silverman et al., 2010). These results are consistent with kinesin-6 functioning in the establishment and early maintenance of microtubule organization in neurons but suggest that kinesin-6 is not as important for the long-term maintenance of the neuronal microtubule arrays in adult life.
Figure 2.
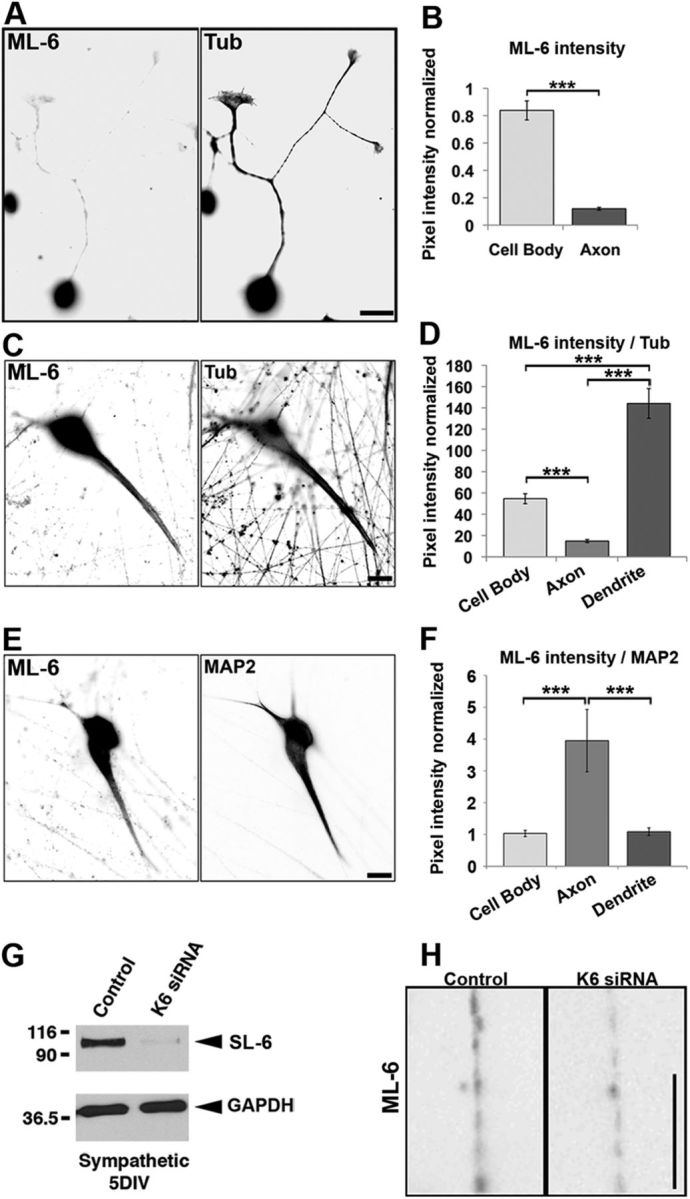
Kinesin-6 distribution in neurons. SCG neurons were cultured for 24 h or 7 DIV, fixed with cold methanol, and double labeled with ML-6 and the β-III tubulin (Tub) antibodies (A–D) or double labeled with ML-6 and MAP2 antibodies (E, F). Fluorescence images are presented in an inverted format that converts blacks to whites and whites to blacks and inverts gray levels proportionally. A, At 24 h, ML-6 strongly labels the cell body, but labeling in the axon is barely detectable. Scale bar, 10 μm. B, Quantification of ML-6 labeling intensity in axons shows very little signal in the axon relative to the cell body. Data are represented as mean ± SEM intensity ratio (relative to β-III tubulin, minus the secondary antibody background): cell body intensity = 0.84 ± 0.07; axon intensity = 0.12 ± 0.01 (n = 20, p < 0.001). C, At 7 DIV, ML-6 localizes strongly to the cell body and dendrites, but axons remain dim by comparison. Scale bar, 20 μm. D, Quantification of ML-6 labeling intensity ratioed to β-III tubulin shows significantly higher cell body labeling than axonal labeling and significantly higher dendritic labeling than cell body labeling. Data are represented as mean ± SEM intensity ratio ML-6/β-III tubulin (minus the secondary antibody background): cell body intensity = 54.61 ± 4.70 (n = 23); axon intensity = 14.76 ± 1.44 (n = 23, p < 0.001); dendrite intensity = 144.12 ± 14.00 (n = 23, p < 0.001). E, At 7 DIV, neurons double labeled for MAP2 and ML-6 show somatodendritic enrichment of both, with the compartmentation appearing to be somewhat more robust for MAP2 than kinesin-6. Scale bar, 20 μm. F, Quantification of ML-6 labeling intensity ratioed to MAP2 shows significantly greater MAP2 labeling in axons compared with cell bodies or dendrites. Data are represented as mean ± SEM intensity ratio ML-6/MAP2 (minus the secondary antibody background): axon intensity = 3.95 ± 0.98 (n = 20); cell body intensity = 1.03 ± 0.09 (n = 20, p < 0.001); dendrite intensity = 1.09 ± 0.12 (n = 20, p < 0.001). G, The 5 DIV cultures transfected with either control siRNA or kinesin-6 siRNA at plating and collected for Western blot analysis. Blots probed with SL-6 show that kinesin-6 remained thoroughly depleted at 5 DIV. Comparable results were obtained with the ML-6 antibody (data not shown). Note that the SL-6 antibody produces a single band in rat neurons, indicating that the MKLP1 isoform of kinesin-6 is not expressed in neurons or expressed at levels beneath detection. H, Magnified (inverted) images of axonal regions of a control siRNA neuron and a kinesin-6 siRNA neuron labeled with ML-6. Intensity is only marginally lower in the latter compared with the former, suggesting that the faint signal observed in axons may be attributable at least in part to nonspecificity in the primary antibody, when used for immunolabeling. Scale bar, 5 μm.
In our previous immunolabeling experiments with the CHO1 antibody on cultured rat hippocampal and SCG neurons, we reported that, before dendritic development, the fluorescence signal was only detectable in the cell body but then, later in development, expanded into developing dendrites (Sharp et al., 1997). Given that the CHO1 antibody is not terribly robust and that these results were never quantified, we felt that it was important to revisit this result with quantitative rigor, using our new ML-6 antibody. Cultures were fixed either at 24 h after plating or left to grow until 7 DIV, to represent developmental stages before and after dendritic development. Cultures were fixed and double labeled with ML-6 and a polyclonal antibody to either MAP2 or β-III tubulin. MAP2 is an established marker of dendrites (Caceres et al., 1983; Dotti et al., 1988), and β-III tubulin is similarly distributed in microtubules of all neuronal compartments. Other cultures were double labeled with the MAP2 polyclonal antibody and a monoclonal antibody for β-III tubulin. For quantification of kinesin-6 levels, values were expressed as ratios to β-III tubulin levels, to account for differences in the thickness of cell bodies, dendrites, and axons. For presentation purposes, we have chosen to display inverted images because they provide greater clarity, especially when signals are dim. We should note that SCG neurons in culture do not undergo the same developmental stages as hippocampal neurons; rather than extending multiple immature processes, only one becomes the axon, after which the others become dendrites as hippocampal neurons do (Dotti et al., 1988), SCG neurons initially extend one or more axons, after which the morphology of the neuron is recrafted such that it bears a single axon and multiple dendrites (Higgins et al., 1991).
Consistent with our previous result with the CHO1 antibody, at 24 h, the cell body displayed strong fluorescence signal, whereas the axon was extremely dim and almost undetectable. Quantification of the signals indicated that the ratio of kinesin-6/β-III tubulin labeling was as intense in the axon as in the cell body (Fig. 2A,B). The labeling with ML-6 then spreads into the dendrites in the 7 DIV cultures, with the fluorescence signal remaining low in the axon (Fig. 2C). In these older cultures, the ratio of ML-6/β-III tubulin labeling in the axon was of that in the dendrite, with the cell body ratio being approximately one-third of that in the dendrite (Fig. 2D). Double-labeling studies on MAP2 and β-III tubulin gave approximately similar results as ML-6 and β-III tubulin double labels, except that we had to use the monoclonal β-III tubulin antibody (see below; see Fig. 4B). Indeed, when the 7 DIV cultures were double labeled with ML-6 and the MAP2 antibody, the resulting images were quite similar, with the signal from dendrites and cell bodies higher than that in the axon (Fig. 2E). However, the fluorescence signal from the axon was stronger in the case of ML-6, and quantification confirmed that there was approximately four times more ML-6 signal in the axon relative to the dendrite and cell body than was the case for the MAP2 antibody (Fig. 2F).
Figure 4.
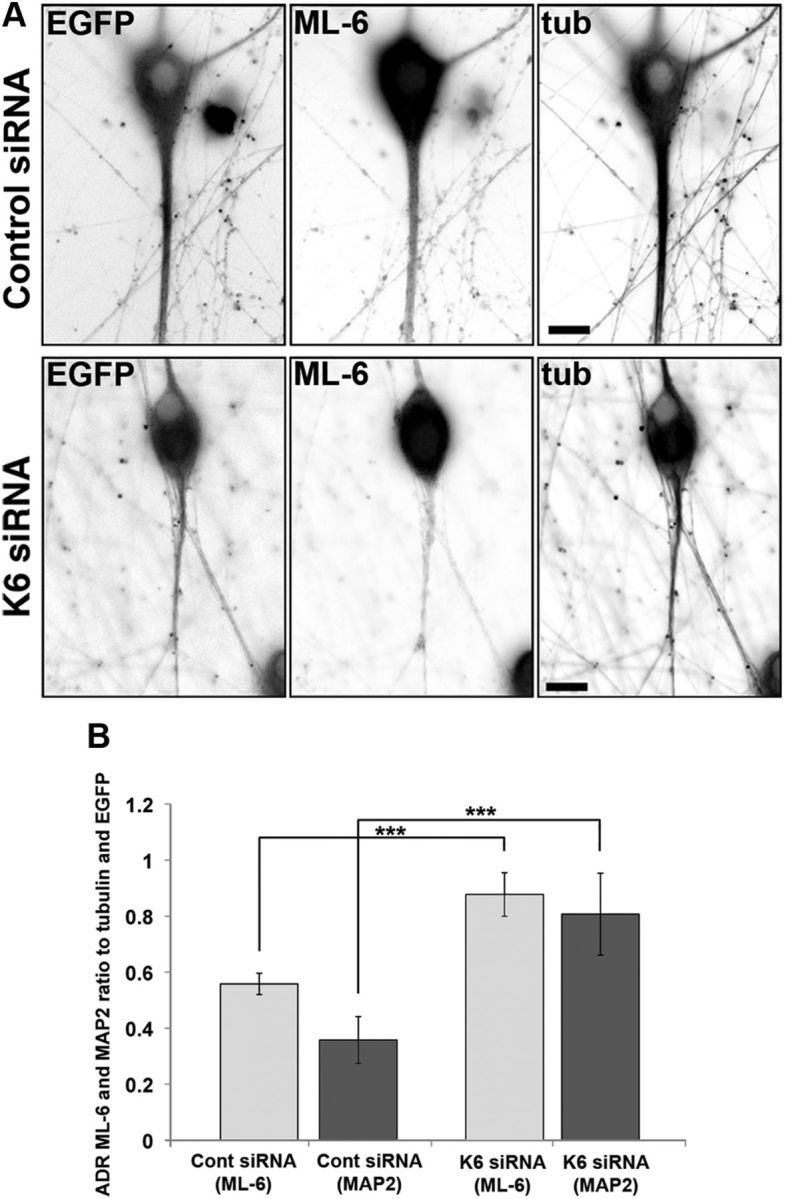
Depletion of kinesin-6 causes MAP2 and residual ML-6 immunolabeling to become redistributed in the neuron. SCG neurons were transfected with siRNA at plating and then with EGFP and control or kinesin-6 siRNA at 5 DIV using the CX1 device. Neurons were fixed in methanol at 7 DIV and double labeled with ML-6 and β-III tubulin (tub). Fluorescence images are presented in an inverted format that converts blacks to whites and whites to blacks and inverts gray levels proportionally. A, At 7 DIV, neurons transfected with control siRNA exhibited thick dendrite morphology, whereas neurons transfected with kinesin-6 siRNA only exhibited thin experimental dendrites. B, Quantification of the mean ADR in neurons double labeled with ML-6 and β-III-tubulin or ML-6 and MAP2 at 7 DIV. Data are represented as mean ADR (see Materials and Methods), in which ADR for ML-6 is significantly lower in control neurons than kinesin-6-depleted neurons. In control neurons, ML-6.ADR = 0.56 ± 0.04. In cultures depleted of kinesin-6, ML-6.ADR = 0.88 ± 0.08, (n = 30; p < 0.001). In control neurons, MAP2.ADR = 0.36 ± 0.08. In cultures depleted of kinesin-6, MAP2.ADR = 0.81 ± 0.15 (n = 20; p < 0.001).
For RNAi-based depletion of kinesin-6 from cultured neurons, we used an siRNA SMARTpool as in our previous studies with other molecular motors (He et al., 2005; Myers and Baas, 2007; Nadar et al., 2008; Liu et al., 2010), traditional microtubule-associated proteins (Qiang et al., 2006), microtubule-severing proteins (Qiang et al., 2010), and doublecortin (Tint et al., 2009). For this approach, the siRNA is introduced by electroporation (using the Amaxa Nucleofector) into dissociated cells before plating as a mixture of four different sequences specific to the target gene. In our experience using this approach on various types of neurons, the siRNA is taken up by almost all of the cells, particularly in the case of SCG neurons (Tint et al., 2009), obviating the need to routinely confirm protein depletion within each individual neuron. Similar to other proteins we have studied, we found that this approach is reliable for suppressing protein levels to below 5% of control levels for at least 5 d, as assessed by Western blotting (Fig. 2G). If we immunolabel these kinesin-6-depleted neurons with the ML-6 antibody after replating them to permit axons to grow anew, there remains some fluorescence signal (Fig. 2H; see also Fig. 4A because the same was true for dendrites), suggesting that there is a contribution of nonspecificity to the signal from the primary antibody. Similarly, on fibroblasts, the strong midbody/midzonal fluorescence vanished with siRNA depletion of kinesin-6, but the hazy diffuse staining remained (data not shown). On the basis of these observations, we would conclude that kinesin-6 is probably about as somatodendritic as MAP2, but we cannot dismiss the possibility that some small amount of kinesin-6 may be present in the axon and perhaps could be functionally important. Future experiments on the posttranslational modification of kinesin-6 and/or the tubulin subunits that comprise microtubules in each neuronal compartment could shed light on how kinesin-6 is partitioned in the neuron.
Depletion of kinesin-6 or kinesin-12 by siRNA compromises dendritic development
Introducing siRNA at the time of plating presented a limitation for achieving our present goals. Beyond 5 d, the target protein begins to be reexpressed, albeit asynchronously among the cells in the culture (data not shown). Although this timeframe is sufficient to study the effect of protein depletion on axonal growth, branching, and navigation, it is not sufficient to study the formation of dendrites. Indeed, after day 5, thin dendrites of neurons that had been depleted of kinesin-6 or kinesin-12 began to thicken, presumably as a result of restoration in the expression of the targeted proteins (data not shown). Although other workers studying dendrites have successfully used viral-based shRNA techniques for long-term knockdown of protein expression (Jaworski et al., 2009), we wanted to remain consistent with our recent body of work using siRNA. We therefore used the CX1 device to re-electroporate siRNA into a portion of the neurons at 5 DIV to ensure that expression remained suppressed over the subsequent days required for dendrites to become apparent in these cultures. For the CX1 transfection, which only effects a fraction of the cells in the culture, we combined the siRNA with an EGFP plasmid so that neurons taking up the siRNA were also rendered fluorescent (Fig. 3A; see Materials and Methods). In addition to studying kinesin-6 in this manner, we also included kinesin-12 in these studies because it is another mitotic motor protein known to become concentrated in dendrites as they develop (Buster et al., 2003).
Cultures were left to grow for an additional 2 d after the CX1 transfection before being fixed and double labeled for immunofluorescence-based visualization of MAP2 and phalloidin-based visualization of F-actin. Control neurons were able to grow thick tapering dendrites. Neurons depleted of either kinesin-6 or kinesin-12 displayed processes that were longer and thinner with a less tapering morphology than control dendrites; these processes still labeled for MAP2 but less so than control dendrites. We refer to these processes as experimental dendrites (Fig. 3B). Phalloidin labeling did not reveal obvious changes in the F-actin distribution or differences in branching between the experimental dendrites and their control counterparts. Depletion of kinesin-6 significantly decreased dendritic width along the first 100 μm portion and further caused a decrease at their more distal regions. For example, at 20 μm from the cell body, dendritic width was reduced by 34% relative to control dendrites as a result of kinesin-6 siRNA treatment. At the same distance from the cell body, dendritic width reduced by 31% as a result of kinesin-12 siRNA treatment (Fig. 3C, Table 1). Depletion of kinesin-6 and kinesin-12 causes a greater proportion of experimental dendrites to grow beyond 150 μm (20% in both cases) compared with control dendrites, at just 4.3%. Neurons with kinesin-6 and kinesin-12 depletion were even able to grow experimental dendrites longer than 200 μm (2.6 and 5%, respectively; Fig. 3D).
Table 1.
Dendritic width
| Distance from cell body at which dendritic width was measured (μm) | Control siRNA (μm) | Kinesin-6 siRNA (μm) | Kinesin-12 siRNA (μm) |
|---|---|---|---|
| 20 | 5.85 ± 0.34 | 3.87 ± 0.30 | 4.02 ± 0.31 |
| 40 | 4.54 ± 0.31 | 2.92 ± 0.26 | 3.01 ± 0.29 |
| 60 | 3.43 ± 0.21 | 2.57 ± 0.25 | 2.16 ± 0.29 |
| 80 | 2.74 ± 0.28 | 2.28 ± 0.27 | 1.55 ± 0.20 |
| 100 | 2.72 ± 0.36 | 2.11 ± 0.29 | 1.19 ± 0.19 |
Data represented as mean ± SEM (μm).
To confirm depletion of kinesin-6, cultures grown for 7 DIV were fixed in methanol and double labeled with ML-6 and β-III tubulin or with MAP2 and β-III tubulin. Neurons displaying EGFP fluorescence before fixation were considered to be transfected with control or kinesin-6 siRNA. Fluorescent neurons transfected with kinesin-6 siRNA had thinner, longer experimental dendrites compared with dendrites of neurons transfected with control siRNA. ML-6 labeling was notably diminished relative to control neurons, after normalization for nonspecific background antibody labeling (to be consistent with Fig. 2H) (Fig. 4A). Quantitative analysis of the ADR of kinesin-6 in 7 DIV cultures (see Materials and Methods) showed that ML-6.ADR increased by 57% after kinesin-6 was depleted (Fig. 4B). Similarly, MAP2.ADR increased by 45% after kinesin-6 was depleted. This showed that ML-6 labeling is normally concentrated in dendrites, but after kinesin-6 depletion, ML-6 distribution becomes similar to tubulin and EGFP, which is consistent with the remaining fluorescence signal from the antibody being nonspecific. MAP2 showed a similar redistribution as a result of kinesin-6 depletion, which fortifies the conclusion that the experimental dendrites lose many features of their dendritic identity, as was reported in our previous studies using the antisense approach (Sharp et al., 1997).
Depletion of kinesin-6 or kinesin-12 alters microtubule polarity orientation in experimental dendrites
To ascertain the polarity orientation of microtubules in dendrites, we used the contemporary method of expressing in the neurons EGFP–EB3, which appears as fluorescent comets at the plus ends of microtubules as they undergo assembly (Stepanova et al., 2003; Kollins et al., 2009). As described in Materials and Methods, EGFP–EB3 was transfected into neurons together with control, kinesin-6, or kinesin-12 siRNA. Neurons were transfected with siRNA at the time of plating and again with EGFP–EB3 at 5 DIV together with siRNA, using the CX1 device. Neurons were then imaged at 7 DIV. In previous studies on the dendrites of cultured rat hippocampal or SCG neurons, we used the hooking method for ascertaining microtubule polarity orientation (Baas et al., 1988, 1989, 1991; Baas and Lin, 2011); in these studies, we generally found dendrites to display ∼45% minus-end-distal microtubules in proximal and middle regions of the dendrites and lower percentages in the more distal half of the dendrite. Studies using the EB3 comet approach generally documented a percentage of the microtubules with a minus-end-distal orientation in the proximal and middle regions of the dendrite somewhat lower than 45% (Stepanova et al., 2003; Kollins et al., 2009), with no indication of a difference in the more distal half. Here, we observed that as well, suggesting that the two methods are not identical with regard to the populations of microtubules they are able to detect. The EB3 comet approach can only detect microtubules undergoing dynamic assembly events, so it may be that the minus-end-distal dendrites in dendrites, as a population, are more stable than those with a plus-end-distal orientation. Even so, the EB3 methodology proved adequate for our purposes.
Depletion of kinesin-6 caused a significant decrease in minus-end-distal microtubules, as marked by backward-moving comets in the experimental dendrites (Fig. 5A). Similarly, depletion of kinesin-12 also caused a significant decrease in minus-end-distal microtubules in experimental dendrites (Fig. 5A). In control neurons, the proportion of minus-end-distal microtubules was 36%, in the proximal dendrite. This percentage decreased significantly to 22% in neurons depleted of kinesin-6 or kinesin-12 (Fig. 5B). A similar decrease in the proportion of minus-end-distal microtubules was observed in the middle and distal regions of the dendritic shaft. This suggests that the proportion of minus-end-distal microtubules, as marked by EGFP–EB3 comets, decreased in the dendritic shaft of neurons depleted of either kinesin-6 or kinesin-12 relative to their control counterparts. For some dendrites, the individual EGFP–EB3 comets were tracked for the duration of the movie, and a kymograph was generated (Fig. 5C).
Figure 5.

Experimental dendrites of neurons depleted of kinesin-6 or kinesin-12 have fewer minus-end-distal microtubules than control dendrites. SCG neurons were transfected with control, kinesin-6, or kinesin-12 siRNA at the time of plating and again at 5 DIV with EGFP–EB3 together with an siRNA boost before being imaged at 7 DIV. A, The number of forward-moving EB3 comets in dendrites (or “experimental dendrites”), corresponding to plus-end-distal microtubules (green arrows), and the number of backward-moving EB3 comets in dendrites, corresponding to minus-end-distal microtubules (red arrows), were quantified. Top panels show representative dendrites or experimental dendrites of neurons transfected with EGFP–EB3 in each condition. Bottom panels show magnified images of the inset box area for each corresponding dendrite or experimental dendrite, with representative arrows indicating the direction of EGFP–EB3 comet movement in one representative frame of a movie. There is a greater proportion of forward-moving EB3 comets in dendrites of kinesin-6 or kinesin-12 siRNA transfected neurons compared with neurons transfected with control siRNA. Scale bar, 10 μm. B, The percentage of backward-moving comets in experimental dendrites of kinesin-6- or kinesin-12-depleted neurons was significantly lower than the percentage in control dendrites (n = 25). This is true in the proximal, middle, and distal portion of the dendrite. Data are represented as mean ± SEM percentage: control (proximal) = 35.79 ± 2.08; control (middle) = 36.76 ± 2.01; control (distal) = 34.94 ± 1.50; kinesin-6 siRNA (proximal) = 22.30 ± 2.37; kinesin-6 siRNA (middle) = 25.22 ± 1.96; kinesin-6 siRNA (distal) = 25.97 ± 2.27; kinesin-12 siRNA (proximal) = 22.93 ± 1.67 (p < 0.001); kinesin-12 siRNA (middle) = 24.23 ± 2.68; kinesin-12 siRNA (distal) = 23.46 ± 2.04 (p < 0.001). C, Kymographs show that, in the dendrites of control neurons, many EGFP–EB3 comets move in either the forward or backward direction, whereas in the experimental dendrites of neurons depleted of kinesin-6 or kinesin-12 with siRNA, relatively more comets move in the forward direction. Green arrows mark the forward-moving comets (negative slope traces). Red arrows mark backward-moving comets (positive slope traces). Scale bar, 10 μm.
Depletion of kinesin-6 increases axonal length but has no effect on axonal number or branching
In recent studies, we reported that depleting either kinesin-5 or kinesin-12 from cultured neurons results in a notable increase in axonal length as well as a notable increase in the frequency of microtubule transport in the axon (Myers and Baas, 2007; Liu et al., 2010). On the basis of the absence or near absence of kinesin-6 from the axon, we initially predicted that depletion of kinesin-6 should have no effect on the axon. However, in our most recent study on kinesin-5 and kinesin-12, we speculated that these motors might act in part at the level of the cell body to restrict the flow of short microtubules into the axon and that this might be a significant factor in the growth rate of the axon (Liu et al., 2010). If this is the case, we might actually expect depletion of kinesin-6 to have a similar effect on axonal length as depleting these two other motors. To investigate this possibility, we pursued the same strategy as in our previous studies on the other two motors. Neurons were transfected with kinesin-6 siRNA, plated densely on plastic and then replated at 3 DIV on glass to permit axons to grow anew, in the near absence of kinesin-6. For these experiments, we chose not to add laminin to the replated cultures because we found it more straightforward to measure morphological parameters of the axons when they were more slowly growing. Reminiscent of our previous results on the other two motors, after 24 and 31 h, the kinesin-6-depleted neurons had grown significantly longer axons than controls (Fig. 6A,B). The mean length of the longest axon per cell body was 84 and 73% greater for kinesin-6-depleted neurons relative to their control counterparts, at 24 and 31 h after replating, respectively (Fig. 6C). The total length of all of the axons per cell body also increased significantly for kinesin-6-depleted neurons compared with controls, by 100 and 77% at 24 and 31 h after replating, respectively. However, there was no change in the number of axons emerging from the cell body as a result of kinesin-6 depletion (Fig. 6D), which was also the case in our previous studies on the other two motors.
Figure 6.

Depletion of kinesin-6 significantly increases axonal length. SCG cells were transfected with control or kinesin-6 siRNA before plating and were grown for 3 DIV before replating. Replated neurons were grown for another 24 or 31 h before fixation and immunolabeling for β-III tubulin. No laminin was included in the replated cultures because slower-growing axons were found to be easier to quantify in terms of axonal length and other morphometric parameters. Fluorescence images are presented in an inverted format that converts blacks to whites and whites to blacks and inverts gray levels proportionally. A, Control siRNA. B, Kinesin-6 siRNA. Scale bar: 20 μm. C, The mean length of neurons transfected with kinesin-6 siRNA was significantly longer than axons in control neurons. Data are represented as mean ± SEM length: control siRNA = 115.9 ± 9.7 μm (24 h), 160.9 ± 12.7 μm (31 h); kinesin-6 siRNA = 214.3 ± 17.6 μm (24 h), 277.7 ± 22.2 μm (31 h) (n = 30, p < 0.001). The mean total axonal lengths in kinesin-6 siRNA-treated cultures were also significantly longer than in controls: control siRNA = 292 ± 32.4 μm (24 h), 696.5 ± 65.2 μm (31 h); kinesin-6 siRNA = 586.9 ± 63.8 μm (24 h, p < 0.001), 1233.9 ± 148.1 μm (31 h) (n = 35, p < 0.001). D, Quantification of axonal morphology shows that kinesin-6 siRNA has no detectable effect on branching or initiation of axons. Data are represented as mean ± SEM number of axons: control siRNA = 2.2 ± 0.4; kinesin-6 siRNA = 2.4 ± 0.5 (n = 10). Mean number of primary branches formed per 100 μm: control siRNA = 1.25 ± 0.10; kinesin-6 siRNA = 1.16 ± 0.20 (n = 10). Mean number of secondary branches formed per 100 μm: control siRNA = 0.49 ± 0.06; kinesin-6 siRNA = 0.66 ± 0.17 (n = 10).
We next tested whether depletion of kinesin-6 had an effect on the number of branches emerging from the axons, given that branch formation is almost certainly an event regulated locally within the axon (Gibson and Ma, 2011). Consistent with the absence or near absence from the axon of kinesin-6, its depletion from the neuron had no effect on the number of primary branches per 100 μm of axon or on the number of secondary branches (Fig. 6D). This contrasts with our previous studies on the other two motors, wherein depletion of kinesin-5 notably increased axonal branching (Myers and Baas, 2007), whereas depletion of kinesin-12 notably decreased axonal branching (Liu et al., 2010). Thus, depletion of each of the three motors has a qualitatively similar effect on axonal growth but a very different effect on axonal branch formation.
Depletion of kinesin-6 increases the frequency of microtubule transport in axons
To ascertain whether the increase in axonal length was accompanied by an increase in the bidirectional transport of short microtubules in the axon, we used the same photobleach-based approach that we used in our previous studies of this kind on kinesin-5 and kinesin-12. Neurons were induced to express EGFP–tubulin at the time of replating and were then allowed to grow axons in the presence of laminin for 24 h. Thinner axons are needed in this technique to visualize microtubule movements, and the addition of laminin to cultures assisted in this regard (see Materials and Methods). A bleached zone of 30 μm was imposed on the axonal microtubule array, and then short fluorescent microtubules originating from the axonal regions flanking the bleached zone were observed to move through the zone (Fig. 7A,B). The mobile microtubules are ∼5 μm in length, with approximately two-thirds moving anterogradely and the rest moving retrogradely. As with the depletion of kinesin-5 or kinesin-12, there were no detectable changes in the rate at which individual microtubules moved or the length of the moving microtubules after kinesin-6 depletion. However, as with the depletion of the other two motors, the frequency of microtubules moving was notably greater than in control axons and in both directions. Specifically, relative to controls, there was a 47% increase in the anterograde direction and 40% increase in the retrograde direction in the axons of neurons depleted of kinesin-6 (Fig. 7C). This differs somewhat with the results of depleting kinesin-5 or kinesin-12, in which the increase in microtubule transport frequency was much greater in both directions, with a bias in the anterograde direction that was especially notable for kinesin-12 (Myers and Baas, 2007; Liu et al., 2010). In the case of kinesin-6, the fact that the increase was similar in both directions and not as great as with the other two motors may be explicable on the basis of kinesin-6 only affecting the supply of microtubules from the cell body as opposed to the other two motors, which could affect microtubule transport both in the cell body and the axon itself.
Figure 7.
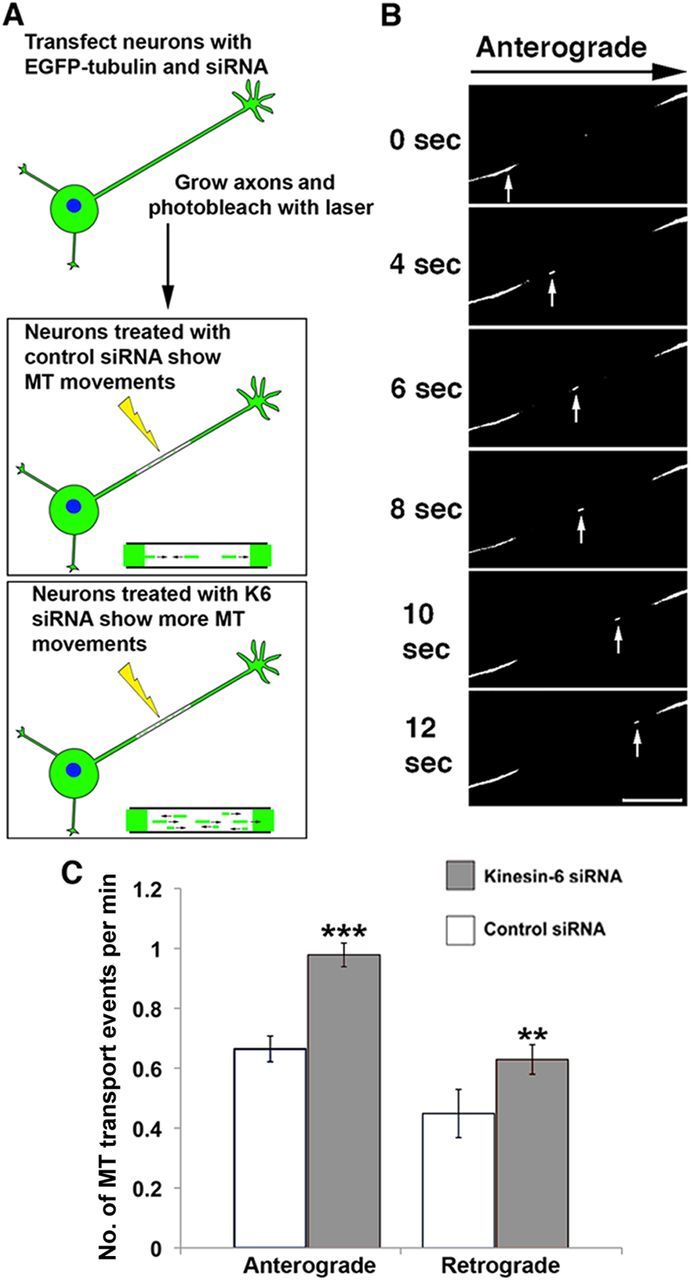
Depletion of kinesin-6 increases the frequency of microtubule transport in axons. A, SCGs were transfected with EGFP–tubulin together with control or kinesin-6 siRNA just before plating. At 3 DIV, neurons were replated and axons were allowed to grow anew for 48 h. Laminin was included in these cultures because faster-growing axons were generally thinner and therefore better suited for the microtubule transport assay. Microtubule transport events were more frequent in neurons transfected with kinesin-6 siRNA. B, A bleached zone of ∼30 μm was made at a distance of 50–100 μm from the cell body using a laser, and the frequency of short fluorescent microtubules moving through the zone during a period of 6 min was noted. Scale bar, 5 μm. C, Frequency of anterograde and retrograde microtubule transport (transport events per minute) in kinesin-6 siRNA cultures was significantly higher than in control cultures. Data are represented as mean ± SEM number of events: anterograde transport, control siRNA = 1.05 ± 0.05; kinesin-6 siRNA = 0.61 ± 0.06 (n = 20, p < 0.001); retrograde transport, control siRNA = 0.47 ± 0.05; kinesin-6 siRNA = 0.57 ± 0.06 (n = 16, p < 0.01).
Depletion of kinesin-6 does not affect growth cone size or navigation
In our recent studies on kinesin-5 and kinesin-12, we documented that depletion of either of these motors had profound effects on growth cone size, the capacity of the growth cone to turn in response to environmental cues, and the invasion of dynamic microtubules into the lamellar region of the growth cone and into filopodia (Myers and Baas, 2007; Nadar et al., 2008, 2012; Liu et al., 2010). Here, we observed no obvious change in growth cone size as a result of kinesin-6 depletion relative to controls (Fig. 8A,B). With regard to axonal navigation, we reported previously that depletion of either kinesin-5 or kinesin-12 causes growth cones to ignore substrate borders and grow from a preferred laminin substrate onto a less preferred poly-d-lysine substrate (Nadar et al., 2008, 2012; Liu et al., 2010). We tested whether depletion of kinesin-6 had a similar effect on growth cone turning using the same assay (see Materials and Methods). As expected, almost all axons of control neurons plated on the laminin substrate turned when they reached the poly-d-lysine border to remain on laminin (Fig. 8C). There was no difference with regard to the neurons depleted of kinesin-6, with their growth cones also turning when arriving at the border in the case of almost all of the axons (Fig. 8D). In neurons immunolabeled for β-III tubulin, there was no significant difference in the densitometric ratio of microtubule fluorescence on the poly-d-lysine substrate to the laminin substrate in control cultures compared with the cultures depleted of kinesin-6 (Fig. 8C).
Figure 8.
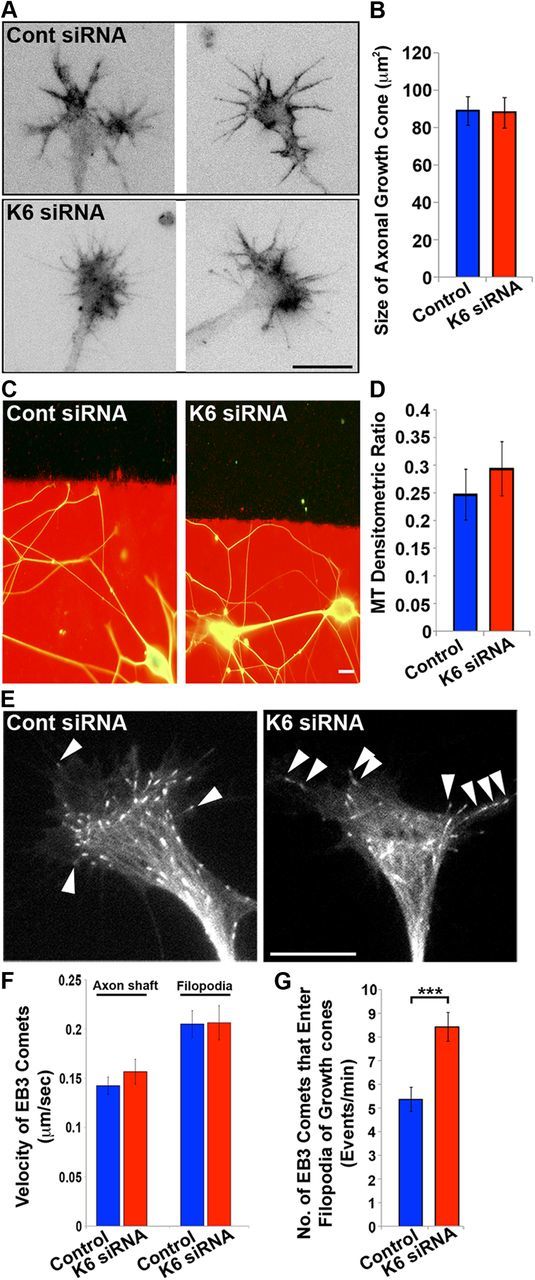
Depletion of kinesin-6 has no detectable effect on axonal branching or growth cone turning. A, Representative images of axonal growth cones labeled with fluorescent phalloidin in control and kinesin-6-depleted neurons. Fluorescence images are presented in an inverted format that converts blacks to whites and whites to blacks and inverts gray levels proportionally. Scale bar, 20 μm. B, Quantification of mean growth cone area (performed on samples labeled with fluorescent phalloidin) showed no significant difference between the groups. Data represented by mean ± SEM growth cone area: control siRNA = 88.86 ± 7.67 μm2; kinesin-6 siRNA = 87.88 ± 8.17 μm2. C, Representative images of axons growing on a laminin substrate (red) and turning away from the border between the laminin and a poly-d-lysine substrate (black). D, Quantification of the ratio of microtubule fluorescence on the laminin side and poly-d-lysine side showed no significant difference between control siRNA (0.25 ± 0.04) and kinesin-6-depleted (0.29 ± 0.05) neurons. Scale bar, 10 μm. n = 20. E, Representative growth cones of neurons transfected with EGFP–EB3 and control or kinesin-6 siRNA. White arrowheads indicate EB3 comets entering the filopodia, in which one arrowhead is shown in the control growth cone and three are indicated entering the kinesin-6-depleted growth cone. Scale bar, 10 μm. F, Quantification of the velocity of EB3 comets that travel through the axonal shaft shows no significant difference between groups. Data represented as mean ± SEM velocity: control siRNA = 0.14 ± 0.01 μm/s (n = 29); kinesin-6 siRNA = 0.16 ± 0.01 μm/s (n = 28); and through the filopodia, control siRNA = 0.21 ± 0.01 μm/s (n = 22); kinesin-6 siRNA = 0.21 ± 0.02 μm/s (n = 25). G, Quantification of the number of EB3 comets entering filopodia in the growth cones shows greater numbers in the case of kinesin-6-depleted neurons. Data are represented as mean ± SEM number: control siRNA = 5.36 ± 0.51 (n = 22); kinesin-6 siRNA = 8.43 ± 0.61 (n = 22, p < 0.001).
In related studies, we observed EGFP–EB3 comets in the growth cones of control and kinesin-6-depleted neurons to ascertain whether there was an increase in microtubule assembly velocity and/or invasion into the filopodia of the growth cone, as observed previously in the case of depletion of kinesin-5 (Nadar et al., 2008, 2012) or kinesin-12 (Liu et al., 2010). Such effects may curtail the polarized distribution of microtubules in the growth cone, underlying the lack of turning ability in growth cones depleted of these other two motors. Consistent with the growth cones' ability to turn correctly, there was no detectable difference in the velocity of comets moving in the axon and into filopodia in the case of kinesin-6 depletion (Fig. 8E,F). However, there was a significant increase of 57% more EB3 comets entering the filopodia when kinesin-6 was depleted (Fig. 8G). Given that we found no clear evidence of kinesin-6 being present in the growth cone, unlike the other two motors that are actually enriched in the growth cone, this observation is difficult to interpret. One possibility is that there are sufficient kinesin-6 molecules present to be functionally important and yet beneath the ability of the ML-6 or CHO1 antibodies to detect with certainty, but we suspect that the greater numbers of microtubules invading filopodia in kinesin-6-depleted neurons may simply be a manifestation of a faster growing axon with greater numbers of mobile microtubules. The lack of change in microtubule assembly rate provides some support for this view, but additional investigation is needed.
Expression of kinesin-12 rescues the phenotype of kinesin-6 or kinesin-12 siRNA
In a final set of studies, we wanted to ascertain whether we could rescue the phenotypes observed with the siRNA-based depletions of kinesin-6 or kinesin-12. We had two purposes for these experiments. First, we wanted to confirm the specificity of the siRNA, in that rescue experiments are often done to ensure that observed phenotypes are not attributable to unexpected off-target effects of the siRNA. Second, our results suggest that these two kinesins have some overlapping functions in the neuron, and, if this is true, we should be able to rescue the effects of depleting one of them by overexpressing the other. We found that our ability to conduct these studies was limited by the complexity of kinesin-6 because it contains two nuclear localization signals that drive ectopically expressed protein to the nucleus (Liu and Erikson, 2007). Indeed, when we expressed EGFP-tagged CHO1 or MKLP constructs in SCG neurons at 7 DIV using the CX1 device, the fluorescence was contained predominantly within the nucleus but sometimes also in the cell body (Fig. 9, first panel). Surprisingly, when we tried constructs that deleted or mutated these two regions (see Materials and Methods), although much of the expressed protein was cytoplasmic, most of it localized in distal axons as opposed to dendrites (Fig. 9, second panel). These results, which are rather different from those reported previously of kinesin-6 constructs expressed in cultured hippocampal neurons (Xu et al., 2006), suggest that a higher order of regulation of kinesin-6 must occur for it to localize to the somatodendritic compartment and for it to perform its role in dendritic microtubule organization. In contrast, we found that ectopically expressed kinesin-12 behaved in a simpler way, concentrating in dendrites at 7 DIV as expected (Fig. 9, third panel), reminiscent of the distribution of the endogenous protein. Therefore, we endeavored to rescue the axonal and dendritic phenotypes obtained with depletion of kinesin-6 or kinesin-12 with ectopically expressed kinesin-12. We used an EGFP-tagged DNA construct for human kinesin-12 for these studies because the presence of the rat kinesin-12 siRNA prevented the ectopic expression of rat kinesin-12.
Figure 9.

EGFP–kinesin-6 expression does not localize to dendrites. Full-length EGFP–kinesin-6 expressed in 7 DIV SCG neurons appears predominantly or exclusively in the nucleus (left). EGFP–kinesin-6 mutated at S904A/S905A or the EGFP–kinesin-6 with a deleted nuclear localization domain appears predominantly in the distal axon (middle). EGFP–kinesin-12 concentrates in the cell body and dendrites (right). Scale bar, 10 μm.
For axon rescue experiments, neurons were transfected with control, kinesin-6, or kinesin-12 siRNA at the time of plating and replated at 3 DIV. At the time of replating, neurons were transfected with either EGFP control or EGFP–kinesin-12 using the CX1 device. Neurons were left to grow axons for 10 h after replating and then fixed. The mean axonal lengths of fluorescent neurons were quantified (Fig. 10). In control siRNA neurons transfected to express EGFP–kinesin-12, axonal length was reduced by 78% compared with axons of neurons transfected with control siRNA and EGFP. Similarly, in neurons transfected with kinesin-6 siRNA and EGFP–kinesin-12, axonal length was reduced by 87% compared with those transfected with EGFP with kinesin-6 siRNA. In neurons transfected with kinesin-12 siRNA and EGFP–kinesin-12, axonal length was reduced by 52% compared with axons of neurons transfected with kinesin-12 siRNA and EGFP. Although EGFP–kinesin-12 expression rescued kinesin-12-depleted axons back to control lengths, EGFP–kinesin-12 expression decreased the lengths of kinesin-6-depleted axons but they become even shorter than controls. This latter observation is consistent with kinesin-12 having a greater role than kinesin-6 in regulating axonal growth rates.
Figure 10.

Expression of EGFP–kinesin-12 rescues axonal phenotype of kinesin-6 or kinesin-12 siRNA. Expression of EGFP–kinesin-12 significantly reduces the mean longest axonal length in all cultures. SCG neurons were transfected with siRNA at plating and replated at 3 DIV, when control empty EGFP plasmid or EGFP–kinesin-12 was introduced by transfection. Neurons were left to grow axons for 10 h. The mean longest axonal length of neurons transfected with EGFP was significantly shorter than neurons transfected with EGFP–kinesin-12. Data are represented as mean ± SEM length: control siRNA = 49.76 ± 13.15 μm; EGFP–kinesin-12 + control siRNA = 10.93 ± 4.85 μm (n = 24, p < 0.01). After kinesin-6 and kinesin-12 depletion, the mean longest axonal length of neurons transfected with EGFP–kinesin-12 was also significantly decreased relative to those expressing EGFP. Kinesin-6 siRNA = 77.92 ± 12.54 μm; EGFP–kinesin-12 + kinesin-6 siRNA = 10.07 ± 3.51 μm (n = 34, p < 0.001); kinesin-12 siRNA = 146.94 ± 16.13 μm; EGFP–kinesin-12 + kinesin-12 siRNA = 71.18 ± 17.09 μm (n = 36, p < 0.001).
For the dendrite rescue experiments, neurons were transfected with control, kinesin-6 siRNA, or kinesin-12 siRNA at the time of plating and allowed to grow for an additional 5 d. Neurons were then transfected using the CX1 device with either the EGFP empty plasmid (control) or the human EGFP–kinesin-12 construct as well as the appropriate siRNA boost for either kinesin-6 or kinesin-12. Control neurons were transfected with control siRNA at the time of plating as well as the boost, together with the DNA constructs. After transfection with EGFP–kinesin-12, control siRNA neurons displayed dendrites that were shorter in length and thicker in width along the shaft compared with those transfected with just EGFP (Fig. 11).
Figure 11.

Expression of EGFP–kinesin-12 rescues dendritic phenotype of kinesin-6 or kinesin-12 siRNA. SCG neurons were transfected with control, kinesin-6 siRNA, or kinesin-12 siRNA at the time of plating. At 5 DIV, neurons were transfected using the CX1 device with either EGFP empty plasmid or EGFP–kinesin-12 and the corresponding siRNA before being fixed at 7 DIV in methanol and immunolabeled for MAP2. Fluorescence images are presented in an inverted format that converts blacks to whites and whites to blacks and inverts gray levels proportionally. Representative images of dendrites transfected with control siRNA (top row), kinesin-6 siRNA (middle row), and kinesin-12 siRNA (bottom row). Neurons transfected with empty EGFP plasmid are shown on the left panels and neurons transfected with EGFP–kinesin-12 are shown on the right panels. Scale bar, 20 μm.
Expression of EGFP–kinesin-12 caused dendritic width to become thicker than neurons transfected with EGFP and siRNA (Fig. 12A, Table 2). This applied to neurons transfected with control siRNA, kinesin-6 siRNA, and kinesin-12 siRNA along the length of the dendritic shaft. Interestingly, at the levels of EGFP–kinesin-12 we were able to achieve, experimental dendrites depleted of endogenous kinesin-12 became thicker but did not become as thick as control dendrites, and yet neurons depleted of kinesin-6 became even thicker than controls. This may reflect differences in the endogenous levels of the two motors because depleting one or the other would deplete different amounts of the total of the two, or it may reflect differences in the potency of each of the motors to contribute to dendritic morphology. In control neurons, expression of EGFP–kinesin-12 significantly shortened dendrites by 20 μm. In kinesin-6- or kinesin-12-depleted neurons, expression of EGFP–kinesin-12 also caused experimental dendrites to become significantly shorter (by 22 and 25 μm, respectively), bringing the length to a similar level as in control siRNA neurons transfected with EGFP alone (Fig. 12B). This further confirmed that expression of EGFP–kinesin-12 rescued dendrite morphology in neurons depleted of kinesin-6 or kinesin-12.
Figure 12.

Expression of EGFP–kinesin-12 rescues dendritic width phenotype of kinesin-6 or kinesin-12 siRNA. A, The mean dendritic width along the first 80 μm from the cell body was determined in SCG cultures transfected with EGFP together with control (gray solid line, n = 20), kinesin-6 siRNA (red solid line, n = 20), and kinesin-12 siRNA (green solid line, n = 25) or with EGFP–kinesin-12 together with control siRNA (gray dashed line, n = 22), kinesin-6 siRNA (red dashed line, n = 23), and kinesin-12 siRNA (green dashed line, n = 25) (see Table 2). EGFP–kinesin-12 expression significantly increased the mean dendritic width in both kinesin-6-depleted and kinesin-12-depleted SCG neurons. EGFP–kinesin-12 expression does not significantly increase dendritic width of control neurons. Dendritic width of neurons transfected with EGFP–kinesin-12 after kinesin-6 depletion was significantly higher at all points along the dendrite compared with neurons transfected with EGFP–kinesin-12 after kinesin-12 depletion. B, Quantification of the mean length of dendrites showed that dendrites were significantly shorter in EGFP–kinesin-12-expressing neurons. Data are represented as mean ± SEM length: control siRNA (gray solid box) = 98.64 ± 6.17 μm (n = 22); EGFP–kinesin-12 + control siRNA (gray dashed box) = 78.69 ± 8.16 μm (p < 0.05, n = 24). In neurons depleted of kinesin-6, EGFP–kinesin-12 expression significantly decreased dendritic length: kinesin-6 siRNA (red solid box) = 128.02 ± 8.34 μm (n = 24); EGFP–kinesin-12 + kinesin-6 siRNA (red dashed box) = 96.55 ± 9.00 μm (p < 0.01, n = 26). In neurons depleted of kinesin-12, EGFP–kinesin-12 expression significantly decreased dendritic length: kinesin-12 siRNA (green solid box) = 116.78 ± 9.20 μm (n = 24); EGFP–kinesin-12 + kinesin-12 siRNA (green dashed box) = 91.91 ± 7.18 μm (n = 32, p < 0.01).
Table 2.
Dendritic width in neurons expressing EGFP–kinesin-12
| Distance from cell body at which dendritic width was measured (μm) | Control siRNA | Control siRNA + EGFP–kinesin-12 | Kinesin-6 siRNA | Kinesin-6 siRNA + EGFP–kinesin-12 | Kinesin-12 siRNA | Kinesin-12 siRNA + EGFP–kinesin-12 |
|---|---|---|---|---|---|---|
| 0 | 8.54 ± 0.79 | 9.50 ± 0.45 | 7.09 ± 0.85 | 10.48 ± 0.69 | 6.01 ± 0.31 | 7.67 ± 0.48 |
| 20 | 5.33 ± 0.47 | 5.65 ± 0.53 | 3.96 ± 0.57 | 6.00 ± 0.57 | 2.47 ± 0.21 | 3.78 ± 0.29 |
| 40 | 3.68 ± 0.30 | 3.73 ± 0.47 | 2.48 ± 0.35 | 4.32 ± 0.34 | 1.68 ± 0.18 | 2.34 ± 0.27 |
| 60 | 2.44 ± 0.26 | 2.53 ± 0.26 | 2.01 ± 0.27 | 3.26 ± 0.35 | 1.15 ± 0.15 | 1.96 ± 0.23 |
| 80 | 1.60 ± 0.49 | 2.07 ± 0.40 | 1.40 ± 0.27 | 2.85 ± 0.43 | 1.03 ± 0.19 | 1.37 ± 0.16 |
Data represented as mean ± SEM (μm).
Discussion
Several lines of evidence suggest that the characteristic patterns of microtubule polarity orientation in axons and dendrites provide a foundation for neuronal polarity (Baas and Lin, 2011). We have argued that the microtubule arrays of axons and dendrites are organized by mechanisms analogous to those used to organize microtubules during mitosis. We have likened axonal microtubules to the astral microtubules of the mitotic spindle, projecting with uniform polarity orientation to the cell periphery, and dendritic microtubules to those in the midzone of the spindle, in which microtubules of opposite orientations overlap (Baas, 1999). Based on experimental results, we concluded that microtubules are transported from the cell body into both types of processes by a common dynein-driven mechanism but that dendrites are distinguished from axons by the subsequent invasion exclusively into dendrites of minus-end-distal microtubules (Ahmad and Baas, 1995; Sharp et al., 1995; Ahmad et al., 1998, 2006; He et al., 2005; Baas and Lin, 2011; Baas and Mozgova, 2012). Additional evidence has shown that the similarity with mitosis is not only thematic but that many of the same molecules assumed previously to be mitosis specific are critically important for organizing microtubules in axons and dendrites.
Here, we revisited the role of kinesin-6 in the differentiation of the neuron, with emphasis on the proposed role of this motor protein in the establishment of the mixed polarity orientation of microtubules characteristic of vertebrate dendrites. In previous studies, we concluded on the basis of qualitative observations that kinesin-6 is present only in cell bodies and dendrites, not in axons or immature processes (Sharp et al., 1997; Yu et al., 1997). In addition, we showed that depleting kinesin-6 from neurons using antisense oligonucleotides prevents dendrites from developing, resulting in neurons bearing only axonal processes containing predominantly plus-end-distal microtubules (Sharp et al., 1997; Yu et al., 1997). If the antisense was added after the dendrites had already differentiated, the dendrites gradually became more axonal in character, with their minus-end-distal microtubules chased back into the cell body (Yu et al., 2000). Collectively, these observations prompted us to propose a scenario by which this motor protein, best known for its association with anti-parallel microtubules in mitosis (Nislow et al., 1992), has the corresponding function of establishing the mixed orientation of microtubules in dendrites. Our present studies, using a more quantitative approach with a new antibody, confirm that kinesin-6 is strongly concentrated in dendrites compared with axons. Kinesin-6 appears to be mostly excluded from axons, although we cannot rule out that a small number of kinesin-6 molecules may be present in the axon. Using a contemporary RNA interference approach, we found that, when kinesin-6 is depleted from cultured rat sympathetic neurons, developing dendrites contain fewer minus-end-distal microtubules than their control counterparts and display a more axon-like morphology and subcellular composition. However, the effect was not as dramatic as reported previously with the antisense approach, suggesting that the antisense results may have had a nonspecific component as well.
Interestingly, we found a similar effect on dendritic morphology and microtubule organization when we depleted kinesin-12, another motor protein best known for its role in mitosis. Kinesin-12 is not absent from the axon, but it becomes enriched in dendrites relative to axons as dendrites develop (Buster et al., 2003). Based on these results, we conclude that kinesin-6 is not alone in its capacity to introduce minus-end-distal microtubules into developing dendrites, because kinesin-12 can do it as well. Given that kinesin-12 is not otherwise known to overlap in function with kinesin-6, we would not be surprised if still other motors, especially those that participate in mitosis, could function in this manner as well.
In previous studies, we documented notable effects on axonal morphology and the bidirectional transport in the axon of short microtubules of depleting kinesin-12 (Liu et al., 2010) or kinesin-5 (Myers and Baas, 2007; Nadar et al., 2008; Liu et al., 2010). Given that kinesin-6 is absent or nearly absent from axons, we predicted that there would be little or no effect on these parameters when kinesin-6 was depleted. Indeed, we found no change in axonal branching or growth cone size or turning. Surprisingly, however, we found depletion of kinesin-6 to affect axonal growth rate and the frequency of axonal microtubule transport in a manner qualitatively similar to the effects of depleting either of the other two motors. Specifically, axons grew faster and microtubule transport frequency increased in both directions when the motor was depleted. Although we cannot dismiss the possibility that the small number of kinesin-6 molecules in axons could still be functionally important (as potentially suggested by an enhanced invasion of microtubules into growth cone filopodia of neurons depleted of kinesin-6), we find more convincing the possibility that kinesin-6 acts by regulating the flow of short microtubules from the cell body into the axon, which in turn affects the growth rate of the axon. In fact, we previously speculated this mechanism in the case of the other two motors, although they are present in the axon as well as the cell body (Liu et al., 2010). The fact that the effects are greater with the other two motors than with kinesin-6 suggests the possibility that, with regard to regulating microtubule transport in the axon, the other two motors act at the level of the cell body and the axon itself, whereas kinesin-6 acts only or almost only at the level of the cell body.
In a final set of studies, we wanted to ascertain whether we could rescue the phenotype of neurons depleted of kinesin-6 by reexpressing it with a DNA construct, because even contemporary RNA interference methods can sometimes produce off-target effects. However, we found that, if we expressed EGFP-tagged kinesin-6 in neurons, the protein was mostly sequestered in the nucleus, which was not entirely surprising given that kinesin-6 has two nuclear localization signals. Constructs that either delete these regions of the molecule or inhibit them via pseudo-phosphorylation result in protein outside of the nucleus, but the protein does not accumulate in dendrites in a manner similar to the endogenous protein, but rather, the expressed kinesin-6 protein concentrates in the distal regions of axons. The reason for this is unknown, but we suspect that it has something to do with kinesin-6 being one component of a complex called centralspindlin that interacts during cell division with other microtubule-related proteins such as PRC1 and signals to still other proteins during cytokinesis (Hutterer et al., 2009; Hornick et al., 2010). To localize properly to dendrites and to participate in organizing microtubules in neurons, kinesin-6 may have to be posttranslationally modified in a certain way so that it can partner appropriately with proteins such as these. The next phase of our efforts will be to determine how kinesin-6 is regulated so that it is appropriately targeted to dendrites. In the meantime, we found that we could rescue the phenotypes produced by depleting either kinesin-6 or kinesin-12 by expressing a kinesin-12 construct, thus confirming that the phenotypes we observed with the depletions were indeed attributable to the reduction in the levels of mitotic motor proteins. The fact that we could rescue phenotypes produced by kinesin-6 depletion by overexpressing kinesin-12, both in the case of the dendrites and the axon, confirms that there is redundancy of function of these two motors, at least with regard to the parameters studied here. Subtle differences observed in the rescue experiments in the case of neurons depleted of each of the two motors suggest that kinesin-6 and kinesin-12 are not identical with regard to their properties, prompting us to wonder whether different “recipes” of mitotic motors may contribute to differences in the morphology of different kinds of neurons.
We propose a model schematically illustrated in Figure 13. Kinesin-6 is concentrated in the cell body in which it interacts with neighboring microtubules to attenuate their plus-end-distal transport into the axon. As the neuron matures, the kinesin-6 forces drive microtubules with minus-ends-leading into all processes except one designated to remain the axon, thus contributing to the transformation of the other processes into dendrites. Kinesin-12 functions in a similar manner, but it also has roles to play in the axon itself and in the growth cone. Other motors are likely to contribute as well. We posit that dendrites from different kinds of neurons may acquire their distinctive morphologies via different recipes of various motors; for example, kinesin-12 expression is low in hippocampal neurons but is high in sympathetic neurons at the developmental stage of dendritic differentiation (Liu et al., 2010). In adult neurons, expression of all of the mitotic motors is extremely low, suggesting that the maintenance of the dendritic microtubule pattern may involve other proteins, such as PRC1, which is known to bundle microtubules of opposite orientation (Subramanian et al., 2010). Finally, it is interesting to note that fully established dendrites of Drosophila neurons are mostly minus-end-distal (Rolls, 2011), suggesting that additional remodeling of the dendritic microtubule array can occur in certain instances to deplete the plus-end-distal microtubules, further distinguishing the dendritic microtubule array from that of the axon.
Figure 13.

Model for coregulation of microtubule polarity in axons and dendrites by different mitotic kinesins. During axonal differentiation, forces generated by cytoplasmic dynein drive plus-end-distal microtubules into the axon and nascent dendrites (data not shown). Left, Forces generated by kinesin-6 in the cell body oppose the forces generated by cytoplasmic dynein, restricting the transport of plus-end-distal microtubules into the axon. As the neuron matures, kinesin-6 fuels the transport of short microtubules with their minus-end distal into all of the processes except the one designated to remain the axon, thus causing the other processes to differentiate into dendrites. Right; Forces generated by kinesin-12 behave similarly to kinesin-6 with regard to introducing minus-end-distal microtubules into the dendrite, but kinesin-12 is also present in the axon and growth cone, pushing plus-end-distal microtubules back toward the cell body. As a result, kinesin-12 behaves like kinesin-6 with regard to dendrites but produces effects more like kinesin-5 with regard to the axon.
Footnotes
This work was funded by grants from the National Institutes of Health and the National Science Foundation (P.W.B.) and Priority Academic Program Development of Jiangsu Higher Education Institutions and National Natural Science Foundation Grant 31171007 (M.L.). S.L. was supported by a Postdoctoral Fellowship from the Craig H. Neilsen Foundation.
The authors declare no competing financial interests.
References
- Ahmad FJ, Baas PW. Microtubules released from the neuronal centrosome are transported into the axon. J Cell Sci. 1995;108:2761–2769. doi: 10.1242/jcs.108.8.2761. [DOI] [PubMed] [Google Scholar]
- Ahmad FJ, Echeverri CJ, Vallee RB, Baas PW. Cytoplasmic dynein and dynactin are required for the transport of microtubules into the axon. J Cell Biol. 1998;140:391–401. doi: 10.1083/jcb.140.2.391. [DOI] [PMC free article] [PubMed] [Google Scholar]
- Ahmad FJ, He Y, Myers KA, Hasaka TP, Francis F, Black MM, Baas PW. Effects of dynactin disruption and dynein depletion on axonal microtubules. Traffic. 2006;7:524–537. doi: 10.1111/j.1600-0854.2006.00403.x. [DOI] [PubMed] [Google Scholar]
- Ascaño M, Richmond A, Borden P, Kuruvilla R. Axonal targeting of Trk receptors via transcytosis regulates sensitivity to neurotrophin responses. J Neurosci. 2009;29:11674–11685. doi: 10.1523/JNEUROSCI.1542-09.2009. [DOI] [PMC free article] [PubMed] [Google Scholar]
- Baas PW. Microtubules and neuronal polarity: lessons from mitosis. Neuron. 1999;22:23–31. doi: 10.1016/s0896-6273(00)80675-3. [DOI] [PubMed] [Google Scholar]
- Baas PW, Ahmad FJ. The transport properties of axonal microtubules establish their polarity orientation. J Cell Biol. 1993;120:1427–1437. doi: 10.1083/jcb.120.6.1427. [DOI] [PMC free article] [PubMed] [Google Scholar]
- Baas PW, Lin S. Hooks and comets: the story of microtubule polarity orientation in the neuron. Dev Neurobiol. 2011;71:403–418. doi: 10.1002/dneu.20818. [DOI] [PMC free article] [PubMed] [Google Scholar]
- Baas PW, Mozgova OI. A novel role for retrograde transport of microtubules in the axon. Cytoskeleton (Hoboken) 2012;69:416–425. doi: 10.1002/cm.21013. [DOI] [PubMed] [Google Scholar]
- Baas PW, Deitch JS, Black MM, Banker GA. Polarity orientation of microtubules in hippocampal neurons: uniformity in the axon and nonuniformity in the dendrite. Proc Natl Acad Sci U S A. 1988;85:8335–8339. doi: 10.1073/pnas.85.21.8335. [DOI] [PMC free article] [PubMed] [Google Scholar]
- Baas PW, Black MM, Banker GA. Changes in microtubule polarity orientation during the development of hippocampal neurons in culture. J Cell Biol. 1989;109:3085–3094. doi: 10.1083/jcb.109.6.3085. [DOI] [PMC free article] [PubMed] [Google Scholar]
- Baas PW, Slaughter T, Brown A, Black MM. Microtubule dynamics in axons and dendrites. J Neurosci Res. 1991;30:134–153. doi: 10.1002/jnr.490300115. [DOI] [PubMed] [Google Scholar]
- Black MM, Baas PW. The basis of polarity in neurons. Trends Neurosci. 1989;12:211–214. doi: 10.1016/0166-2236(89)90124-0. [DOI] [PubMed] [Google Scholar]
- Buster DW, Baird DH, Yu W, Solowska JM, Chauvière M, Mazurek A, Kress M, Baas PW. Expression of the mitotic kinesin Kif15 in postmitotic neurons: implications for neuronal migration and development. J Neurocytol. 2003;32:79–96. doi: 10.1023/a:1027332432740. [DOI] [PubMed] [Google Scholar]
- Caceres A, Payne MR, Binder LI, Steward O. Immunocytochemical localization of actin and microtubule-associated protein MAP2 in dendritic spines. Proc Natl Acad Sci U S A. 1983;80:1738–1742. doi: 10.1073/pnas.80.6.1738. [DOI] [PMC free article] [PubMed] [Google Scholar]
- Dotti CG, Sullivan CA, Banker GA. The establishment of polarity by hippocampal neurons in culture. J Neurosci. 1988;8:1454–1468. doi: 10.1523/JNEUROSCI.08-04-01454.1988. [DOI] [PMC free article] [PubMed] [Google Scholar]
- Douglas ME, Davies T, Joseph N, Mishima M. Aurora B and 14-3-3 coordinately regulate clustering of centralspindlin during cytokinesis. Curr Biol. 2010;20:927–933. doi: 10.1016/j.cub.2010.03.055. [DOI] [PMC free article] [PubMed] [Google Scholar]
- Ferhat L, Kuriyama R, Lyons GE, Micales B, Baas PW. Expression of the mitotic motor protein CHO1/MKLP1 in postmitotic neurons. Eur J Neurosci. 1998a;10:1383–1393. doi: 10.1046/j.1460-9568.1998.00159.x. [DOI] [PubMed] [Google Scholar]
- Ferhat L, Cook C, Chauviere M, Harper M, Kress M, Lyons GE, Baas PW. Expression of the mitotic motor protein Eg5 in postmitotic neurons: implications for neuronal development. J Neurosci. 1998b;18:7822–7835. doi: 10.1523/JNEUROSCI.18-19-07822.1998. [DOI] [PMC free article] [PubMed] [Google Scholar]
- Florian S, Mayer TU. Modulated microtubule dynamics enable Hklp2/Kif15 to assemble bipolar spindles. Cell Cycle. 2011;10:3533–3544. doi: 10.4161/cc.10.20.17817. [DOI] [PubMed] [Google Scholar]
- Gibson DA, Ma L. Developmental regulation of axon branching in the vertebrate nervous system. Development. 2011;138:183–195. doi: 10.1242/dev.046441. [DOI] [PMC free article] [PubMed] [Google Scholar]
- Hasaka TP, Myers KA, Baas PW. Role of actin filaments in the axonal transport of microtubules. J Neurosci. 2004;24:11291–11301. doi: 10.1523/JNEUROSCI.3443-04.2004. [DOI] [PMC free article] [PubMed] [Google Scholar]
- He Y, Francis F, Myers KA, Yu W, Black MM, Baas PW. Role of cytoplasmic dynein in the axonal transport of microtubules and neurofilaments. J Cell Biol. 2005;168:697–703. doi: 10.1083/jcb.200407191. [DOI] [PMC free article] [PubMed] [Google Scholar]
- Heidemann SR, Landers JM, Hamborg MA. Polarity orientation of axonal microtubules. J Cell Biol. 1981;91:661–665. doi: 10.1083/jcb.91.3.661. [DOI] [PMC free article] [PubMed] [Google Scholar]
- Higgins D, Lein PJ, Osterhout DJ, Johnson MI. Tissue culture of mammalian autonomic neurons. In: Banker G, Goslin K, editors. Culturing nerve cells. Cambridge, MA: Massachusetts Institute of Technology; 1991. pp. 177–205. [Google Scholar]
- Hornick JE, Karanjeet K, Collins ES, Hinchcliffe EH. Kinesins to the core: the role of microtubule-based motor proteins in building the mitotic spindle midzone. Semin Cell Dev Biol. 2010;21:290–299. doi: 10.1016/j.semcdb.2010.01.017. [DOI] [PMC free article] [PubMed] [Google Scholar]
- Hutterer A, Glotzer M, Mishima M. Clustering of centralspindlin is essential for its accumulation to the central spindle and the midbody. Curr Biol. 2009;19:2043–2049. doi: 10.1016/j.cub.2009.10.050. [DOI] [PMC free article] [PubMed] [Google Scholar]
- Jaworski J, Kapitein LC, Gouveia SM, Dortland BR, Wulf PS, Grigoriev I, Camera P, Spangler SA, Di Stefano P, Demmers J, Krugers H, Defilippi P, Akhmanova A, Hoogenraad CC. Dynamic microtubules regulate dendritic spine morphology and synaptic plasticity. Neuron. 2009;61:85–100. doi: 10.1016/j.neuron.2008.11.013. [DOI] [PubMed] [Google Scholar]
- Kapitein LC, Schlager MA, Kuijpers M, Wulf PS, van Spronsen M, MacKintosh FC, Hoogenraad CC. Mixed microtubules steer dynein-driven cargo transport into dendrites. Curr Biol. 2010;20:290–299. doi: 10.1016/j.cub.2009.12.052. [DOI] [PubMed] [Google Scholar]
- Kollins KM, Bell RL, Butts M, Withers GS. Dendrites differ from axons in patterns of microtubule stability and polymerization during development. Neural Dev. 2009;4:26. doi: 10.1186/1749-8104-4-26. [DOI] [PMC free article] [PubMed] [Google Scholar]
- Kuriyama R, Gustus C, Terada Y, Uetake Y, Matuliene J. CHO1, a mammalian kinesin-like protein, interacts with F-actin and is involved in the terminal phase of cytokinesis. J Cell Biol. 2002;156:783–790. doi: 10.1083/jcb.200109090. [DOI] [PMC free article] [PubMed] [Google Scholar]
- Lin S, Liu M, Son YJ, Timothy Himes B, Snow DM, Yu W, Baas PW. Inhibition of Kinesin-5, a microtubule-based motor protein, as a strategy for enhancing regeneration of adult axons. Traffic. 2011;12:269–286. doi: 10.1111/j.1600-0854.2010.01152.x. [DOI] [PMC free article] [PubMed] [Google Scholar]
- Liu M, Nadar VC, Kozielski F, Kozlowska M, Yu W, Baas PW. Kinesin-12, a mitotic microtubule-associated motor protein, impacts axonal growth, navigation, and branching. J Neurosci. 2010;30:14896–14906. doi: 10.1523/JNEUROSCI.3739-10.2010. [DOI] [PMC free article] [PubMed] [Google Scholar]
- Liu X, Erikson RL. The nuclear localization signal of mitotic kinesin-like protein Mklp-1: effect on Mklp-1 function during cytokinesis. Biochem Biophys Res Commun. 2007;353:960–964. doi: 10.1016/j.bbrc.2006.12.142. [DOI] [PubMed] [Google Scholar]
- Myers KA, Baas PW. Kinesin-5 regulates the growth of the axon by acting as a brake on its microtubule array. J Cell Biol. 2007;178:1081–1091. doi: 10.1083/jcb.200702074. [DOI] [PMC free article] [PubMed] [Google Scholar]
- Nadar VC, Ketschek A, Myers KA, Gallo G, Baas PW. Kinesin-5 is essential for growth-cone turning. Curr Biol. 2008;18:1972–1977. doi: 10.1016/j.cub.2008.11.021. [DOI] [PMC free article] [PubMed] [Google Scholar]
- Nadar VC, Lin S, Baas PW. Microtubule redistribution in growth cones elicited by focal inactivation of Kinesin-5. J Neurosci. 2012;32:5783–5794. doi: 10.1523/JNEUROSCI.0144-12.2012. [DOI] [PMC free article] [PubMed] [Google Scholar]
- Nislow C, Lombillo VA, Kuriyama R, McIntosh JR. A plus-end-directed motor enzyme that moves antiparallel microtubules in vitro localizes to the interzone of mitotic spindles. Nature. 1992;359:543–547. doi: 10.1038/359543a0. [DOI] [PubMed] [Google Scholar]
- Nunez J, Fischer I. Microtubule-associated proteins (MAPs) in the peripheral nervous system during development and regeneration. J Mol Neurosci. 1997;8:207–222. doi: 10.1007/BF02736834. [DOI] [PubMed] [Google Scholar]
- Qiang L, Yu W, Andreadis A, Luo M, Baas PW. Tau protects microtubules in the axon from severing by katanin. J Neurosci. 2006;26:3120–3129. doi: 10.1523/JNEUROSCI.5392-05.2006. [DOI] [PMC free article] [PubMed] [Google Scholar]
- Qiang L, Yu W, Liu M, Solowska JM, Baas PW. Basic fibroblast growth factor elicits formation of interstitial axonal branches via enhanced severing of microtubules. Mol Biol Cell. 2010;21:334–344. doi: 10.1091/mbc.E09-09-0834. [DOI] [PMC free article] [PubMed] [Google Scholar]
- Rolls MM. Neuronal polarity in Drosophila: sorting out axons and dendrites. Dev Neurobiol. 2011;71:419–429. doi: 10.1002/dneu.20836. [DOI] [PMC free article] [PubMed] [Google Scholar]
- Sharp DJ, Yu W, Baas PW. Transport of dendritic microtubules establishes their nonuniform polarity orientation. J Cell Biol. 1995;130:93–103. doi: 10.1083/jcb.130.1.93. [DOI] [PMC free article] [PubMed] [Google Scholar]
- Sharp DJ, Yu W, Ferhat L, Kuriyama R, Rueger DC, Baas PW. Identification of a microtubule-associated motor protein essential for dendritic differentiation. J Cell Biol. 1997;138:833–843. doi: 10.1083/jcb.138.4.833. [DOI] [PMC free article] [PubMed] [Google Scholar]
- Silverman MA, Kaech S, Ramser EM, Lu X, Lasarev MR, Nagalla S, Banker G. Expression of kinesin superfamily genes in cultured hippocampal neurons. Cytoskeleton (Hoboken) 2010;67:784–795. doi: 10.1002/cm.20487. [DOI] [PMC free article] [PubMed] [Google Scholar]
- Stepanova T, Slemmer J, Hoogenraad CC, Lansbergen G, Dortland B, De Zeeuw CI, Grosveld F, van Cappellen G, Akhmanova A, Galjart N. Visualization of microtubule growth in cultured neurons via the use of EB3-GFP (end-binding protein 3-green fluorescent protein) J Neurosci. 2003;23:2655–2664. doi: 10.1523/JNEUROSCI.23-07-02655.2003. [DOI] [PMC free article] [PubMed] [Google Scholar]
- Subramanian R, Wilson-Kubalek EM, Arthur CP, Bick MJ, Campbell EA, Darst SA, Milligan RA, Kapoor TM. Insights into antiparallel microtubule crosslinking by PRC1, a conserved nonmotor microtubule binding protein. Cell. 2010;142:433–443. doi: 10.1016/j.cell.2010.07.012. [DOI] [PMC free article] [PubMed] [Google Scholar]
- Tint I, Jean D, Baas PW, Black MM. Doublecortin associates with microtubules preferentially in regions of the axon displaying actin-rich protrusive structures. J Neurosci. 2009;29:10995–11010. doi: 10.1523/JNEUROSCI.3399-09.2009. [DOI] [PMC free article] [PubMed] [Google Scholar]
- Xu X, He C, Zhang Z, Chen Y. MKLP1 requires specific domains for its dendritic targeting. J Cell Sci. 2006;119:452–458. doi: 10.1242/jcs.02750. [DOI] [PubMed] [Google Scholar]
- Yu W, Sharp DJ, Kuriyama R, Mallik P, Baas PW. Inhibition of a mitotic motor compromises the formation of dendrite-like processes from neuroblastoma cells. J Cell Biol. 1997;136:659–668. doi: 10.1083/jcb.136.3.659. [DOI] [PMC free article] [PubMed] [Google Scholar]
- Yu W, Cook C, Sauter C, Kuriyama R, Kaplan PL, Baas PW. Depletion of a microtubule-associated motor protein induces the loss of dendritic identity. J Neurosci. 2000;20:5782–5791. doi: 10.1523/JNEUROSCI.20-15-05782.2000. [DOI] [PMC free article] [PubMed] [Google Scholar]
- Zheng Y, Wildonger J, Ye B, Zhang Y, Kita A, Younger SH, Zimmerman S, Jan LY, Jan YN. Dynein is required for polarized dendritic transport and uniform microtubule orientation in axons. Nat Cell Biol. 2008;10:1172–1180. doi: 10.1038/ncb1777. [DOI] [PMC free article] [PubMed] [Google Scholar]