Abstract
By combining photonic crystal label-free biosensor imaging with photonic crystal enhanced fluorescence, it is possible to selectively enhance the fluorescence emission from regions of the PC surface based upon the density of immobilized capture molecules. A label-free image of the capture molecules enables determination of optimal coupling conditions of the laser used for fluorescence imaging of the photonic crystal surface on a pixel-by-pixel basis, allowing maximization of fluorescence enhancement factor from regions incorporating a biomolecule capture spot and minimization of background autofluorescence from areas between capture spots. This capability significantly improves the contrast of enhanced fluorescent images, and when applied to an antibody protein microarray, provides a substantial advantage over conventional fluorescence microscopy. Using the new approach, we demonstrate detection limits as low as 0.97 pg/ml for a representative protein biomarker in buffer.
OCIS codes: (180.2520) Fluorescence microscopy, (050.5298) Photonic crystals
1. Introduction
Fluorescence is one of the most widely used detection modalities for gene expression analysis, DNA sequencing, disease biomarker diagnostic tests, and cell imaging due to the ability for high quantum efficiency tag molecules or nanoparticles to provide excellent signal-to-noise ratio. Many fluorescence-based assays are performed upon solid surfaces, such as glass substrates, upon which immobilized molecules selectively capture analyte molecules from a test sample. Such assays can be readily multiplexed in a microarray format, in which capture molecules are applied to a substrate in distinct spots, enabling detection of many genes (for a DNA microarray) [1–5] or disease biomarkers [6–11] simultaneously. In conventional fluorescent microarrays performed upon glass substrates, the analyte is tagged with a fluorescent dye, and a focused laser beam is scanned across the array surface to generate an image of fluorescent output as a function of position. Despite the sensitivity afforded by this approach, there is a need to further reduce the limits of detection for microarray analysis in order to observe the presence of genes that are expressed at low levels and to detect disease biomarkers present at lower concentrations. As a result, there is a great deal of interest in techniques that can increase the sensitivity of fluorescent assays through the use of nanostructured optical surfaces that can locally enhance the electromagnetic fields that excite fluorescent emission and to more efficiently couple fluorescent photons to a detection system. Such approaches are broadly referred to as demonstrating enhanced fluorescence (EF).
Several approaches have been investigated for EF. Metal nanostructures can efficiently couple an external laser light source to substrate-immobilized fluorophores through surface plasmons that generate localized regions with enhanced electric field intensity [3, 5, 12–14]. When fluorescent molecules are placed close to the regions of these intensified electric fields, a subsequent enhancement in fluorescence emission by 10-100 × has been reported. Despite the ability of metal-based nanostructures to generate evanescent fields, the application of plasmon-based EF has been limited by the absorption of light at optical wavelengths (which limits resonant quality factor and thus the potential electric field enhancement factor) [15, 16], and by quenching of fluorescent molecules that are in close proximity to metal [17].
An alternative approach to EF utilizes dielectric-based optical resonator surfaces, such as photonic crystals (PC). PC surfaces have demonstrated the ability to provide higher quality factor (Q~1000) optical resonances than surface plasmons [18–20], a lack of quenching [21], and the ability to obtain enhancement factors as high as 7500× [18]. PC enhanced fluorescence (PCEF) has been performed upon plastic-based [19] and quartz-based [18] surfaces that can be inexpensively fabricated over large areas (i.e. entire 1×3 in2 microscope slides or 3×5 in2 microplates) by nanoreplica molding [22–24] or nanoimprint lithography [25, 26]. A PC may be designed with multiple resonances that couple with both the wavelength of fluorescent excitation and the wavelength of fluorescent emission, so that the mechanisms of enhanced excitation (increased local electric field at the PC surface) and enhance extraction [20] (increased collection efficiency of emitted photons) can operate simultaneously with multiplicative effects [18, 19, 27–29]. Microarray assays performed upon PC surfaces may be measured by conventional commercially available confocal laser scanners [30, 31], but greater enhancement factors have been demonstrated using custom designed detection systems that utilize collimated laser illumination rather than focused illumination [28]. PCEF has been applied to large DNA microarrays used for gene expression analysis [30], and to protein microarrays for detection of breast cancer biomarkers in serum [32].
PC optical resonances have also been exploited as a platform for label-free (LF) detection. The incorporation of biomolecules into the evanescent field region of the PC results in a positive shift of the resonant wavelength (for a fixed incident angle) [33–35] due to the increased dielectric permittivity of biomolecules with respect to water. An alternative method for LF detection on a PC surface that allows high resolution imaging of surface-based biomolecular interactions is to measure a shift in the resonant coupling angle, when illuminating the PC surface with a fixed wavelength from a laser [28, 36]. A microscope-based detection instrument for label-free imaging the density of immobilized microarray capture spots [32, 36] and cells [29] has been demonstrated by detecting shifts in the Angle of Minimum Transmission (AMT) as a function of position upon a PC surface with ~3 × 3 μm2 pixel size.
The fact that the resonant coupling conditions of a PC shift due to the presence of immobilized biomolecules poses a unique challenge and opportunity for fully exploiting PCEF. Obtaining the greatest possible enhancement factor for enhanced excitation requires that the PC be illuminated at the precise wavelength/angle combination for optimal resonant coupling. While high quality-factor PC resonances yield the greatest enhancement factor [37], they also have the most stringent coupling condition. For example, previous work has shown that illumination of a PC surface at the optimum coupling angle/wavelength results in a ~100 × enhancement factor, while a θ=0.4° incident angle deviation reduces the enhancement to only 10× [37], and a deviation of θ=1.2° completely eliminates the enhancement. The regions of a PC surface with a high density of immobilized capture molecules, such as the capture spots of a microarray, have very different coupling conditions than the regions of a PC surface between the capture spots. Therefore, it is possible to selectively obtain a large enhancement factor from the capture spot regions of a microarray by illuminating them in an optimal “on-resonance” condition, while at the same time illuminating the regions of a microarray between the capture spots in an “off-resonance” condition. In this way, the fluorescent signal emitted from active assay regions of the surface can be maximized, while the background fluorescence between spots can be minimized, thereby substantially improving image contrast. The problem of obtaining optimal and equal excitation conditions for an entire microarray is further exacerbated by the fact that the biomolecular density of immobilized capture spots is not completely uniform due to a variety of factors that include spot buffer concentration variability, capture spot density nonuniformity, surface chemistry nonuniformity, capture molecule binding affinity variation, analyte molecular weight, and analyte concentration in the test sample. As a result, no two spots in a microarray are guaranteed to have the same optimal resonant coupling condition, and optimally resonant conditions can even vary within a single spot.
In this work, we demonstrate a detection instrument and image processing approach that takes full advantage of the optimally available enhancement factor for a PCEF surface for every location of a PC surface. The method utilizes a label-free image of the microarray capture spots to identify the locations of an array surface that are within a capture spot, and to differentiate “on-spot” regions from those that are “between spots.” To obtain optimum on-resonance coupling for the entire microarray in the presence of differences in immobilized spot density, a series of fluorescent images are rapidly gathered using a range of incident angles separated by small angle increments. An image processing algorithm is applied that generates a composite fluorescent image in which the maximum fluorescent intensity is selected for on-spot regions on a pixel-by-pixel basis, while between-spot regions are displayed using data collected in an off-resonance condition. The method is demonstrated to substantially improve the contrast of microarray images while maximizing the uniformity of the fluorescent image through the application of a uniform enhancement factor. The method provides substantial gains in signal to noise for the cases where assays are specific and background fluorescence is low. However, in most biological assays, issues of high substrate autofluorescence, background fluorescence from blocking reagents and non-specific binding can minimize the gains in signal-to-noise ratio (SNR) provided by the PC’s enhancement capabilities. In such situations, selective enhancement is desirable to maximize image contrast and nullify the effects of non-specific binding.
The outline of this paper is as follows: Section 2 describes the basic functions of label-free imaging detection and fluorescence enhancement of the photonic crystal enhanced microscope (PCEM). Section 3 describes the scheme to generate a mask that selects the area for applying enhanced fluorescence detection. Section 4 implements this technique for characterizing the fluorescent antibody microarray on the PC surface. Using tumor necrosis factor-alpha (TNFα) as an example protein biomarker, the advantage of selectively enhanced fluorescence is demonstrated with reduced limit of detection for a small microarray. Section 5 presents this study’s conclusions.
2. Photonic crystal device structure and dual mode LF-EF detection instrument
2.1 Photonic crystal device structure fabricated by nanoimprint lithography
A schematic diagram of the PC surface is shown in Fig. 1a . The sub-wavelength grating is fabricated on a quartz substrate with refractive index of n=1.46. On top of the grating, a layer of high refractive index (n=2.35) TiO2 dielectric material is deposited as a light confinement layer that supports establishment of optical resonances. The electrical field associated with the resonant mode extends from the device surface into the surrounding medium. The wavelength and angle of incidence of the resonant modes is determined by the geometry of the structure. In this study, the PC structure was designed to exhibit strong optical resonances at two specific laser wavelengths, λ=633 nm and λ=690 nm. As described in Section 2.2, the λ=633 nm resonance will be used for fluorescence excitation, while the λ = 690 resonance will be used for label-free detection. To efficiently couple both lasers with the PC, the geometric parameters were determined by rigorous coupled wave analysis (Diffract Mod, Rsoft Design) with a grating period of Λ = 400 nm, grating depth of d = 50 nm, 30% duty cycle, and t = 140 nm thick TiO2 coating. The PC surface was fabricated over microscope-slide-sized quartz substrate (25×75 mm) by nanoimprint lithography as described in a previous publication [18]. An SEM image of a cross section of the PC surface is presented in Fig. 1b.
Fig. 1.
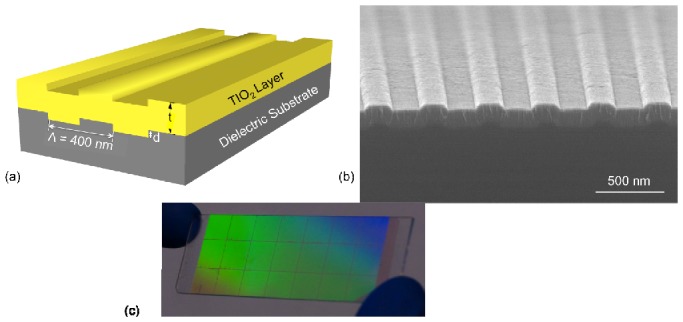
(a) Schematic diagram of the PC surface. The grating structure is patterned on a quartz substrate with period and duty cycle of 400 nm and 50%, respectively. (b) Cross sectional SEM image of the PC. (c) A photograph of a full 1×3 in2 PC device.
In order to predict the resonance modes, the transmission efficiency of the PC structure was simulated in the wavelength range of λ=600-800 nm and the incident angle was varied from 0°<θ<20°. The device resonance condition is identified by measuring the dip in the transmission efficiency when the PC is subjected to broadband illumination. By plotting the transmission efficiency as a function of wavelength and incident angle, Fig. 2 describes the photonic band diagram of the PC surface shown in Fig. 1. The photonic band diagram elucidates the conditions to be used for LF measurement and the optimal conditions for PCEF. For example, fluorescent excitation from a laser with λ=633 nm needs to be coupled at an incident angle of θ = 10.7°. This mode was chosen for fluorescence imaging since the target dye molecules (Cyanine-5 and LD-700) absorb strongly at this wavelength. The other resonant mode at λ=690 nm requires a near-normal incident angle of θ = 0.7° for label-free detection.
Fig. 2.
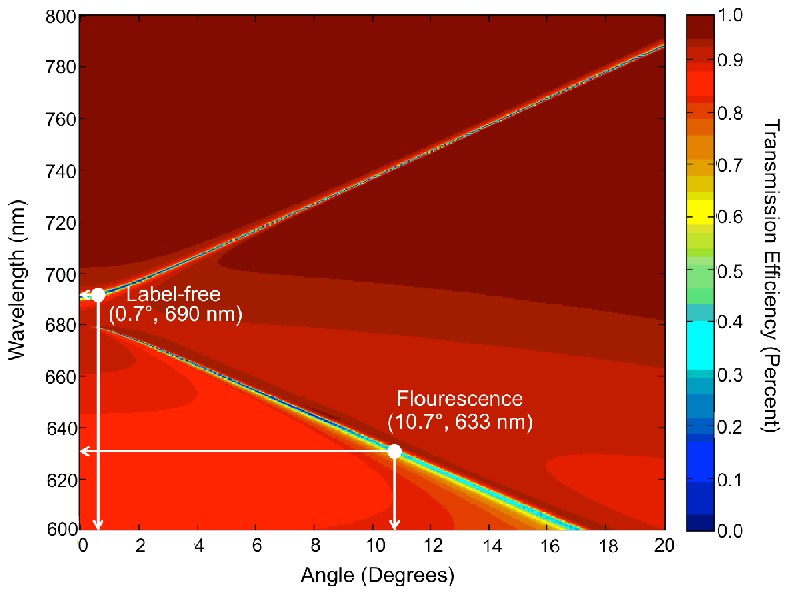
Simulated dispersion diagram for the PC structure of Fig. 1. The plot shows minima in transmission efficiency (corresponding to on-resonant coupling) at λ=690 nm and λ=633 nm for particular angles of incidence.
2.2 Apparatus for dual-mode LF-EF detection
Figure 3 shows a schematic of the PC enhanced microscope (PCEM) that combines the label-free and enhanced fluorescence imaging capabilities using a PC substrate. Two lasers are used in the system. A 35 mW HeNe laser (CV Melles Griot) at λ=632.8 nm was chosen to function as the excitation light source for fluorescence imaging and a 50 mW AlGaAs semiconductor diode laser (Crystal Laser) emitting at λ=690 nm was used for the label-free modality. A dichroic mirror (Semrock) is used to combine the two laser beams along a common path. The setup controls the angle of incidence for excitation light by employing a computer controlled rotational mirror and a linear translation stage beneath the PC. The incident angle can be tuned between θ=0° and 20° in increments as low as θ=0.005°. Both imaging modalities require the incident angle to be tuned. In the label-free mode, we tune the incident angle from θ=0° to 3° to cover the resonance angles over the entire field of view. For enhanced fluorescence imaging, the angle of incidence is scanned between θ=10° and 13°. For each modality, assuming we capture a sequence of 400 images at increments of 0.01°, the time required to capture each frame is approximately 12 seconds. This translates to a time of 9 minutes to scan a PC-microscope slide with a total of 48 frames of 2×2 mm2. The PC is held on a computer controlled x-y translation stage that allows the entire PC surface to be imaged in a tiled fashion, with adjacent fields of view compiled together to create an image of the entire PC.
Fig. 3.
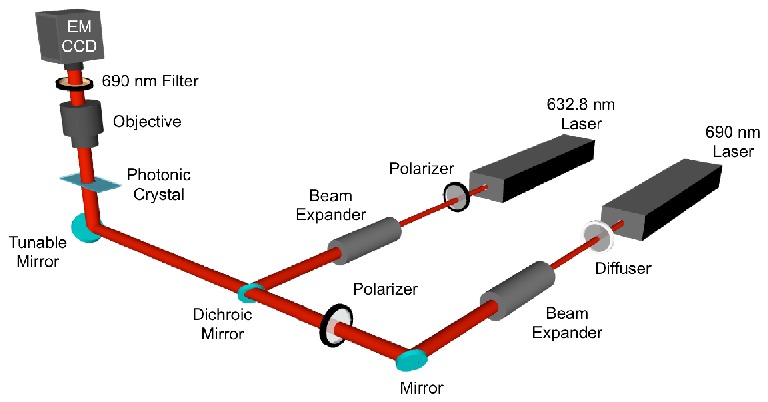
Schematic diagram of the PCEM using λ = 633 nm and λ = 690 nm lasers.
The imaging collection part of the setup was built upon an Olympus BX-51 upright microscope with a 4 × objective (N.A.=0.1, Olympus PLAN N) and electron multiplying CCD camera (9100-13, Hamamatsu). For fluorescence imaging, a bandpass emission filter (Semrock) is used. The filter blocks the light for the laser with λ = 633 nm (fluorescence excitation) with optical density of 7 but transmits the light from the λ=690 nm laser (label-free imaging). A single field of view is ~2×2 mm2.
The implementation of the PCEM is ideal for combined enhanced fluorescence and label-free imaging owing to several important features. First, it uses a common beam-path for both imaging modes, facilitating acquisition of spatially registered images of fluorescence and surface-bound molecular density. Second, the use of a λ=690 nm laser for label-free detection allows for rapid sequential image capture while eliminating the potential for photobleaching of fluorescent dye during label-free imaging. Third, the use of a charge-coupled device (CCD) rather than laser scanning imaging simplifies the optical setup and enables large-area, high-resolution and high-throughput analysis. Fourth, a high-resolution motorized gimbal-mounted mirror and beam-expanded laser provide efficient and selective light coupling to the PC, which is especially crucial for the narrow resonances that provide optimal fluorescence enhancement and sensitive label-free detection. Lastly, other imaging techniques available on the microscope, such as reflected brightfield and differential interference contrast, can be overlaid with enhanced fluorescence and label-free images.
3. Selective fluorescence enhancement on PC substrate
It has been demonstrated that the PC surface has the capability to enhance fluorescence emission from dye molecules located within the evanescent field of the PC structure [21]. While the emission from fluorescent-tagged molecules is enhanced, the same resonant near field will also enhance the output of any other fluorescent emitter that resides within the evanescent field, resulting in elevated “background” fluorescent signals. The background signals associated with the PC structure can include fluorescence from tagged molecules attached by nonspecific binding, surface chemistry layers, the TiO2, and the substrate. This background coexists with the fluorescence emission from molecules that we wish to detect, resulting in loss of contrast. Generally, capture molecules (single strand DNA or antibodies) are applied as an array of “spots” (50-500 μm diameter) in which the fluorescent signal from tagged analyte molecules are measured. We are therefore most interested in the signal obtained within the spot regions, and not interested in the fluorescent intensity in regions between the spot regions. This section describes the scheme applied to avoid fluorescent enhancement in regions between capture spots. The method relies on the recognition of an area of interest (AOI) via label-free imaging detection of the capture molecule spots deposited on the PC surface. The label-free detection relies on monitoring changes in the optical resonance angle of the PC as capture molecules are attached to the PC. The area in which capture molecule spots are present is defined as the AOI and identified as the region that requires fluorescence signal enhancement.
As an illustration of this approach, we used photolithography to create a high contrast pattern (in the image of George Washington) on the PC surface with two distinct resonant coupling conditions via deposition of a 10 nm SiO2 thin film only in the transparent regions of the image. The SiO2 layer shifts the resonant angle of the PC by a small amount relative to regions without added SiO2. After patterning, a uniform layer of fluorescent dyed polymer film is applied over the entire PC. By differentiating two distinct regions (with SiO2 or without added SiO2), we demonstrate that it is possible to selectively obtain fluorescent enhancement from either region through proper adjustment of the illumination angle of the λ = 633 nm laser.
3.1 Label-free imaging using the PC
In order to generate a label-free image of the deposited SiO2 pattern, we first captured a sequence of images of the PC illuminated by the λ = 690 nm laser with the angle of incidence varying from θ = 0° to 2°. The images are used to record changes in transmission intensity at each angle. The resonant angle is the designated angle of minimum transmission (AMT) of incident light through the PC. This AMT is computed for each pixel in the image stack by fitting the transmission versus angle data with a polynomial function and finding the angle corresponding to the minima of the fitted curve [28]. The spatial distribution of AMT represents a label-free image of the SiO2 density, and is analogous to the density of deposited biomolecule capture spots.
The resulting label-free image of the SiO2 pattern is shown in Fig. 4a . It can be seen that the resonant angle ranges from θ = 1.07° to 1.65°. The difference in the resonant angle between the two regions is θ≈0.35°. Figure 4b shows the transmission spectra measured on and off the pattern, demonstrating a clearly measurable change in the angle of resonance. As shown in Fig. 4c, the resonant angle can be used to generate a “mask” that bins each pixel into a region identified as with/without additional SiO2 based on selection of a resonant angle threshold. In order to calculate the threshold angle θTA, we selected a background region known not to contain capture spots on the AMT image as our control. The average angle and the standard deviation in the angle were calculated for the control region. A threshold angle was determined as angle three standard deviations above the average background angle. It is important to note that if the separation between the “on spot” and “between spot” regions is less than three standard deviations of the variation in the control region for that frame, this technique is not applicable. The fluorescence excitation laser illumination conditions can then be selected to be “on-resonance” with only one region for enhanced fluorescence, while the other regions is illuminated under “off-resonance” conditions. This capability is shown in Fig. 5 , in which the entire PC is coated with a uniform fluorescent polymer thin film (~50 nm film of SU8 doped with LD-700 dye applied by spin-coating), but either region can be enhanced based on selection of the fluorescent illumination angle.
Fig. 4.
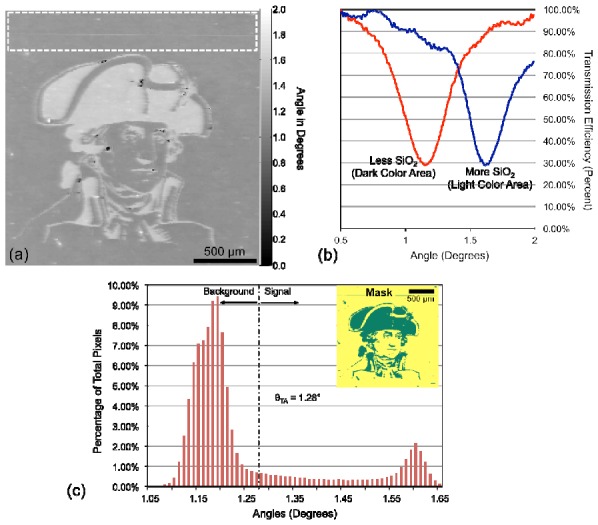
(a) Label-free image of the PC with a pattern of deposited 10 nm SiO2 film. The image clearly highlights the variation in resonance angle in the transparent and opaque areas of the pattern Our selection of a negative control region is highlighted with a white dashed box. (b) Transmission spectrum of the pattern showing the difference in angle of resonance (minima in transmission) for the areas with and without additional SiO2. More SiO2 gives a larger resonance angle. (c) Histogram showing the distribution of resonance angle versus the number of pixels used to make our selection of the threshold angle. The inset image shows the mask generated by using the threshold set by θTA = 1.28 °. The green region has a resonance angle above the threshold angle and the yellow region has a resonance angle below the threshold angle.
Fig. 5.
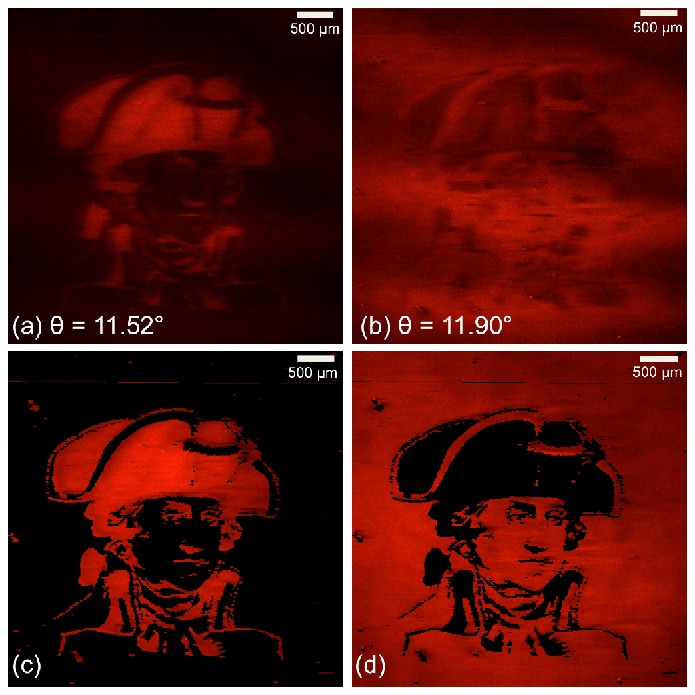
(a) Fluorescence images taken at single angle θ = 11.52 ° where the region with the SiO2 coating satisfying resonant condition (b) Fluorescence images taken at single angles θ = 11.9 ° where the region without SiO2 coating is satisfying the resonant condition. (c) Selectively enhanced “signal” fluorescence image showing superior contrast to (a). (d) Selectively enhanced “background” fluorescence image showing superior contrast to (b).
To optimize image contrast for a selected region, we capture a sequence of fluorescence images over a range of angles to ensure that we always achieve the resonant coupling condition for each pixel somewhere within the range and thus the maximum possible fluorescence signal from each pixel. To generate a selectively enhanced “signal” fluorescence image we choose the maximum fluorescence signal value for every pixel above the threshold and the minimum value for every pixel below the threshold. To generate a selectively enhanced “background” fluorescence image we choose the minimum fluorescence signal value for every pixel above the threshold and a maximum value for every pixel below the threshold. Figures 5c and 5d show the fluorescence images after the mask (shown in Fig. 5a and 5b) was applied to the sequence of fluorescence images. We notice a clear enhancement in the contrast of our image showing the efficacy of the technique.
Similar to this example, there is a distinct difference between the on-spot and between-spot regions of a microarray that can be measured using label-free imaging of the capture spot density. The difference in AMT between on-spot and between-spot regions can be used to select a threshold that can be used to selectively enhance fluorescence from the regions of a microarray within a capture spot.
4. Application to a Cytokine Immunoassay
The developed fluorescence detection approach is especially useful for protein and DNA microarray applications that require highly concentrated capture proteins or oligonucleotide probes. One such application is the sandwich “Enzyme Linked Immunosorbent Assay” (ELISA). The sandwich ELISA in a microarray format is well suited for clinically relevant analyses [38, 39]. This is because the sandwich ELISA is the standard assay used in the clinic for analyzing low-abundance proteins in complex biological fluids such as blood. Like the clinical assays, the ELISA microarray assays are exceptionally sensitive, being able to accurately quantify proteins down to the single-digit or sub-pg/ml concentrations [39]. The assay is performed by deposition of array of antibody capture spots upon a substrate (such as glass, or alternatively a PC), using several replicate spots per antibody to enable observation of experimental variability. After a “blocking” step that covers the substrate surface with molecules that inhibit subsequent nonspecific binding, the chip is exposed to the test sample, providing opportunity for analyte molecules to bind with their corresponding capture antibodies [40, 41]. Biotin-linked secondary antibodies for each of the assays are combined and exposed to the chip as a mix, where they bind an unoccupied epitope of the targeted captured antigen. The final assay step is introduction of fluorophore-labeled streptavidin that attaches only to the biotinylated detection antibodies. Full details of the procedure have been published in several papers [6, 31, 32, 38–44].
As an illustrative example of the application of our selective fluorescence amplification approach to a sandwich ELISA, an antibody microarray chip was prepared by immobilizing capture antibodies for the cancer biomarker TNF-α using a spotting buffer solution with a high concentration. On a PC chip, the regions with immobilized capture antibodies exhibit large resonance shifts that are detected and quantified by the label-free imaging mode of PCEM. By analyzing the recorded label-free image, the capture antibody spots are recognized and assigned as the AOIs to be selectively enhanced for fluorescence detection.
In preparation for the assay, epoxysilane-based surface chemistry was applied to the PC surface by a vapor-phase deposition of 3-glycidoxypropyl-trimethoxysilane [32] in a vacuum oven. The PC surface was divided into 6 separate regions by drawing ~2 mm wide hydrophobic barriers between arrays with a hydrophobic pen (Super HT Pap Pen, Research Products International Corp.). As an immobilized capture molecule, the antibody for TNF-α was diluted in phosphate buffered saline (PBS) to a concentration of 0.8 mg/ml and 9 replicate spots per assay were printed in each array on PC slides using a noncontact printer (Piezorray, Perkin Elmer). Following printing, the slides were incubated overnight in a humid chamber maintained at 4°C. The slides were then blocked in a solution of 1% casein (Bio-Rad) in PBS for 1 h at room temperature. To generate a dose-response curve, a four-fold dilution series of the TNF-α antigen (BioRad) in PBS for a total of six concentrations (1000 pg/ml, 250 pg/ml, 62.5 6g/ml 15.6 pg/ml, 3.9 pg/ml and 0.97 pg/ml) was added onto the slide surface. After overnight incubation at room temperature, the PC was washed in PBS-T, followed by incubation with biotinylated secondary detection antibody for TNF-α at 200 ng/ml in PBS-T for 2 h. The PC was washed with PBS-T to remove excess secondary antibodies and was incubated in a solution of 1 µg/ml streptavidin-Cyanine 5 (GE Healthcare) in PBS-T for 30 min. Finally, the slides were washed in PBS-T, and blow dried to remove standing liquid.
To identify the capture spots on the PC, the slide was scanned using the PCEM in the label-free mode. The incident angle of the λ = 690 nm laser was scanned from θ = 0° to 3° which covered the resonant angles of the both spot resonance and background resonance. The label-free image (AMT map) of the PC is shown in Fig. 6a . The region spotted with capture antibody has resonant angle between θ = 0.50° and 1.62°, while the resonant angle of the background area ranges from θ = 1.05° to 1.75°. In order to discriminate the spots from background, we set the AMT threshold (from left to right in Fig. 6c) as θTA = 1.62°, 1.30°, 1.05°, 1.10°, 1.00° and 1.20° respectively for each imaged field of view. If a pixel on the label-free image has an AMT value smaller than θTA, this pixel will be recognized as a pixel in the on-spot region. As described in the previous example, the AMT threshold provides a criterion to generate a mask for the consequent fluorescence measurement. (It is important to note here that the threshold angle is determined by the relative position of the PC resonance peak at normal incidence with respect to the excitation wavelength of 690 nm. This peak position is altered to higher wavelength values by any alteration to the effective refractive index of the PC. In the previous example the position of the resonance peak at normal incidence was above 690 nm. Thus, adding extra SiO2 caused the peak to shift further away from 690 nm resulting in a larger resonance angle to achieve coupling in the regions with more SiO2. For the present case, the device used had a resonance peak, at normal incidence, below 690 nm. Therefore, the presence of additional material, TNF-α spots, resulted in a peak closer to 690 nm thereby needing a smaller resonance angle to achieve coupling.) The fluorescence images were acquired with the λ = 632.8 nm laser, for which the resonant angle of the PC lies between θ = 9.75° −10.25°. A series of 51 fluorescent images were recorded with excitation angle varied between θ = 9.5° and 10.5°. At θ = 10.0° (which is close to the resonant angle of the spotted area), the fluorescent image is shown in Fig. 6b. While applying the pre-generated mask, only the signals from the spotted region were enhanced. Figure 6c shows the selectively enhanced fluorescence image. Compared with Fig. 6b, the spot-to-spot signal intensity in Fig. 6c is more uniform for any given frame and background signal is lower.
Fig. 6.
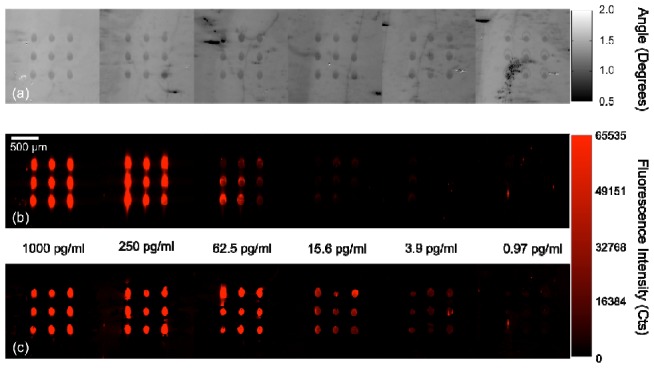
TNF-α detection performed on a PC using a sandwich ELISA assay. The antigen concentration decreases from left to right. (a) Label-free image of the PC surface showing the presence of capture antibody spots on the sensor. (b) Fluorescence detection at a single resonance angle of 10° after assay is completed. (c) Fluorescence detection using the masked detection for the same PC surface showing improved contrast, recognition and uniformly higher fluorescence output.
To quantify the spot and slide background intensities, an image processing software package (ImageJ) was used. The average fluorescence intensity was measured from all nine spots for each concentration, and the standard deviation was calculated. The measured data for fluorescence detection with and without applying the label-free mask are compared in Fig. 7 . It is evident that the fluorescence signal measured at a single angle for the concentrations of 3.9 pg/ml and 0.97 pg/ml are indistinguishable. However after applying the masked detection, the fluorescence signal measured at 0.97 pg/ml is distinctly different than that of the 3.9 pg/ml TNF-α concentration. It can also be inferred that while the minimum detectable concentration for single-angle fluorescence detection is greater than 3.9 pg/ml, the masked detection method reduces the lowest detectable concentration below 0.97 pg/ml.
Fig. 7.
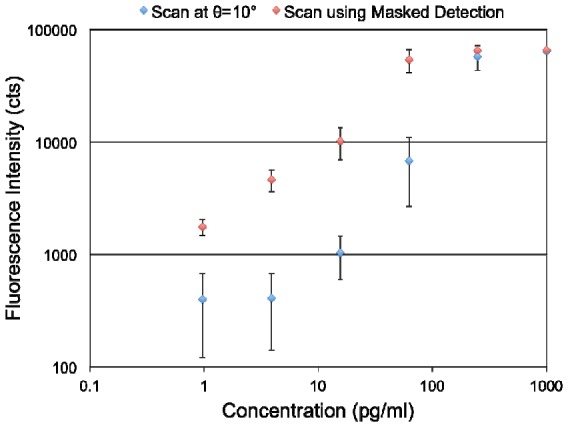
Plot comparing the fluorescence intensities versus concentration of TNF-α for a measuremnet performed at a fixed angle of 10° and a scanned-angle measurement using the masked detection method.
5. Conclusion
We have developed and demonstrated a scheme to selectively enhance fluorescence emission on a PC surface from regions that contain capture molecules, such as those used in DNA or protein microarrays. This approach is possible because the capture molecules, deposited with a high surface mass density, will modify the resonant coupling conditions that are used to obtain enhanced fluorescence. Thus, on-spot and between-spot regions can be selectively illuminated under on-resonance or off-resonance conditions. The label-free image of the capture spot density is quantified by generating a spatial map of the Angle of Minimum Transmission (AMT) from the PC surface, which is used to distinguish on-spot and between-spot regions using a user-defined AMT threshold. In order to avoid photobleaching during the label-free imaging process, a longer wavelength laser excitation source was selected with photons of insufficient energy to excite fluorescence. The photonic dispersion diagram was used to reveal the relationship between the incidence angle and wavelength of the excitation beam, and selection of incident angles for label-free imaging and fluorescent imaging. During fluorescence measurement, a series of fluorescence images are gathered over a small range of angles, assuring that every on-spot region is illuminated under optimal coupling conditions in order to maximize the fluorescent enhancement factor on a pixel-by-pixel basis. A simple image processing approach is used to generate a composite fluorescent image from the angle-scanned individual images.
The approach described in this work can be broadly applied to any surface-based fluorescence assay performed on a PC to improve image contrast, to reduce assay CV caused by myriad sources of spot-to-spot variability, and to lower limits of detection. One such assay is the fluorescent sandwich ELISA, which is a commonly used format for multiplexed detection of cancer biomarkers in serum. We illustrated the application of our imaging approach using an assay for the cancer biomarker TNF-α. Compared to assay data obtained with a fixed incidence angle for fluorescence detection, the new scheme helps to lower the limit of detection from 3.9 pg/ml to 0.97 pg/ml with the promise of going even lower.
Acknowledgment
This work was supported by SRU Biosystems, the National Science Foundation ( CBET 07-54122), and the National Institutes of Health ( R01 GM086382). Any opinions, findings, and conclusions or recommendations expressed in this material are those of the authors and do not necessarily reflect the views of the National Science Foundation. The authors would like to thank colleagues from the Nano Sensors Group for their suggestions and input.
References and links
- 1.M. Schena and R. W. Davis, “Genes, Genomes, and chips,” in DNA Microarrays: A Practical Approach, M. Schena, ed. (Oxford Press, New York, 1999). [Google Scholar]
- 2.R. Beneke, “Microarray detection with laser scanning device,” in Advanced Methods: DNA Microarrays, U. A. Nuber, ed. (Taylor & Francis Group, New York, 2005). [Google Scholar]
- 3.Sabanayagam C. R., Lakowicz J. R., “Increasing the sensitivity of DNA microarrays by metal-enhanced fluorescence using surface-bound silver nanoparticles,” Nucleic Acids Res. 35(2), e13 (2006). 10.1093/nar/gkl1054 [DOI] [PMC free article] [PubMed] [Google Scholar]
- 4.Irizarry R. A., Warren D., Spencer F., Kim I. F., Biswal S., Frank B. C., Gabrielson E., Garcia J. G., Geoghegan J., Germino G., Griffin C., Hilmer S. C., Hoffman E., Jedlicka A. E., Kawasaki E., Martínez-Murillo F., Morsberger L., Lee H., Petersen D., Quackenbush J., Scott A., Wilson M., Yang Y., Ye S. Q., Yu W., “Multiple-laboratory comparison of microarray platforms,” Nat. Methods 2(5), 345–350 (2005). 10.1038/nmeth756 [DOI] [PubMed] [Google Scholar]
- 5.Fu Y., Lakowicz J. R., “Enhanced fluorescence of Cy5-labeled DNA tethered to silver island films: fluorescence images and time-resolved studies using single-molecule spectroscopy,” Anal. Chem. 78(17), 6238–6245 (2006). 10.1021/ac060586t [DOI] [PMC free article] [PubMed] [Google Scholar]
- 6.Zangar R. C., Varnum S. M., Bollinger N., “Studying cellular processes and detecting disease with protein microarrays,” Drug Metab. Rev. 37(3), 473–487 (2005). 10.1080/03602530500205309 [DOI] [PubMed] [Google Scholar]
- 7.Zangar R. C., Daly D. S., White A. M., “ELISA microarray technology as a high-throughput system for cancer biomarker validation,” Expert Rev. Proteomics 3(1), 37–44 (2006). 10.1586/14789450.3.1.37 [DOI] [PubMed] [Google Scholar]
- 8.Kingsmore S. F., “Multiplexed protein measurement: technologies and applications of protein and antibody arrays,” Nat. Rev. Drug Discov. 5(4), 310–321 (2006). 10.1038/nrd2006 [DOI] [PMC free article] [PubMed] [Google Scholar]
- 9.MacBeath G., Schreiber S. L., “Printing proteins as microarrays for high-throughput function determination,” Science 289(5485), 1760–1763 (2000). [DOI] [PubMed] [Google Scholar]
- 10.Jin H., Zangar R. C., “Protein modifications as potential biomarkers in breast cancer,” Biomark. Insights 4, 191–200 (2009). [DOI] [PMC free article] [PubMed] [Google Scholar]
- 11.Arima Y., Teramura Y., Takiguchi H., Kawano K., Kotera H., Iwata H., “Surface plasmon resonance and surface plasmon field-enhanced fluorescence spectroscopy for sensitive detection of tumor markers,” Methods Mol. Biol. 503, 3–20 (2009). 10.1007/978-1-60327-567-5_1 [DOI] [PubMed] [Google Scholar]
- 12.Shtoyko T., Matveeva E. G., Chang I.-F., Gryczynski Z., Goldys E., Gryczynski I., “Enhanced fluorescent immunoassays on silver fractal-like structures,” Anal. Chem. 80(6), 1962–1966 (2008). 10.1021/ac7019915 [DOI] [PMC free article] [PubMed] [Google Scholar]
- 13.Geddes C. D., Parfenov A., Roll D., Uddin M. J., Lakowicz J. R., “Fluorescence Spectral Properties of Indocyanine Green on a Roughened Platinum Electrode: Metal-Enhanced Fluorescence,” J. Fluoresc. 13(6), 453–457 (2003). 10.1023/A:1016875709579 [DOI] [PMC free article] [PubMed] [Google Scholar]
- 14.Fu Y., Lakowicz J. R., “Enhanced fluorescence of Cy5-labeled DNA tethered to silver island films: fluorescence images and time-resolved studies using single-molecule spectroscopy,” Anal. Chem. 78(17), 6238–6245 (2006). 10.1021/ac060586t [DOI] [PMC free article] [PubMed] [Google Scholar]
- 15.Lakowicz J. R., “Radiative decay engineering 5: metal-enhanced fluorescence and plasmon emission,” Anal. Biochem. 337(2), 171–194 (2005). 10.1016/j.ab.2004.11.026 [DOI] [PMC free article] [PubMed] [Google Scholar]
- 16.Sokolov K., Chumanov G., Cotton T. M., “Enhancement of molecular fluorescence near the surface of colloidal metal films,” Anal. Chem. 70(18), 3898–3905 (1998). 10.1021/ac9712310 [DOI] [PubMed] [Google Scholar]
- 17.Kümmerlen J., Leitner A., Brunner H., Aussenegg F. R., Wokaun A., “Enhanced dye fluorescence over silver island films: analysis of the distance dependence,” Mol. Phys. 80(5), 1031–1046 (1993). 10.1080/00268979300102851 [DOI] [Google Scholar]
- 18.Pokhriyal A., Lu M., Chaudhery V., Huang C.-S., Schulz S., Cunningham B. T., “Photonic crystal enhanced fluorescence using a quartz substrate to reduce limits of detection,” Opt. Express 18(24), 24793–24808 (2010). 10.1364/OE.18.024793 [DOI] [PMC free article] [PubMed] [Google Scholar]
- 19.Wu H. Y., Zhang W., Mathias P. C., Cunningham B. T., “Magnification of photonic crystal fluorescence enhancement via TM resonance excitation and TE resonance extraction on a dielectric nanorod surface,” Nanotechnology 21(12), 125–203 (2010). 10.1088/0957-4484/21/12/125203 [DOI] [PubMed] [Google Scholar]
- 20.Ganesh N., Zhang W., Mathias P. C., Chow E., Soares J. A. N. T., Malyarchuk V., Smith A. D., Cunningham B. T., “Enhanced fluorescence emission from quantum dots on a photonic crystal surface,” Nat. Nanotechnol. 2(8), 515–520 (2007). 10.1038/nnano.2007.216 [DOI] [PubMed] [Google Scholar]
- 21.Ganesh N., Mathias P. C., Zhang W., Cunningham B. T., “Distance dependence of fluorescence enhancement from photonic crystal surfaces,” J. Appl. Phys. 103(8), 083104 (2008). 10.1063/1.2906175 [DOI] [Google Scholar]
- 22.Block I. D., Chan L. L., Cunningham B. T., “Photonic crystal optical biosensor incorporating structured low-index porous dielectric,” Sens. Actuators B Chem. 120(1), 187–193 (2006). 10.1016/j.snb.2006.02.006 [DOI] [Google Scholar]
- 23.Ganesh N., Cunningham B. T., “Photonic-crystal near-ultraviolet reflectance filters fabricated by nanoreplica molding,” Appl. Phys. Lett. 88(7), 071110–071113 (2006). 10.1063/1.2173718 [DOI] [Google Scholar]
- 24.Block I. D., Chan L. L., Cunningham B. T., “Large-Area submicron replica molding of porous low-k dielectric films and application to photonic crystal biosensor fabrication,” Microelectron. Eng. 84(4), 603–608 (2007). 10.1016/j.mee.2006.12.011 [DOI] [Google Scholar]
- 25.Chou S. Y., Krauss P. R., Renstrom P. J., “Imprint of sub-25 nm vias and trenches in polymers,” Appl. Phys. Lett. 67(21), 3114–3116 (1995). 10.1063/1.114851 [DOI] [Google Scholar]
- 26.Chou S. Y., Krauss P. R., Renstrom P. J., “Imprint Lithography with 25-Nanometer Resolution,” Science 272(5258), 85–87 (1996). 10.1126/science.272.5258.85 [DOI] [Google Scholar]
- 27.Mathias P. C., Wu H.-Y., Cunningham B. T., “Employing two distinct photonic crystal resonances to improve fluorescence enhancement,” Appl. Phys. Lett. 95(2), 021111 (2009). 10.1063/1.3184573 [DOI] [PMC free article] [PubMed] [Google Scholar]
- 28.Block I. D., Mathias P. C., Ganesh N., Jones S. I., Dorvel B. R., Chaudhery V., Vodkin L. O., Bashir R., Cunningham B. T., “A detection instrument for enhanced-fluorescence and label-free imaging on photonic crystal surfaces,” Opt. Express 17(15), 13222–13235 (2009). 10.1364/OE.17.013222 [DOI] [PMC free article] [PubMed] [Google Scholar]
- 29.Chaudhery V., Lu M., Huang C. S., George S., Cunningham B. T., “Photobleaching on photonic crystal enhanced fluorescence surfaces,” J. Fluoresc. 21(2), 707–714 (2011). 10.1007/s10895-010-0760-8 [DOI] [PubMed] [Google Scholar]
- 30.Mathias P. C., Jones S. I., Wu H. Y., Yang F., Ganesh N., Gonzalez D. O., Bollero G., Vodkin L. O., Cunningham B. T., “Improved sensitivity of DNA microarrays using photonic crystal enhanced fluorescence,” Anal. Chem. 82(16), 6854–6861 (2010). 10.1021/ac100841d [DOI] [PMC free article] [PubMed] [Google Scholar]
- 31.Mathias P. C., Ganesh N., Cunningham B. T., “Application of photonic crystal enhanced fluorescence to a cytokine immunoassay,” Anal. Chem. 80(23), 9013–9020 (2008). 10.1021/ac801377k [DOI] [PubMed] [Google Scholar]
- 32.Huang C.-S., George S., Lu M., Chaudhery V., Tan R., Zangar R. C., Cunningham B. T., “Application of photonic crystal enhanced fluorescence to cancer biomarker microarrays,” Anal. Chem. 83(4), 1425–1430 (2011). 10.1021/ac102989n [DOI] [PMC free article] [PubMed] [Google Scholar]
- 33.Cunningham B. T., Lin B., Qiu J., Li P., Pepper J., Hugh B., “A plastic colorimetric resonant optical biosensor for multiparallel detection of label-free biochemical interactions,” Sens. Actuators B Chem. 85(3), 219–226 (2002). 10.1016/S0925-4005(02)00111-9 [DOI] [Google Scholar]
- 34.Cunningham B. T., Li P., Schulz S., Lin B., Baird C., Gerstenmaier J., Genick C., Wang F., Fine E., Laing L., “Label-free assays on the BIND system,” J. Biomol. Screen. 9(6), 481–490 (2004). 10.1177/1087057104267604 [DOI] [PubMed] [Google Scholar]
- 35.Challener W. A., Edwards J. D., McGowan R. W., Skorjanec J., Yang Z., “A multilayer grating-based evanescent wave sensing technique,” Sens. Actuators B Chem. 71(1-2), 42–46 (2000). 10.1016/S0925-4005(00)00588-8 [DOI] [Google Scholar]
- 36.George S., Block I. D., Jones S. I., Mathias P. C., Chaudhery V., Vuttipittayamongkol P., Wu H. Y., Vodkin L. O., Cunningham B. T., “Label-free prehybridization DNA microarray imaging using photonic crystals for quantitative spot quality analysis,” Anal. Chem. 82(20), 8551–8557 (2010). 10.1021/ac101551c [DOI] [PubMed] [Google Scholar]
- 37.Chaudhery V., Lu M., Pokhriyal A., Schulz S. C., Cunningham B. T., “Angle-scanning photonic crystal enhanced fluorescence microscopy,” IEEE Sens. J. (Accepted). [Google Scholar]
- 38.Zangar R., Woodbury R., Varnum S., “Development of a user-friendly microarray ELISA for the analysis of potential protein markers of breast cancer,” FASEB J. 17, A986–A986 (2003). [Google Scholar]
- 39.Woodbury R. L., Varnum S. M., Zangar R. C., “Elevated HGF levels in sera from breast cancer patients detected using a protein microarray ELISA,” J. Proteome Res. 1(3), 233–237 (2002). 10.1021/pr025506q [DOI] [PubMed] [Google Scholar]
- 40.Seurynck-Servoss S. L., Baird C. L., Rodland K. D., Zangar R. C., “Surface chemistries for antibody microarrays,” Front. Biosci. 12(8-12), 3956–3964 (2007). 10.2741/2362 [DOI] [PubMed] [Google Scholar]
- 41.Gonzalez R. M., Seurynck-Servoss S. L., Crowley S. A., Brown M., Omenn G. S., Hayes D. F., Zangar R. C., “Development and validation of sandwich ELISA microarrays with minimal assay interference,” J. Proteome Res. 7(6), 2406–2414 (2008). 10.1021/pr700822t [DOI] [PubMed] [Google Scholar]
- 42.Zangar R. C., Daly D. S., White A. M., Servoss S. L., Tan R. M., Collett J. R., “ProMAT calibrator: A tool for reducing experimental bias in antibody microarrays,” J. Proteome Res. 8(8), 3937–3943 (2009). 10.1021/pr900247n [DOI] [PubMed] [Google Scholar]
- 43.Varnum S. M., Woodbury R. L., Zangar R. C., “A protein microarray ELISA for screening biological fluids,” Methods Mol. Biol. 264, 161–172 (2004). [DOI] [PubMed] [Google Scholar]
- 44.Servoss S. L., Gonzalez R., Varnum S., Zangar R. C., “High-throughput analysis of serum antigens using sandwich ELISAs on microarrays,” Methods Mol. Biol. 520, 143–150 (2009). 10.1007/978-1-60327-811-9_10 [DOI] [PubMed] [Google Scholar]


