Abstract
To measure nanometric features with super-resolution requires that the stage, which holds the sample, be stable to nanometric precision. Herein we introduce a new method that uses conventional equipment, is low cost, and does not require intensive computation. Fiduciary markers of approximately 1 µm x 1 µm x 1 µm in x, y, and z dimensions are placed at regular intervals on the coverslip. These fiduciary markers are easy to put down, are completely stationary with respect to the coverslip, are bio-compatible, and do not interfere with fluorescence or intensity measurements. As the coverslip undergoes drift (or is purposely moved), the x-y center of the fiduciary markers can be readily tracked to 1 nanometer using a Gaussian fit. By focusing the light slightly out-of-focus, the z-axis can also be tracked to < 5 nm for dry samples and <17 nm for wet samples by looking at the diffraction rings. The process of tracking the fiduciary markers does not interfere with visible fluorescence because an infrared light emitting diode (IR-LED) (690 and 850 nm) is used, and the IR-light is separately detected using an inexpensive camera. The resulting motion of the coverslip can then be corrected for, either after-the-fact, or by using active stabilizers, to correct for the motion. We applied this method to watch kinesin walking with ≈8 nm steps.
OCIS codes: (110.0180) Microscopy, (180.2520) Fluorescence microscopy
1. Introduction
In the past decade many methods have been developed to overcome the optical diffraction limit of resolution (≈250 nm) [1,2]. One earlier method, which relied on visualizing single fluorescent molecule, called FIONA (Fluorescence Imaging with One Nanometer Accuracy), allowed one to get nanometer position accuracy of single fluorophores, both in vitro [3,4] and in vivo [5]. This is most useful for molecular tracking. By having single fluorophore-molecules blink on and off, extensions of this technique allowed one to get resolution, or the distance between identical [3,5] or nearly identical [6,7] molecules to within a few nanometers. Other super-resolution microscopic techniques followed, under the names [F]PALM or STORM [8–10]. These have recently been extended to analyzing a few (< 10-20) molecules at a time [11,12]. Non-single-molecule techniques were also developed with sub-diffraction resolution, generally known as STED or SIM [13,14]. These techniques opened the era to visualize biological systems with sub-diffraction limited resolution.
However, if the sample stage drifts while taking an image, one is limited in the ability to track small movements throughout an image sequence. Unfortunately, most commercial sample stages are quite unstable, drifting typically on the order of a nanometer per second. To apply high-resolution techniques with stage drift, several ways can be used [8,9,15,16]. Perhaps the simplest and most straightforward method is to use gold nanoparticles or fluorescence beads that can be used as fiduciary markers. The stage drift is then calculated by measuring displacement traces of these markers. However, using beads or nanoparticles can affect the real signal in terms of background and fluorescence [8]. Furthermore, even though these beads are immobilized on the surface, they frequently move due to the thermal fluctuation or other perturbations. In addition, getting the right concentration so there are one or a few beads per field-of-few is awkward. Nevertheless, this technique is frequently used [17] and is imbedded in the ImageJ plugin for PALM/STORM [18]. The second way is to use active feedback equipment to stabilize the stage [9,19]. This method works well, but it requires extra equipment such as a position-sensitive detector and a high-precision piezo stage, significantly increasing the cost. The last method is the cross-correlation method, which uses the fluorescence signal from sample, without any external fiduciary markers [15,16]. In the case of PALM or STORM imaging, any stage drift blurs the emission spots. Thus, to correct stage drift at every image frame, some spots are selected, and then the drift distances from the initial point are measured. This is accomplished by calculating the cross-correlation between a spot in the initial frame and the corresponding spot of the next frame. By repeating this process to the last frame, stage drift can be corrected. Typically, this method gives around 18 nm resolution in 3D [17], with a modified version achieving an impressive 5 nm resolution [20]. It is not a perfect method to correct stage drift because the fluorescence spot is not moving in same reference system as that of coverslip. Furthermore, this method is difficult to apply to molecular tracking studies. Herein we introduce a simple and effective method to correct stage drift. The idea is based on tracking a fiduciary marker, which is made from a polymer that is fixed on the coverslip, and which does not affect the single-molecule fluorescence.
2. Experiment
To make fiduciary markers with a polymer on the coverslip, we employed the soft lithography method [21]. First, we made a template of the marker pattern, which is a square (1 μm x 1 μm x 1 μm) or a circular (1 μm diameter and 1 μm height) pillar, on Si wafer. For making mask pattern on Si wafer, we spin coated with PMMA (A4, 950K) at 4000 rpm for 1min and baked at 200 °C for 2 min. The coated Si wafer was then exposed e-beam at 50 kV with 3 nA beam current and developed in MIBK:IPA (1:2, organic solvent mixture, Micro-Chem) for 2 min and rinsed in IPA for 30 sec. 50 nm Cr was then deposited with e-beam evaporator and then etched in STS ICP etcher for 1 min. This Si template was coated with silicon nitride (Si3N4), which allows the template to serve as a non-sticky mold. The Si template was then exposed to (Tridecafluoro-1,1,2,2-tetrahydrooctyl) trichlorosilane to make the self-assembled monolayer that helps it to be easily peeled off the PDMS mold (Polydimethylsiloxane, Sylgard 186, Dow Corning). We poured the PDMS onto the Si template to make a mold of the fiduciary markers and then baked it to solidify the PDMS. Then the PDMS mold was then peeled off from the Si template. Next, we molded PDMS wells using UV curable glue (UV curable poly urethane, NOA 61, Thorlab) on a glass coverslip to make fiduciary markers and incubate 30 ~ 40 min with UV light for curing. Alternatively, the fiduciary markers can be made using 3% PMMA (Polymethyl-methacrylate-MW 97000, Sigma-Aldrich 370037) dichloromethane solution instead of UV curable glue.
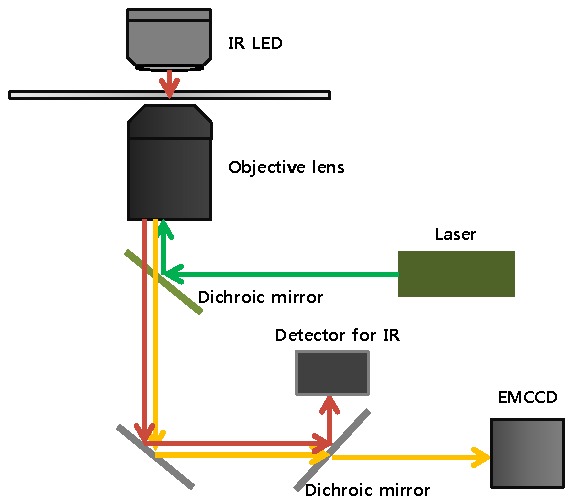
To track the fiduciary marker we use an IR-LED (850 nm, ELJ-850-629, Roithner LaserTechnik) placed opposite to the objective lens without a condenser (Fig. 1 ). We use an inverted microscope, although an upright microscope can also be used. The scattered IR light is completely excluded from visible-light fluorescence arising from common fluorophores by using a simple dichroic in the emission path. IR illumination also avoids autofluorescence that may add to the signal background. The IR illumination is collected by the objective lens (Olympus, 100 X, NA = 1.40) and detected by a simple camera (JAI Ltd., CV-A55 IR E). We note that Total Internal Reflection (TIR) for the IR light is not used. However, simultaneously, the objective lens is often used in TIR mode for collecting the visible fluorescence (Fig. 1). The optical configuration is simply designed to observe the visible-light fluorescence from the biological sample and IR scattering for the fiduciary marker, which is place in the same side of the coverslip as the sample, at the same time (Fig. 1).
Fig. 1.

The optical configuration to track the fiduciary markers using IR scattering with the Total Internal Reflection Fluorescence.
TTL pulses synchronize the IR and visible cameras with each other so that the IR and visible light images from both cameras can be correlated with each other. We typically detect single molecules at about 10 Hz. (Commercially-available frame rates are 30 or 60 Hz, with 500 Hz also available.) At this frame rate, the IR camera, which is either operating in analog or digital mode, can follow the frame rate of the visible-light fluorescence. Alternatively, at slower rates, one can always integrate the output of the IR-camera.
3. Results
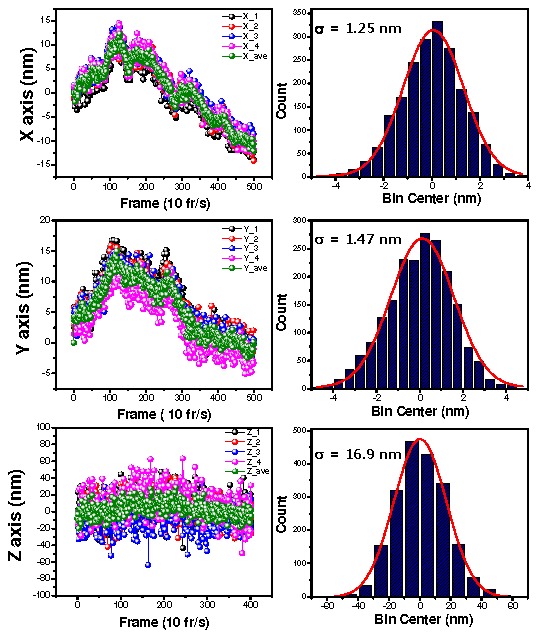
The centers of the fiduciary markers in the IR images can be fit by Gaussian functions within custom made IDL (Exelis, Inc.) code. From this fitting we can track the movement of the stage along the x- and y- axes. To get the z-axis drift, the IR image is slightly defocused as in Fig. 2a to observe the diffraction pattern due to diffraction. The ring diameter of the diffraction pattern is linearly related to how far out-of-focus along the z dimension the stage is [22–24]. Calibration is needed to get the relationship between the ring size and the z-axis distance. In calibration, the size variance of pillars is not a problem because we measure the relative distance of the z-axis. For the calibration, we measured the ring size with incremental stage adjustments of 10 nm along the z-axis using a piezo stage (Fig. 2b). (We also used 50 nm or 100 nm.) As shown in Fig. 3 , the traces of four fiduciary markers are averaged together, and then used to correct the stage drift. The precisions of the averaged traces for each axis are 1.25 nm, 1.47 nm and 16.9 nm for x-, y-, and z-axes, respectively, for a sample immersed in water. For a dry sample, (containing just the fiduciary markers), it is 0.3 nm, 0.4 nm, and 4.6 nm, for the x-, y-, and z-axes as expected because of difference of refractive index. Diffraction pattern of pillars in air(refractive index of air is 1.00) should be clearer than in water (refractive index of water is 1.33).
Fig. 2.

(a) IR scattering image for fiduciary markers at different position along the z axis. (Down and up means below and above focal point) Pillars place every 16 μm. (b) Plots for calibration the relation between z-axis distance and ring size of the diffraction pattern.
Fig. 3.

Traces and histograms along x (top), y (middle) and z (bottom) for fiduciary markers. In traces (left panel), green traces are the averaged for traces of four fiduciary markers which are taken for 1 minute. The histograms were taken from the difference between the averaged as compare with each trace. The standard deviations of these histogram are 1.25 nm, 1.47 nm and 16.9 nm for x, y and z, respectively.
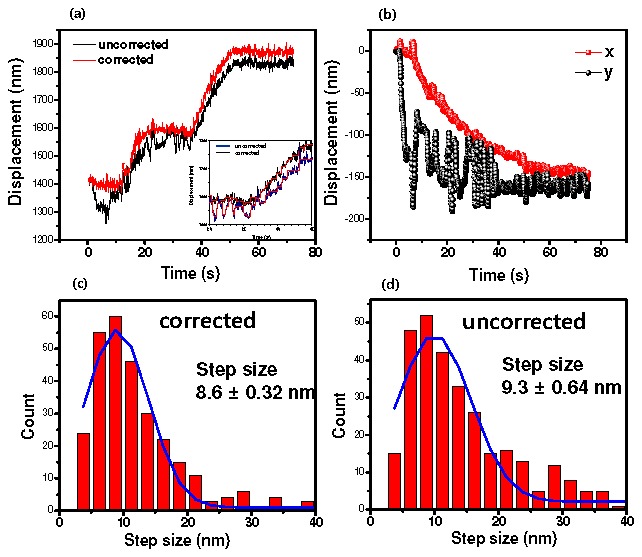
We applied this drift correction method to tracking of kinesin using FIONA [25] (Fig. 4 ). We acquired visible images for the fiduciary markers and for kinesin labeled on the C-terminus (the center-of-mass) with 655 nm quantum dots [26]. Figure 4 shows that the stage gradually drifted 150 nm during 75 sec along the x-axis, and it showed 100 nm fluctuations along the y-axis. This is about 2 nm/sec. The uncorrected trace of kinesin reflected such movement of the stage as shown in Fig. 4, yielding 9.3 ± 0.64 nm for the kinesin steps. The corrected traces (subtracting off the movement of the fiduciary marker) shows that the step size is 8.6 ± 0.32 nm (mean ± s.e.m.). This corrected value is in good agreement with previous methods based on optical trapping and FIONA corrected for stage drift with random fiduciary markers [25,27]. In addition, as shown in Fig. 4c-4d, the uncertainty associated with the measured step size using the uncorrected traces is larger than that of the drift-corrected step size. This is evidently because of some large drift in the uncorrected steps (Fig. 4d), which are successfully eliminated by subtracting them off with fiduciary markers (Fig. 4c).
Fig. 4.

(a) Traces of kinesin walking. Inset is the zoom in trace. Red line of inset represents the fitting line. (b) traces of the stage drift which is the averaged traces for four fiduciary markers. In case of the uncorrected kinesin trace, it reflects the fluctuation of stage traces. (c) and (d) are histograms for the kinesin step sizes of the corrected and the uncorrected, respectively.
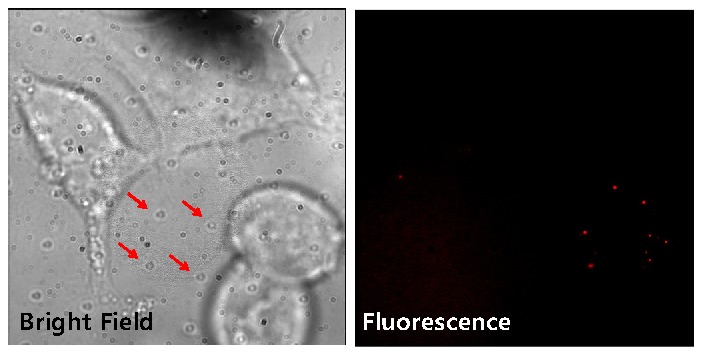
We also examined the biocompatibility of cells with coverslip containing the fiduciary markers (Fig. 5 ) even though there is a report about the biocompatibility of polyurethane [28]. HEK cells were cultured on a fiduciary-marked coverslip, using fibronectin to fix the cells in place. We tested viability of cells through the dye exclusion test using trypan blue and it showed the number of live cells on the fiduciary marked coverslip was comparable to that of normal coverslips. The cells expressed a biotinylated AMPA receptor, which was then labeled with a quantum dot emitting at 605 nm (Invitrogen, Inc.) [29,30]. The bright-field field image (Fig. 5, left), shows the fiduciary markers. The fluorescence image (Fig. 5, right) clearly shows the q-dot emission with no background autofluorescence coming from the fiduciary markers. Thus, we think this technique is useful for in vivo studies since these studies generally are performed over long-time periods and the fiduciary markers do not have any adverse effect on cells and are very stable over time.
Fig. 5.

Bright field (left) and fluorescence (right) images of the HEK cells cultured on the fiduciary-marked coverslip with quantum dots (605 nm emission; Invitrogen) labeling. In the bright-field image, there are cultured cells as well as regular patterned dots (represented by arrows) which are the fiduciary markers. The fluorescence image has no autofluorescence, showing clear emission spots of the qdots.
Finally, we have also tested the fiduciary markers using 2-photon excitation. We used a Tai-Sapphire laser (Mai Tai, Spectra-Physics) to excite upconversion nano-particles [31], with 980 nm light, focused by an oil (or water) objective. The nano-particles were immobilized using poly-lysine, and emitted at 640 nm. We used a 690 nm LED (ELJ-690-629, Roithner LaserTechnik) for fiduciary markers, so as to not interfere with excitation (or emission) light. Over the course of 6 minutes, the immobilized particles drifted 400 nm, the same as the fiduciary markers. Hence this method is applicable for the 2-photon microscopy.
4. Conclusion
In summary, we developed a simple method of correcting stage drifts for super-resolution and super- accuracy studies with only minimal and inexpensive additions. Using soft lithography, fiduciary markers were made on the coverslip and then tracked using IR light scattering; the image was then fit using Gaussian and Airy functions. The average traces of four fiduciary markers showed a precision of 1.25 nm and 1.47 nm along the x- and y-axes, respectively, and 16.9 nm along the z-axis for wet samples and 4.6 nm for dry samples. We applied this method in a walking assay with kinesin, which showed excellent agreement with the step size shown previously, while the uncorrected value showed a slightly larger value. In addition, the fiduciary markers are biocompatible in vitro, in vivo, and for 1- and 2-photon excitation. There is a potential compatibility of this scheme with microscopes that have built-in NIR sources and sensors for focus drift correction.
Acknowledgments
This work was funded in part by NIH ( GM068625) and NSF ( DBI- 02-15869, EAGER 0968976, and 082265).
References and links
- 1.Toprak E., Selvin P. R., “New fluorescent tools for watching nanometer-scale conformational changes of single molecules,” Annu. Rev. Biophys. Biomol. Struct. 36(1), 349–369 (2007). 10.1146/annurev.biophys.36.040306.132700 [DOI] [PubMed] [Google Scholar]
- 2.Huang B., Bates M., Zhuang X. W., “Super-Resolution Fluorescence Microscopy,” Annu. Rev. Biochem. 78(1), 993–1016 (2009). 10.1146/annurev.biochem.77.061906.092014 [DOI] [PMC free article] [PubMed] [Google Scholar]
- 3.Gordon M. P., Ha T., Selvin P. R., “Single-molecule high-resolution imaging with photobleaching,” Proc. Natl. Acad. Sci. U.S.A. 101(17), 6462–6465 (2004). 10.1073/pnas.0401638101 [DOI] [PMC free article] [PubMed] [Google Scholar]
- 4.Thompson R. E., Larson D. R., Webb W. W., “Precise Nanometer Localization Analysis for Individual Fluorescent Probes,” Biophys. J. 82(5), 2775–2783 (2002). 10.1016/S0006-3495(02)75618-X [DOI] [PMC free article] [PubMed] [Google Scholar]
- 5.Qu X. H., Wu D., Mets L., Scherer N. F., “Nanometer-localized multiple single-molecule fluorescence microscopy,” Proc. Natl. Acad. Sci. U.S.A. 101(31), 11298–11303 (2004). 10.1073/pnas.0402155101 [DOI] [PMC free article] [PubMed] [Google Scholar]
- 6.Lacoste T. D., Michalet X., Pinaud F., Chemla D. S., Alivisatos A. P., Weiss S., “Ultrahigh-resolution multicolor colocalization of single fluorescent probes,” Proc. Natl. Acad. Sci. U.S.A. 97(17), 9461–9466 (2000). 10.1073/pnas.170286097 [DOI] [PMC free article] [PubMed] [Google Scholar]
- 7.Churchman L. S., Okten Z., Rock R. S., Dawson J. F., Spudich J. A., “Single molecule high-resolution colocalization of Cy3 and Cy5 attached to macromolecules measures intramolecular distances through time,” Proc. Natl. Acad. Sci. U.S.A. 102(5), 1419–1423 (2005). 10.1073/pnas.0409487102 [DOI] [PMC free article] [PubMed] [Google Scholar]
- 8.Betzig E., Patterson G. H., Sougrat R., Lindwasser O. W., Olenych S., Bonifacino J. S., Davidson M. W., Lippincott-Schwartz J., Hess H. F., “Imaging intracellular fluorescent proteins at nanometer resolution,” Science 313(5793), 1642–1645 (2006). 10.1126/science.1127344 [DOI] [PubMed] [Google Scholar]
- 9.Carter A. R., King G. M., Ulrich T. A., Halsey W., Alchenberger D., Perkins T. T., “Stabilization of an optical microscope to 0.1 nm in three dimensions,” Appl. Opt. 46(3), 421–427 (2007). 10.1364/AO.46.000421 [DOI] [PubMed] [Google Scholar]
- 10.Hess S. T., Girirajan T. P. K., Mason M. D., “Ultra-high resolution imaging by fluorescence photoactivation localization microscopy,” Biophys. J. 91(11), 4258–4272 (2006). 10.1529/biophysj.106.091116 [DOI] [PMC free article] [PubMed] [Google Scholar]
- 11.Simonson P. D., Rothenberg E., Selvin P. R., “Single-Molecule-Based Super-Resolution Images in the Presence of Multiple Fluorophores,” Nano Lett. 11(11), 5090–5096 (2011). 10.1021/nl203560r [DOI] [PMC free article] [PubMed] [Google Scholar]
- 12.Burnette D. T., Sengupta P., Dai Y. H., Lippincott-Schwartz J., Kachar B., “Bleaching/blinking assisted localization microscopy for superresolution imaging using standard fluorescent molecules,” Proc. Natl. Acad. Sci. U.S.A. 108(52), 21081–21086 (2011). 10.1073/pnas.1117430109 [DOI] [PMC free article] [PubMed] [Google Scholar]
- 13.Hell S. W., “Far-field optical nanoscopy,” Science 316(5828), 1153–1158 (2007). 10.1126/science.1137395 [DOI] [PubMed] [Google Scholar]
- 14.Gustafsson M. G. L., “Nonlinear structured-illumination microscopy: Wide-field fluorescence imaging with theoretically unlimited resolution,” Proc. Natl. Acad. Sci. U.S.A. 102(37), 13081–13086 (2005). 10.1073/pnas.0406877102 [DOI] [PMC free article] [PubMed] [Google Scholar]
- 15.Wade A. R., Fitzke F. W., “A fast, robust pattern recognition system for low light level image registration and its application to retinal imaging,” Opt. Express 3(5), 190–197 (1998). 10.1364/OE.3.000190 [DOI] [PubMed] [Google Scholar]
- 16.Guizar-Sicairos M., Thurman S. T., Fienup J. R., “Efficient subpixel image registration algorithms,” Opt. Lett. 33(2), 156–158 (2008). 10.1364/OL.33.000156 [DOI] [PubMed] [Google Scholar]
- 17.Rust M. J., Bates M., Zhuang X. W., “Sub-diffraction-limit imaging by stochastic optical reconstruction microscopy (STORM),” Nat. Methods 3(10), 793–796 (2006). 10.1038/nmeth929 [DOI] [PMC free article] [PubMed] [Google Scholar]
- 18.Henriques R., Lelek M., Fornasiero E. F., Valtorta F., Zimmer C., Mhlanga M. M., “QuickPALM: 3D real-time photoactivation nanoscopy image processing in ImageJ,” Nat. Methods 7(5), 339–340 (2010). 10.1038/nmeth0510-339 [DOI] [PubMed] [Google Scholar]
- 19.Nugent-Glandorf L., Perkins T. T., “Measuring 0.1-nm motion in 1 ms in an optical microscope with differential back-focal-plane detection,” Opt. Lett. 29(22), 2611–2613 (2004). 10.1364/OL.29.002611 [DOI] [PubMed] [Google Scholar]
- 20.Mlodzianoski M. J., Schreiner J. M., Callahan S. P., Smolková K., Dlasková A., Santorová J., Ježek P., Bewersdorf J., “Sample drift correction in 3D fluorescence photoactivation localization microscopy,” Opt. Express 19(16), 15009–15019 (2011). 10.1364/OE.19.015009 [DOI] [PubMed] [Google Scholar]
- 21.Qin D., Xia Y. N., Whitesides G. M., “Soft lithography for micro- and nanoscale patterning,” Nat. Protoc. 5(3), 491–502 (2010). 10.1038/nprot.2009.234 [DOI] [PubMed] [Google Scholar]
- 22.Speidel M., Jonás A., Florin E. L., “Three-dimensional tracking of fluorescent nanoparticles with subnanometer precision by use of off-focus imaging,” Opt. Lett. 28(2), 69–71 (2003). 10.1364/OL.28.000069 [DOI] [PubMed] [Google Scholar]
- 23.Toprak E., Balci H., Blehm B. H., Selvin P. R., “Three-dimensional particle tracking via bifocal imaging,” Nano Lett. 7(7), 2043–2045 (2007). 10.1021/nl0709120 [DOI] [PubMed] [Google Scholar]
- 24.Gibson S. F., Lanni F., “Diffraction by a Circular Aperture as a model for three-dimensional optical microscopy,” J. Opt. Soc. Am. A 6(9), 1357–1367 (1989). 10.1364/JOSAA.6.001357 [DOI] [PubMed] [Google Scholar]
- 25.Yildiz A., Tomishige M., Vale R. D., Selvin P. R., “Kinesin walks hand-over-hand,” Science 303(5658), 676–678 (2004). 10.1126/science.1093753 [DOI] [PubMed] [Google Scholar]
- 26.Toprak E., Yildiz A., Hoffman M. T., Rosenfeld S. S., Selvin P. R., “Why kinesin is so processive,” Proc. Natl. Acad. Sci. U.S.A. 106(31), 12717–12722 (2009). 10.1073/pnas.0808396106 [DOI] [PMC free article] [PubMed] [Google Scholar]
- 27.Block S. M., Goldstein L. S. B., Schnapp B. J., “Bead Movement by Single Kinesin Molecules Studied with Optical Tweezers,” Nature 348(6299), 348–352 (1990). 10.1038/348348a0 [DOI] [PubMed] [Google Scholar]
- 28.Zia K. M., Zuber M., Bhatti I. A., Barikani M., Sheikh M. A., “Evaluation of biocompatibility and mechanical behavior of polyurethane elastomers based on chitin/1,4-butane diol blends,” Int. J. Biol. Macromol. 44(1), 18–22 (2009). 10.1016/j.ijbiomac.2008.09.011 [DOI] [PubMed] [Google Scholar]
- 29.Howarth M., Takao K., Hayashi Y., Ting A. Y., “Targeting quantum dots to surface proteins in living cells with biotin ligase,” Proc. Natl. Acad. Sci. U.S.A. 102(21), 7583–7588 (2005). 10.1073/pnas.0503125102 [DOI] [PMC free article] [PubMed] [Google Scholar]
- 30.Howarth M., Liu W. H., Puthenveetil S., Zheng Y., Marshall L. F., Schmidt M. M., Wittrup K. D., Bawendi M. G., Ting A. Y., “Monovalent, reduced-size quantum dots for imaging receptors on living cells,” Nat. Methods 5(5), 397–399 (2008). 10.1038/nmeth.1206 [DOI] [PMC free article] [PubMed] [Google Scholar]
- 31.Wang F., Banerjee D., Liu Y. S., Chen X. Y., Liu X. G., “Upconversion nanoparticles in biological labeling, imaging, and therapy,” Analyst (Lond.) 135(8), 1839–1854 (2010). 10.1039/c0an00144a [DOI] [PubMed] [Google Scholar]


