

Abstract
Understanding the genetic underpinnings of adaptive change is a fundamental but largely unresolved problem in evolutionary biology. Drosophila melanogaster, an ancestrally tropical insect that has spread to temperate regions and become cosmopolitan, offers a powerful opportunity for identifying the molecular polymorphisms underlying clinal adaptation. Here, we use genome-wide next-generation sequencing of DNA pools ('pool-seq') from three populations collected along the North American east coast to examine patterns of latitudinal differentiation. Comparing the genomes of these populations is particularly interesting since they exhibit clinal variation in a number of important life history traits. We find extensive latitudinal differentiation, with many of the most strongly differentiated genes involved in major functional pathways such as the insulin/TOR, ecdysone, torso, EGFR, TGFβ/BMP, JAK/STAT, immunity and circadian rhythm pathways. We observe particularly strong differentiation on chromosome 3R, especially within the cosmopolitan inversion In(3R)Payne, which contains a large number of clinally varying genes. While much of the differentiation might be driven by clinal differences in the frequency of In(3R)P, we also identify genes that are likely independent of this inversion. Our results provide genome-wide evidence consistent with pervasive spatially variable selection acting on numerous loci and pathways along the well-known North American cline, with many candidates implicated in life history regulation and exhibiting parallel differentiation along the previously investigated Australian cline.
Keywords: adaptation, cline, Drosophila melanogaster, latitudinal variation, pool-seq, single nucleotide polymorphism
Introduction
Unravelling the genetic basis of adaptive change in natural populations is one of the most fundamental aims of evolutionary biology (Dobzhansky 1970; Lewontin 1974; Nielsen 2005; Stinchcombe & Hoekstra 2007; Stapley et al. 2010; Barrett & Hoekstra 2011; Rockman 2012). For example, many species that occupy heterogeneous environments across their distributional range are subject to spatially varying selection that may cause genetic differentiation and local adaptation despite gene flow and genetic drift (Levene 1953; Karlin & McGregor 1972a,b; Felsenstein 1976; Endler 1977; Slatkin 1978; Barton 1983; Hedrick 2006). Consequently, much work has focused on identifying polymorphisms that underlie adaptation to spatial heterogeneity and their consequences for quantitative variation (Lewontin & Krakauer 1973; Latta 1998; Le Corre & Kremer 2003; Beaumont & Balding 2004; Hedrick 2006; Whitlock 2008; Nosil et al. 2009; Ma et al. 2010).
One common approach for identifying polymorphisms that might be targets of spatially variable selection is to search for alleles that show exceptionally strong differentiation among geographically distinct populations: strong outlier 'signals' are taken to be indicative of selection and local adaptation relative to background 'noise' caused by gene flow and drift (Lewontin & Krakauer 1973, 1975; Black et al. 2001; Luikart et al. 2003; Beaumont 2005; Akey 2009; Akey et al. 2010). While this method has been criticized (see discussion in Beaumont 2005), for instance because large genetic differentiation can also be due to demographic factors independent of selection, it has generally proved to be quite robust against effects of demography and thus relatively successful at identifying putatively adaptive loci (Schlötterer 2002; Beaumont & Balding 2004; Beaumont 2005; Stinchcombe & Hoekstra 2007; Nosil et al. 2009; Kolaczkowski et al. 2011). The outlier method might be especially powerful when applied to situations for which there exists evidence of genetic, phenotypic and ecological adaptation caused by spatially variable selection. Clines, that is, changes in phenotypes and/or allele frequencies along a continuous environmental gradient, offer a particularly promising opportunity in this respect. Because clines are often highly repeatable across different geographical regions, populations and species, both at the level of phenotypic and genetic change, they are widely thought to reflect spatially varying selection (Mayr 1963; Dobzhansky 1970; Endler 1977; Barton 1983, 1999).
The probably most comprehensively studied cases of clinal variation maintained by spatially variable selection are the latitudinal clines observed in the fruit fly, Drosophila melanogaster (David & Bocquet 1975; Singh & Rhomberg 1987; Hale & Singh 1991; Hoffmann & Weeks 2007). Drosophila melanogaster is an ancestrally tropical species from sub-Saharan Africa that has colonized North America and Australia over the last few 100 years (David & Capy 1988; Lachaise & Silvain 2004), and the establishment of derived populations in temperate regions is thought to have resulted in a number of climatic adaptations (Bouletreau-Merle et al. 2003; Hoffmann et al. 2003; Sezgin et al. 2004; Schmidt et al. 2005a,b; Hoffmann & Weeks 2007; Paaby & Schmidt 2009). At the phenotypic level, clinal variation has been documented for a number of major life history traits, including developmental time, body size, ovariole number, fecundity, stress resistance, lifespan, reproductive dormancy and overwintering ability (David & Bocquet 1975; Coyne & Beecham 1987; James & Partridge 1995; Mitrovski & Hoffmann 2001; Hoffmann et al. 2002; De Jong & Bochdanovits 2003; Schmidt et al. 2005a,b,2008; Kennington et al. 2007; Schmidt & Paaby 2008). Similarly, at the genetic level, latitudinal clines have been identified for numerous allozyme, DNA and chromosome inversion polymorphisms in both North American and Australian populations (Mettler et al. 1977; Knibb 1982; Oakeshott et al. 1982; Schmidt et al. 2000, 2008; Gockel et al. 2001; De Jong & Bochdanovits 2003; Sezgin et al. 2004; Anderson et al. 2005; Hoffmann & Weeks 2007; Turner et al. 2008; Kolaczkowski et al. 2011; Paaby et al. 2010).
Since many genetic and phenotypic clinal patterns are observed in a parallel fashion on different continents, latitudinal variation is likely to be driven by spatially variable selection, not by demography (Knibb 1982; Singh & Rhomberg 1987; De Jong & Bochdanovits 2003; Turner et al. 2008). The notion that clinal variation is mainly due to selection is also consistent with the observation that putatively neutral markers are typically not well correlated with latitude (Hale & Singh 1991; Gockel et al. 2002; Kennington et al. 2003). However, despite the impressive body of work on clinal variation in D. melanogaster and other species, our understanding of the genetic—and in particular the genomic—basis of latitudinal differentiation and adaptation remains incomplete.
Significant progress in uncovering the genetic factors underlying latitudinal differentiation in D. melanogaster has recently been made by two studies that characterized clines on a genomic scale (Turner et al. 2008; Kolaczkowski et al. 2011). Turner et al. (2008) used tiling arrays with approximately three million markers to characterize differentiation between northern and southern populations of D. melanogaster from the east coast of North America and Australia. The authors identified many interesting genomic regions underlying latitudinal differentiation, including several showing parallel differentiation between the North American and Australian clines. However, the resolution of this study was limited, with one 25-bp array probe for approximately every 40 bp of the genome. More recently, the Australian cline was re-examined with much higher resolution using next-generation sequencing technology by Kolaczkowski et al. (2011). By comparing two northern and two southern populations, the authors identified major patterns of clinal differentiation, with strong evidence for selection acting on a number of key biological functions and pathways. However, only the endpoints of the cline were compared, and sequencing coverage was relatively low (8–12 fold).
Here, we aim to complement and extend these recent efforts by characterizing, for the first time, genome–sequence-based patterns of latitudinal differentiation along the well-known North American cline (Oakeshott et al. 1982; Coyne & Beecham 1987; Singh & Rhomberg 1987; Hale & Singh 1991; Berry & Kreitman 1993; Schmidt et al. 2008; Paaby et al. 2010). We apply whole-genome next-generation sequencing, with relatively high sequencing coverage (~45-fold), to DNA pools ('pool-seq') from a northern (Maine), an intermediate (Pennsylvania) and a southern (Florida) population. Describing patterns of genomic differentiation among these populations is particularly interesting since they differ in major life history traits (Schmidt et al. 2005a,b; Schmidt & Paaby 2008). Our first objective is thus to generate a comprehensive catalogue of candidate genes and pathways that might underlie life history phenotypes known to vary along the North American cline. Our second goal is to examine the contribution of the major chromosomal inversion In(3R)Payne to clinal variation and to identify polymorphisms likely independent of it. Finally, by comparing our results to those of Kolaczkowski et al. (2011), we investigate parallel clinal variation between the North American and Australian clines—finding evidence for parallel genetic differentiation between two independent clines would considerably strengthen the case for spatially varying selection acting at specific loci.
Materials and methods
Population samples
We analysed three populations from the United States east coast, collected between 2009 and 2010 by P. Schmidt in fruit orchards using aspiration/netting on fallen fruit: (i) a southern population from Florida (F; Fruit and Spice Park, Homestead, FL; 25°32′N, 80°29′W; n = 39 isofemale lines; 07/2010); (ii) an intermediate population from Pennsylvania (P; Linvilla Orchards, Media, PA; 39°53′N, 75°24′W; n = 102 isofemale lines; 07/2009); and (iii) a northern population from Maine (M; Rocky Ridge Orchard, Bowdoin, ME; 44°1′N, 69°56′W; n = 86 isofemale lines; 10/2009) (Fig.). Populations from southern Florida and mid-coastal Maine approximate the southern and northern limits of D. melanogaster along the eastern US cline, whereas populations from the mid-Atlantic region (Pennsylvania) are intermediate with regard to climate and life history phenotypes, including the incidence of reproductive dormancy (Schmidt & Paaby 2008).
Fig 1.
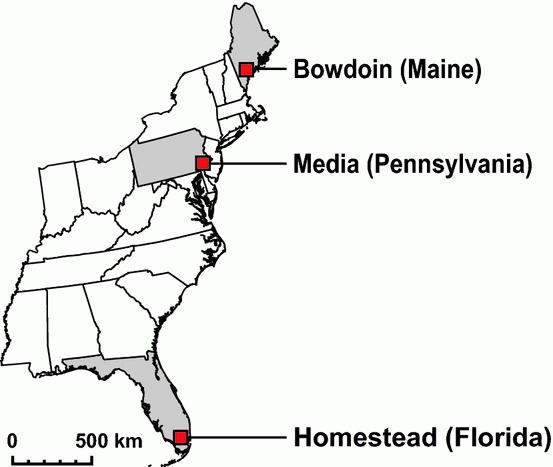
Sampling locations. Three populations were sampled along the United States east coast for genome-wide 'pool-seq': the population from Florida (F) approximates the southern range limit of Drosophila melanogaster; the population from the mid-Atlantic region (Pennsylvania, P) is intermediate in terms of climate and the population from Maine (M) approximates the northern range limit. See text for further details.
Sequencing, mapping and data processing
We used 'pool-seq' to estimate allele frequencies and identify candidate single nucleotide polymorphisms (SNPs) (Futschik & Schlötterer 2010). For each population, we prepared one pooled sample in a single tube, using one female per line (pool sizes: Florida, n = 39 females; Pennsylvania, n = 102 females; Maine, n = 86 females), adjusted the ratio of homogenization buffer to the number of flies in a given pool and homogenized pools with an Ultra-Turrax T10 (IKA-Werke, Staufen, Germany). Genomic DNA was extracted using the Qiagen DNeasy Blood and Tissue Kit (Qiagen, Hilden, Germany). We fragmented genomic DNA using a Covaris S2 device (Covaris, Inc. Woburn, MA, USA) and prepared paired-end genomic libraries (using 5 μg of genomic DNA for each pool and library) with NEBNext DNA Sample Prep modules (New England Biolabs, Ipswich, MA, USA) following the manufacturer's instructions. Cluster amplification was performed using the TruSeq PE Cluster Kit v5 on a cluster station, and each sample was sequenced on one lane of a Genome Analyzer IIx using TruSeq SBS 36 Cycle Kits v5 (Illumina, San Diego, CA, USA). 101 bp paired-end reads were filtered for a minimum average base quality score of 18 and trimmed using PoPoolation (Kofler et al. 2011a); only reads with a minimum length > 50 bp after trimming were used for mapping. Trimmed reads were mapped against the FlyBase D. melanogaster reference genome r5.40 (http://flybase.org; Adams et al. 2000) with the Burrows-Wheeler alignment tool bwa v0.5.8c (Li & Durbin 2009), using the following parameters: -l 150, -n 0.01, -e 12, -d 12 and -o 2. Paired-end data were merged to single files in sam format with the 'sampe' option of bwa. Files were converted to BAM format with SAMtools v0.1.9 (Li et al. 2009) and filtered for a minimum mapping quality of 20. BAM files were transformed to pileup files using SAMtools; indels and simple sequence repeats were masked using PoPoolation and RepeatMasker (http://www.repeatmasker.org). RepeatMasker was run using default sensitivity parameters including the search for simple repeats but without searching for bacterial insertion elements (option: -no_is). Mean coverage was highly consistent and uniform among populations and chromosomal arms (Fig. S1, Supporting information); mean sequencing quality (Phred score) was 37 for Maine and 38 for both Florida and Pennsylvania (details not shown). Raw sequencing data prior to trimming and mapping are available as FASTQ files at the Sequence Read Archive (SRA) of the European Nucleotide Archive (ENA) hosted by EMBL-EBI under accession ERP001535 (http://www.ebi.ac.uk/ena/data/view/ERP001535). A detailed description of our bioinformatic analysis pipeline can be found in Appendix S13 (Supporting information).
To identify candidate genes, we used an individual SNP-based rather than a window-based approach, except where indicated otherwise; the latter averages across many sites within a given window and might fail to detect strongly differentiated individual SNPs. The window-based approach could thus possibly be biased towards finding significant differentiation in windows with relatively high linkage disequilibrium (LD). The SNP-based approach, however, might be more strongly affected by base-to-base variation in coverage and sequencing errors. Moreover, it assumes that SNPs are independent. While this assumption might be somewhat unrealistic, natural populations of D. melanogaster are known to exhibit low levels of LD, with most high-level LD occurring on a scale of < 200 bp (Miyashita & Langley 1988; Langley et al. 2000; Mackay et al. 2012).
We implemented a number of stringent criteria to define alleles for analysis. We excluded all sites with a coverage < 10, since such sites are likely associated with little statistical power to identify differentiation, as well those falling within the top 2% of maximum coverage (i.e. excluding positions with > 77 reads for Florida, > 70 for Pennsylvania and > 81 for Maine), because such sites might represent copy number variants rather than true SNPs. To minimize the impact of sequencing errors and maximize the probability of calling true SNPs, we pooled counts across all populations for each position and only considered those with a minimum allele count ≥ 6 (i.e. a minimum count of two per population on average) as polymorphic; we thus assume that alleles present at high number in at least one population or occurring at low number in multiple populations represent correctly called SNPs. For most analyses, we excluded gene-poor telomeric and centromeric regions with low or no recombination since such regions are expected to yield little insight into patterns of genic differentiation; we therefore focused on the following normally recombining regions of the genome: X, 1,036,552-20,902,578; 2L, 844,225-19,946,732; 2R, 6,063,980-20,322,335; 3L, 447,386-18,392,988; 3R, 7,940,899-27,237,549 (Kolaczkowski et al. 2011).
Estimation of population genetic parameters
To characterize genome-wide patterns of variation and differentiation, we estimated four standard population genetic parameters, π, Watterson's θ, Tajima's D and FST (Charlesworth & Charlesworth 2010). We used PoPoolation (Kofler et al. 2011a) to estimate π, θW and D and PoPoolation2 (Kofler et al. 2011b) to estimate FST for each pairwise population comparison (FM, FP, PM) and variable site in the genome. To estimate π and θW, we assumed a minimum count of two and used unbiased estimators for pooled data that correct for pool size and coverage (Futschik & Schlötterer 2010; Kofler et al. 2011a). Since D is sensitive to variation in coverage, partially due to sequencing errors, we estimated D by subsampling all reads to a coverage of 25, using a minimum count of one and a minimum quality of 20. Note that since D depends on coverage and window size, our analysis only allows for relative comparisons among our populations, not for direct comparisons with other studies. For graphical representation, we calculated average values for all statistics in nonoverlapping 200-kb windows across the entire genome (i.e. not excluding regions of low recombination). For each population or pairwise comparison, we tested for significant variation in average π, θW and FST among chromosomal arms and among populations/pairs by using two-way anova on rank-transformed means of SNP-wise values. We did not fit the interaction term since anova applied to rank-transformed data is inappropriate for interpreting interactions (Quinn & Keough 2002). To test for significance between levels of each factor, we used Tukey's HSD post hoc test. Since our tests for variation in π and θW among populations were based on ranks of means and only three populations, they were not very powerful. To further probe whether populations might differ in π and θW, we therefore used Kruskal–Wallis rank sum tests on the ranks of π and θW values estimated in nonoverlapping 200-kb windows across the entire genome. Similarly, we tested for variation in D among populations by using a Kruskal–Wallis rank sum test on rank-transformed D values estimated in 200-kb nonoverlapping windows. To identify which population pairs differ from each other in these Kruskal–Wallis analyses we used Wilcoxon rank sum post hoc tests.
Identification of candidate genes
To identify genes likely to be differentiated as a result of either direct selection or indirect selection due to linkage, we used a two-pronged approach. First, to identify the most strongly differentiated alleles, we estimated pairwise FST for each polymorphic SNP and subjected estimates to an empirical outlier approach (Akey et al. 2010; Kolaczkowski et al. 2011). Only SNPs falling into the upper 0.5% tail of the FST distribution were considered to represent truly differentiated alleles at candidate loci, representing 5‰ of all SNPs found in the euchromatic, normally recombining genome. However, while this extreme value approach maximizes 'signal strength', it has two potential drawbacks: standard errors of allele frequency estimates may be highly variable because of variable sequencing coverage and testing the statistical significance of FST values typically requires a biologically realistic null model that can be difficult to define. Second, we therefore subjected allele counts of SNPs in the top 0.5% of the FST distribution to two-sided Fisher's exact tests (FET), thereby conditioning FST outliers on statistical significance. We only considered biallelic SNPs for FET; for multiallelic SNPs, only the two most frequent alleles were used. Since we performed a large number of tests, likely resulting in many false positives, we obtained a false discovery rate (FDR) by calculating adjusted P-values (q-values) (Storey & Tibshirani 2003) for all polymorphic sites using the LBE package in R (Dalmasso et al. 2005). Only SNPs with q < 0.01 were considered to be differentiated for our analysis. Positively identified SNPs were annotated with snpEff v2.0.3 (http://snpeff.sourceforge.net) based on reference genome r5.40 and assigned to candidate genes (±1-kb up- and downstream). While our approach is likely to miss potentially interesting candidates (Teshima et al. 2006), we can be quite confident about positively identified candidates.
To explore whether our set of candidates is robust, we also used an alternative method, similar to the window-based approach employed by Kolaczkowski et al. (2011), but based on genes rather than nonoverlapping 1-kb windows. For each gene (as defined by 5′ and 3′ UTRs plus 1-kb up- and downstream), we estimated average FST across all polymorphic SNPs (i.e. implicitly accounting for LD) and only considered those falling into the upper 5% tail of the distribution to be truly differentiated. Based on this analysis, we calculated the percentage of overlap between SNP- and gene-defined lists of candidate genes for each pairwise comparison (i.e. the overlap of the number of SNP-defined and gene-defined candidate genes divided by the number of gene-defined candidate genes).
We also investigated the size of the genomic regions differentiated between populations. We reasoned that if there is strong differentiation in the vicinity of candidate SNPs, for example due to haplotype structure, we should see a marked increase in the statistical significance of SNPs flanking the candidate SNPs. In contrast, if windows of differentiation around candidates are relatively small, we would expect that significance levels of SNPs flanking candidate SNPs decay rapidly with increasing distance from the candidates. To test this prediction, we calculated median −log10(P)-values for all flanking SNPs (including noncandidate and candidate SNPs) occurring in 100-bp windows around each candidate SNP, covering a region of 100-kb up- and downstream of candidates. To visualize potential short-range effects, we repeated the same analysis by using a higher resolution, that is, using 10-bp windows and covering a region of 500-bp up- and downstream of candidates. Median −log10(P)-values were plotted as a function of the relative distance of flanking to candidate SNPs, with the position of each candidate SNP set to zero. Note that at position zero, the median −log10(P)-value of each candidate SNP was excluded. To generate a null expectation, we estimated P-value levels for a random set of noncandidate SNPs ≥ 500 kb away from candidate SNPs (using the same number of SNPs and from the same chromosomal arm as the candidate SNPs) and repeated the analysis described above.
Genome annotations
To investigate genic differentiation across genome features, we obtained D. melanogaster genome annotations from FlyBase r.5.40 using snpEff v2.0.3. Genome positions were annotated as coding sequence (CDS; synonymous vs. nonsynonymous sites; using a standard eukaryote codon table in snpEff), intron, 3′- and 5′- untranslated region (UTR), 1-kb downstream, 1-kb upstream, intergenic or 'other'. We calculated the proportion of features for (i) all SNPs in the normally recombining genome and (ii) all candidate SNPs. To test for over- or underrepresentation of candidate SNPs with given features, we used χ2 tests (α = 0.01) on SNP counts. For plots showing candidate SNPs for specific candidate genes, we included all SNPs 1 kb up- and downstream of the gene of interest to visualize SNPs located in putative regulatory regions.
Gene ontology analysis
To analyse the biological function of candidates, we used Gene Ontology (GO) analysis (Ashburner et al. 2000). One problem with traditional GO analyses is that long genes have a higher probability of containing false-positive candidate SNPs than short genes containing fewer SNPs. GO categories that on average contain longer genes might thus become spuriously overrepresented. We thus tested for FDR-corrected enrichment of GO terms using Gowinda (http://code.google.com/p/gowinda/; Kofler & Schlötterer 2012), which corrects for gene length bias using a permutation approach. We obtained D. melanogaster GO annotations from FlyBase r.5.40 and used the following parameters in Gowinda: 10 000 000 simulations; minimum significance = 1 and minimum number of genes per GO category = 5 (i.e. excluding GO categories with <5 annotated genes). SNPs within a region of 1-kb up- or downstream of a given gene were mapped as belonging to that gene, and overlapping genes were also considered.
Inversion analysis
Since the major cosmopolitan inversions are thought to explain a substantial proportion of clinal variation (Krimbas & Powell 1992; De Jong & Bochdanovits 2003; Rako et al. 2006; Hoffmann & Weeks 2007), we examined their contribution to differentiation. To investigate differentiation in- and outside inversions, we determined approximate genomic positions of breakpoints for the four major cosmopolitan inversions, In(2L)t, In(2R)NS, In(3L)P and In(3R)P, based on their cytological breakpoints (Ashburner & Lemeunier 1976). To define inversion boundaries, we chose the most proximal breakpoint at the 5′ end and the most distal at the 3′ end. Cytological locations were converted to nucleotide positions using information obtained from FlyBase (http://flybase.org/static_pages/downloads/FB2011_09/map_conversion/genome-cyto-seq.txt).
For each population and inversion, we first tested whether the proportion of candidate SNPs differs between the inversion and the rest of the chromosomal arm using FET. Similarly, for each pairwise comparison and inversion, we used Wilcoxon rank sum tests to test for differences between the average FST-value of a given inversion and that of the rest of the arm. In addition, we estimated among-population differences in the frequency of In(3R)P by examining four previously published markers: an 8-bp indel marker in hsr-omega (Anderson et al. 2003) and three SNP markers in tolkin (C245T, T249C, T1444C; see Matzkin et al. 2005). To investigate SNP markers, we extracted allele frequencies from pileup files; to examine the indel marker, we visually inspected SAM alignment files using Integrative Genomics Viewer (IGV) (Robinson et al. 2011).
Clinal analysis of allele frequencies
Since clinal changes in allele frequencies might reflect spatially varying selection, we analysed how frequencies of candidate SNPs change across latitude. We calculated SNP-wise allele frequencies for each population from the synchronized pileup file, conditioning for the allele that rises in frequency from South to North. For each pairwise comparison, we estimated the slopes (s) of frequency change across latitude between Florida (F) and Pennsylvania (P) (s1) and between Pennsylvania (P) and Maine (M) (s2) for each candidate SNP. We then subdivided each of these three sets (FP, FM, PM) into three subsets based on the sign of the two slopes (i.e. s1,2 = ++, +−, or −+; giving nine sets in total). Only candidate SNPs in the three ++ subsets (i.e. one ++ set for FP, FM and PM) represent alleles whose frequencies increase consistently with latitude; we therefore combined these ++ subsets to obtain a core set containing all candidate SNPs whose frequencies change clinally across populations ('plus_plus' candidates). To characterize this core set, we performed GO analysis and plotted the frequency changes of candidate SNPs for these core clinal candidate genes against latitude.
One problem with reliably estimating allele frequencies from pooled DNA data is sufficient sequence coverage; since the binomial standard error scales with sample size, low coverage might result in estimates with large standard errors or wide confidence limits. We therefore refined the core set by estimating 95% binomial confidence limits for allele frequency estimates for each SNP showing a clinal (++) pattern, using the F distribution: SNPs whose confidence limits do not overlap among populations exhibit significant clinal allele frequency change across latitude. In the clinal frequency plots for candidate genes, we show trajectories of these SNPs in red, against the background of all SNPs from the clinal core set shown in black.
Results and discussion
Genome-wide variation and differentiation
We first characterized large-scale patterns of variation and differentiation. To examine sequence variability, we used two estimates of nucleotide diversity, π and θW. Estimates of π and θW, when averaged over chromosomal arms, were overall higher in Florida (π = 0.0061; θW = 0.0063) than in Pennsylvania and Maine (average values were identical for both populations: π = 0.0056; θW = 0.0058) (Tables S1–S2, Supporting information). We detected significant differences for both π and θW among chromosomal arms, averaged over populations, with the rank order being 2L > 2R = 3L > 3R > X (Tables S1–S2, Supporting information). Our results for π are in good agreement with those for the Australian cline, with higher nucleotide diversity at lower latitude and the least amount of diversity on the X (Kolaczkowski et al. 2011). The lower diversity in Pennsylvania and Maine as compared to Florida could, for example, be due to a lower effective population size in northern populations, possibly due to contractions of population size in winter.
When estimating π and θW as a function of genomic position using 200-kb nonoverlapping windows, both estimators were low near centromeres (Fig.; Begun 1992; Kolaczkowski et al. 2011; Kofler et al. 2011a; Mackay et al. 2012). Florida showed long genomic stretches with higher variability than Pennsylvania and Maine, particularly on 2L, 3L and 3R, whereas π and θW were lower and similar along the whole genome for Pennsylvania and Maine (Fig. 2; Fig. S2, Supporting information). Increasing base quality to a threshold of 30 and subsampling sequence reads to a uniform genome-wide coverage of 25 did not qualitatively change patterns of π and θW among populations (results not shown). θW remained overall higher in Florida than in Pennsylvania and Maine (not shown), suggesting that our analysis was not strongly influenced by variation in coverage or sequencing errors.
Fig 2.
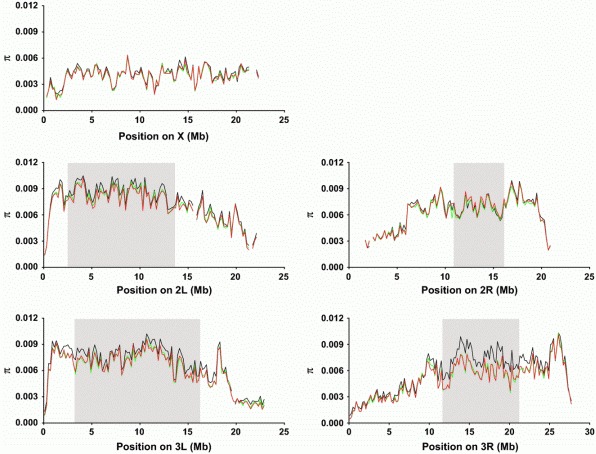
Average nucleotide diversity π. Average π across chromosomal arms, estimated over 200-kb nonoverlapping windows, shown separately for each population. Florida, black line; Pennsylvania, green line; Maine, red line. Regions with a broken line represent windows where coverage was outside the predefined minimum/maximum coverage interval, that is, windows with <60% of SNPs fulfilling the coverage criteria. Grey boxes indicate approximate regions spanned by the cosmopolitan inversions on the left and right arms of chromosome 2 (In(2L)t; In(2R)NS) and chromosome 3 (In(3L)P; In(3R)P).
To examine deviations from neutrality, we calculated Tajima's D across the whole genome. For all three populations, D was negative, deviating from neutrality (D = 0). Average D differed significantly among all populations (Kruskal–Wallis rank sum test, χ2 = 554, d.f. = 2, P < 0.001; followed by pairwise Wilcoxon rank sum post hoc tests, details not shown); D was most negative for Florida, intermediate for Maine and least negative for Pennsylvania (Fig.). A consistently negative D suggests an excess of rare variants, which is consistent with positive or purifying selection and/or population expansion. The pronounced excess of rare alleles in Florida might also be due to admixture from African populations, for example, via the Caribbean (Caracristi & Schlötterer 2003; Yukilevich et al. 2010); a higher frequency of rare variants in Florida has previously been reported, for instance, for several clinally varying metabolic loci (Sezgin et al. 2004).
Fig 3.
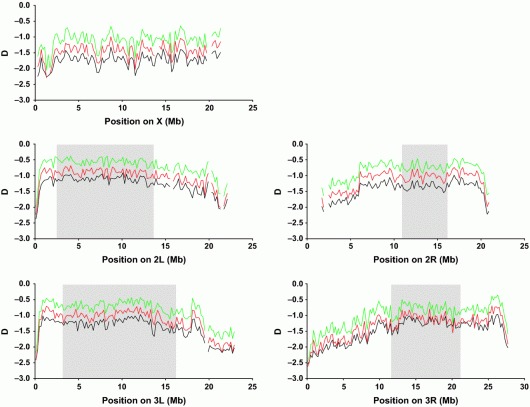
Average Tajima's D. Average Tajima's D across chromosomal arms, estimated over 200-kb nonoverlapping windows, shown separately for each population. Florida, black line; Pennsylvania, green line; Maine, red line. Regions with a broken line represent windows where coverage was outside the predefined minimum/maximum coverage interval, that is, windows with <60% of SNPs fulfilling the coverage criteria. Grey boxes indicate approximate regions spanned by the cosmopolitan inversions on the left and right arms of chromosome 2 (In(2L)t; In(2R)NS) and chromosome 3 (In(3L)P; In(3R)P).
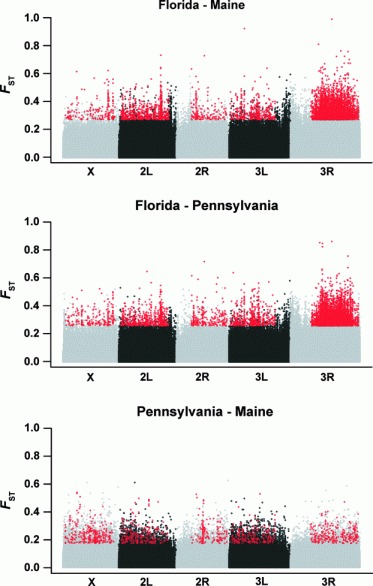
To investigate genetic differentiation among populations, we estimated pairwise FST for all polymorphic sites (Fig.; Table S3, Supporting information). As expected, differentiation between Florida and Maine (FM) (mean FST = 0.044) and between Florida and Pennsylvania (FP) (mean FST = 0.043) was much larger than between Pennsylvania and Maine (PM) (mean FST = 0.027). While mean FST was not significantly different between FM and FP, the amount of differentiation differed markedly between FM/FP and PM. Major differentiation between Florida and the other populations was observed on a genome-wide level and for each chromosomal arm (Fig. 4; Table S3, Supporting information). Chromosomal arm 3R was the most strongly differentiated region of the genome between Florida and the two other populations, especially within the region of In(3R)P (Fig. 4). This pattern is qualitatively identical to that found by Kolaczkowski et al. (2011) for the Australian cline, implying a major role of 3R and In(3R)P in latitudinal differentiation. In contrast to the strong differentiation seen for FM and FP, FST values were much smaller and similarly sized for PM, with the X chromosome being the most differentiated (Fig. 4, upper left panel). These findings demonstrate major latitudinal differentiation between Florida and Pennsylvania/Maine at a large number of sites spread throughout the genome, with a particular strong contribution of 3R. Differentiation between Pennsylvania and Maine, however, was much smaller, possibly due to higher gene flow and/or similar selection pressures acting on variants shared between these populations. Interestingly, these patterns might suggest a potential disconnect between global allele frequency differentiation and phenotypic differentiation. Populations from Pennsylvania are phenotypically intermediate between those from Florida and Maine with regard to major life history traits (Schmidt & Paaby 2008), yet this apparently needs not be reflected in global sequence differentiation. While this is an interesting observation, it is currently difficult to interpret without further phenotypic and genomic data from additional populations.
Fig 4.
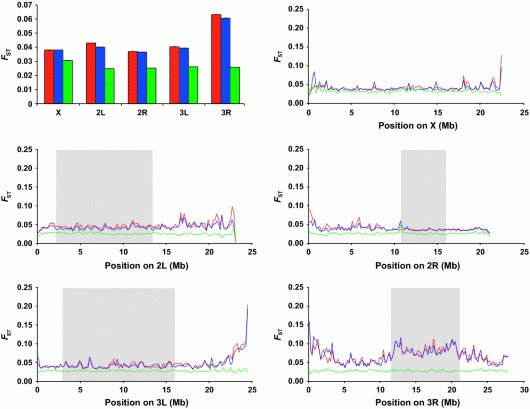
Average pairwise FST. Upper left: Average FST per chromosomal arm for all polymorphic SNPs. Error bars represent standard errors of the mean (SE); error bars are typically too small to be visible. The remaining line graphs show average FST for each chromosomal arm (X, 2L, 2R, 3L, 3R), estimated over 200-kb nonoverlapping windows. Red lines: pairwise comparison Florida – Maine; blue: Florida – Pennsylvania; green: Pennsylvania – Maine. Grey boxes indicate approximate regions spanned by the cosmopolitan inversions on the left and right arms of chromosome 2 (In(2L)t; In(2R)NS) and chromosome 3 (In(3L)P; In(3R)P).
Variation and differentiation in cosmopolitan inversions
Polymorphic inversions are very common in D. melanogaster (Ashburner & Lemeunier 1976; Lemeunier & Aulard 1992). Previous studies have found that the four large cosmopolitan paracentric inversions (In(2L)t, In(2R)NS, In(3L)P, In(3R)P) exhibit strongly clinal patterns, for example in North America (Mettler et al. 1977; Knibb 1982) and Australia (Knibb et al. 1981), with inversion frequency being higher at lower latitudes. This pattern repeated across different geographical areas suggests that climatic selection maintains inversion frequencies (Knibb et al. 1981; Krimbas & Powell 1992; Hoffmann et al. 2004). In particular, In(3R)Payne is thought to be a major driver of genetic and phenotypic differentiation along latitudinal clines (Gockel et al. 2002; Weeks et al. 2002; Calboli et al. 2003; De Jong & Bochdanovits 2003; Kennington et al. 2006, 2007; Rako et al. 2006, 2009; Hoffmann & Weeks 2007).
We found multiple lines of evidence for a strongly clinal distribution of In(3R)P. First, we used four molecular markers to estimate the frequency of In(3R)P in each population and observed that it segregates at a frequency ≥ 0.5 (median across all four markers) in Florida but that it is almost absent in Pennsylvania (median < 0.05) and Maine (median = 0.05) (Mettler et al. 1977; Knibb 1982). While frequency estimates differed among markers within a given population (e.g. for Maine marker frequencies ranged from 0.02 to 0.2; FET: P = 0.021), our data qualitatively confirm that In(3R)P is much rarer (or possibly absent) at higher as compared to lower latitudes. Second, the region spanned by In(3R)P was significantly more differentiated than the rest of 3R for FM and FP but not for PM, as expected from our inversion frequency estimates (Table S4, Supporting information). Thus, In(3R)P has a major impact on differentiation between Florida and Pennsylvania/Maine, a result that parallels the findings of Kolaczkowski et al. (2011) for the endpoints of the Australian cline. Third, within the region spanned by In(3R)P, average π was significantly higher in Florida (π = 0.0077) as compared to Pennsylvania (π = 0.0061) and Maine (π = 0.0061) (Wilcoxon rank sum test, both cases: P < 0.001), whereas π did not differ between Pennsylvania and Maine (P = 0.94) (also see Fig. 2).
The other inversions showed much less clear effects on differentiation than In(3R)P (Table S4, Supporting information). For FM and FP, median FST values were significantly lower within In(2L)t and In(2R)NS and not different within In(3L)P as compared to the rest of the chromosomal arms. However, for PM the median FST within In(2L)t was significantly higher than for the rest of 2L. While we did not investigate the frequencies of major cosmopolitan inversions other than In(3R)P, the frequencies of In(2L)t, In(2R)NS and In(3L)P are also known to vary strongly clinally along the east coast of the United States (Mettler et al. 1977; Knibb 1982). Thus, even though the frequencies of these inversions likely differ between our populations, we failed to observe major differentiation in the regions spanned by them.
Genic patterns of population differentiation
We next identified and characterized candidate genes that underlie population differentiation. In total, our data contained ~1.5 million polymorphic SNPs in 11 314 genes. After excluding sites with low recombination, we defined candidate genes as those that contained SNPs whose FST-values fell into the top 0.5% of the FST distribution and that showed statistically significant allele frequency differentiation among populations after FDR correction (q < 0.01). We identified 12 090 candidate SNPs in 3169 candidate genes across all three pairwise comparisons; for FM we found 6673 candidate SNPs in 2010 candidate genes, for FP 6892 in 2051 and for PM 1149 in 720 (Fig. S4, Table S5, Supporting information). FST scaled well with geographical distance between populations, with both average and maximum FST being highest for FM, slightly lower for FP and lowest for PM (Table 1, Fig. 5). As expected, FM and FP showed substantial overlap in the number of shared candidate genes (1109), suggesting that we successfully identified putative targets of selection consistently differentiated between Florida and Pennsylvania/Maine and reflecting low differentiation for PM (Fig. S4, Supporting information; Table 1). In contrast, PM only shared 243 candidate genes with FM and 260 with FP. Consequently, we found a relatively small number of candidate genes (160) shared among all three comparisons (Fig. S4, Supporting information; Table 1). A likely explanation is that the amount of differentiation between Pennsylvania and Maine is very small relative to FM and FP (Fig. 5). This might be because the frequency of In(3R)P, which harbours a large number of candidates, decreased substantially from Florida to Pennsylvania/Maine, whereas its frequency was very small (possibly zero) in Pennsylvania and Maine and practically indistinguishable between these two populations (also see Mettler et al. 1977; Knibb 1982).
Table 1.
Average pairwise FST values of candidate SNPs. Pairwise comparisons: FM, Florida – Maine; FP, Florida – Pennsylvania; PM, Pennsylvania – Maine. SE, standard error of the mean. q-Values from FET on allele frequencies
| Comparison | Mean FST | SE | Range | −(log10) q-value range | No. of candidates |
|---|---|---|---|---|---|
| FM | 0.34 | 0.0007 | 0.28–1 | 2.00–15.28 | 6673 |
| FP | 0.33 | 0.0007 | 0.27–0.87 | 2.00–16.04 | 6892 |
| PM | 0.24 | 0.0018 | 0.17–0.54 | 2.00–8.74 | 1149 |
Fig 5.
Pairwise FST of candidate SNPs. Pairwise FST values of all candidate SNPs for each comparison (top: Florida – Maine; centre: Florida – Pennsylvania; bottom: Pennsylvania – Maine). Different chromosomal arms are indicated by alternating grey and black; noncandidate SNPs are shown as grey or black circles; candidate SNPs are shown as red circles. Plots include low- and nonrecombining regions; this can be seen by some grey and black circles representing noncandidate SNPs with high FST values – these might for instance represent copy number variants.
Candidates for latitudinal differentiation were enriched on 3R for both FM and FP (77% of all candidate SNPs for both comparisons; FM: 5114 SNPs in 1218 genes; FP: 5286 SNPs in 1178 genes; χ2 test: P < 0.001) but underrepresented on all other chromosomal arms as compared to genomic background (χ2 test: P < 0.001) (Fig. 5). Within 3R, candidates for FM and FP were enriched in In(3R)P as compared to the rest of the arm (Table S6, Supporting information), with more than 50% of all FM and FP candidate SNPs occurring in this inversion (FM: 51%; 3425 SNPs in 735 genes; FP: 52%; 3597 SNPs in 737 genes; Fig. 5), underscoring the major role of 3R and In(3R)P in shaping latitudinal differentiation. Candidates for FM and FP were also overrepresented within the region of In(3L)P, an inversion whose frequency is negatively correlated with cold resistance (Weeks et al. 2002), but underrepresented within In(2L)t and In(2R)NS (Table S6, Supporting information; Fig. 5). In contrast, most candidates for PM were located on the X (26% of all candidate SNPs; 299 SNPs in 162 genes; χ2 test: P < 0.001), whereas candidates were underrepresented on 2L, 2R and 3L (χ2 tests: all P < 0.01). Notably, for PM, we failed to find enrichment of candidates on 3R and within In(3R)P as compared to the rest of 3R, with only 9% (107 SNPs in 82 genes) of all candidates occurring in this inversion (Table S6, Supporting information; Fig. 5). This confirms that differentiation between Pennsylvania and Maine is largely independent of In(3R)P, in agreement with our inversion frequency estimates. Only 377 genes were differentiated between Pennsylvania and Maine, thus representing candidates that might be independent of In(3R)P (Fig. S4, Table S5, Supporting information). This small number of candidates might indicate that only few genes within the region of In(3R)P are locally adapted and that most of the elevated differentiation in this region is due to linkage within the inversion. Interestingly, candidates within the region spanned by In(2R)NS were underrepresented for all pairwise comparisons, suggesting a consistent deficiency of genes contributing to differentiation across populations in this inversion, although it is known to harbour several clinal loci (Lemeunier & Aulard 1992).
Since our SNP-based candidate gene approach rests on the somewhat unrealistic assumption that SNPs are independent (no LD), we tested the robustness of our method by using a gene-based approach, similar to the window-based method used by Kolaczkowski et al. (2011). We estimated average FST across all polymorphic sites within a given gene for each pairwise comparison and defined candidate genes as those with an average FST in the top 5% of the distribution. When applied to this set, our SNP-based approach detected 86% of all candidate genes for FM, 88% for FP and 22% for PM (details not shown), indicating that both methods yield largely similar results, at least for FM and FP. The rather small overlap between the methods for PM might reflect the small amount of differentiation between Pennsylvania and Maine; since effect sizes of allele frequency differences for PM were small, the SNP-based approach might be much more conservative when applied to PM than the gene-based approach which does not condition FST values on significant FET. Interestingly, when we excluded candidates on 3R, the overlap between the two approaches decreased to 63% (−25%) for FM and to 67% (−21%) for FP, but increased to 27% (+5%) for PM. In general, we favour using the SNP-based over the gene- or window-based approach, especially when differentiation between populations is not very large.
Next, we investigated the size of genomic regions differentiated between populations. We predicted that strong differentiation in the neighbourhood of candidate SNPs, for instance due to haplotype structure, would elevate the statistical significance of SNPs flanking candidate SNPs, resulting in broad peaks around candidates. In all pairwise comparisons, and for all chromosomal arms except 3R, −log10(P)-values rapidly dropped to random background levels within ~100 bp (Fig. S5A–B, Supporting information). In contrast, for FM and FP, −log10(P)-values decayed more slowly on 3R as compared to other chromosomal arms, resulting in a broad base extending over > 500 bp up- and downstream of candidates, with −log10(P)-values converging asymptotically to random background (Fig. S5B, Supporting information). To examine whether this was caused by In(3R)P, we asked whether the −log10(P)-value distributions differ between the inversion and the rest of 3R (Fig. S5C–D, Supporting information). Within the inversion, −log10(P)-values were on average higher, both for the baseline and random background, than outside the inversion (Fig. S5C, Supporting information). Our results thus suggest an excess of differentiated variants on this chromosomal arm. However, when averaging −log10(P)-values for each pairwise comparison across all autosomes and excluding 3R, −log10(P)-values still decayed much more slowly to background for FM and FP than for PM (Fig. S5E, Supporting information). Thus, Florida appears to exhibit generally more differentiation than the other two populations independent of 3R and In(3R)P.
Biological description of candidate genes
To biologically characterize our candidate genes, we first examined differentiation of candidates across genome annotations (Table S7, Supporting information). Nonsynonymous sites were overrepresented in both FM (4%; χ2 test: P = 0.002) and FP (3%; χ2 test: P = 0.007) but not in PM (Table 2), indicating selection at the protein level between Florida and Pennsylvania/Maine. This contrasts with the results of Kolaczkowski et al. (2011) who did not find overrepresentation of protein-coding sequence in their data for the Australian cline (also see discussion below). Two interesting examples of strong nonsynonymous differentiation are the immunity genes Helicase89B (Hel89B), which positively regulates expression of antimicrobial peptides (Yagi & Ip 2005), and immune-regulated catalase (Irc), which is required in the gastrointestinal tract during host–microbe interactions (Ha et al. 2005a,b) and which also shows nonsynonymous differentiation along the Australian cline (Kolaczkowski et al. 2011). Given that North American populations vary clinally in egg production (Schmidt et al. 2005a,b; Schmidt & Paaby 2008), another interesting candidate showing nonsynonymous differentiation is twin, a gene important for germ line cyst development and oocyte fate (Morris et al. 2005). Numerous other examples of nonsynonymous differentiation can be found in Table S7 (Supporting information). Notably, while synonymous changes are classically assumed to be neutral, we found that synonymous sites were enriched for FM and FP but underrepresented for PM (Table 2; Table S7, Supporting information). Although the significance of this pattern remains unclear, several studies have shown that selection can act on synonymous sites, for example affecting translational efficiency or thermodynamic stability of mRNA (Shields et al. 1988; Cuevas et al. 2011). It also remains possible that the differentiation we have observed at synonymous sites is caused by linkage within genes that are targets of selection. Thus, our data suggest that 'silent' variants might play a role in latitudinal differentiation, although we cannot conclusively say whether this pattern is due to demography or selection. Unlike Kolaczkowski et al. (2011), we failed to detect over- or underrepresentation of 5'- and 3'-UTRs, but regions 1 kb downstream of candidate genes were enriched for FM and FP, possibly due to regulatory polymorphisms in these regions. Moreover, intergenic regions were underrepresented for FM and FP (Table 2; Table S7, Supporting information). For reasons presently unclear , our findings on differentiation across genome annotations do not agree particularly well with those of Kolaczkowski et al. (2011). One possibility might be that this discrepancy is due to the different timescales of differentiation for the Australian and North American cline, with D. melanogaster having colonized North America most likely prior to 1875 (Keller 2007), whereas the Australian cline is only about 100 years old (Hoffmann & Weeks 2007). This might, for example, explain differences among the two clines in the availability of nonsynonymous coding sequence variants which are expected to be much less polymorphic and available to selection on standing variation than synonymous variants during initial colonization and establishment of the cline (see discussion in Kolaczkowski et al. 2011).
Table 2.
Differentiation of candidate SNPs across genome annotations. Numbers are proportions of candidate SNPs with a particular feature; proportions were tested using χ2 tests, with significant (α = 0.01) over- or underrepresentation shown in boldface (ov, overrepresented; un, underrepresented). Pairwise comparisons: FM, Florida – Maine; FP, Florida – Pennsylvania; PM, Pennsylvania – Maine
| Feature | FM | FP | PM |
|---|---|---|---|
| Downstream | 0.12ov | 0.12ov | 0.10 |
| Intergenic | 0.14un | 0.14un | 0.19 |
| Intron | 0.38 | 0.37 | 0.40 |
| Nonsynonymous coding | 0.04ov | 0.03ov | 0.02 |
| Synonymous coding | 0.13ov | 0.14ov | 0.07un |
| Upstream | 0.13 | 0.14 | 0.16 |
| 3′UTR | 0.02 | 0.03 | 0.02 |
| 5′UTR | 0.02 | 0.02 | 0.02 |
| Other | 0.004 | 0.005ov | 0.003 |
To further characterize candidates, we performed GO analysis with Gowinda (Table S8, Supporting information) but failed to find significant enrichment of GO terms after FDR correction. Since Gowinda corrects for gene length bias by assuming complete linkage of SNPs within genes, power may be lower than for approaches that model the true underlying haplotype structure. For example, the top three GO categories with the lowest P-values had FDR-values between 0.19 and 0.22 for FM, 0.17 for FP and between 0.16 and 0.30 for PM. Although not being significant at a standard FDR threshold (e.g. FDR = 0.05), it is noteworthy that the top three categories for FM and FP were all related to metabolism (FM: 'metabolic process', 'proline metabolic process', 'primary metabolic process'; FP: 'proline metabolic process', 'protein metabolic process' and 'metabolic process'), whereas for PM the top three categories were all related to pathogen defence and immunity ('antibacterial humoural response', 'defence response', 'response to bacterium'). Despite the lack of significance, these patterns are consistent with those reported by Turner et al. (2008) and Kolaczkowski et al. (2011) who also found enrichment for GO terms related to metabolism and immunity; however, in contrast to our GO analysis, these studies did not correct for gene length bias. Importantly, when we performed GO analysis without correcting for gene length bias, we detected significant enrichment in dozens of GO categories (not shown), similar to Turner et al. (2008) and Kolaczkowski et al. (2011). Thus, in contrast to the commonly held view that significant GO enrichment might be indicative of selection, our results suggest that in the absence of gene length correction many GO patterns might be spurious and can therefore not necessarily be taken as strong evidence for spatially varying selection.
To supplement our analysis of candidates, we hand-curated functional information from FlyBase and the literature. Although candidates did not fall into significantly enriched GO categories, we identified hundreds of strongly differentiated genes in major functional pathways (see Table S5, Supporting information). Notably, our results not only identify numerous novel candidates but also confirm many genes and pathways previously implicated in latitudinal differentiation (also see Turner et al. 2008; Kolaczkowski et al. 2011). Specifically, we found that 644 candidate genes differentiated between the endpoints of the US cline (FM) were also significantly differentiated between the endpoints of the Australian cline (Queensland vs. Tasmania; see Kolaczkowski et al. 2011), which corresponds to a significant overlap of 31% between these candidate sets as compared to random expectation (P < 0.0001; see Table S9, Supporting information). Thus, while we cannot rule out that some of our candidates are false positives, and although we cannot formally prove that these loci are under selection, the major overlap with previously and independently identified candidates strongly suggests that our candidate genes represent targets of spatially varying selection and that differentiation at these loci is unlikely due to demography alone. Figure 6 shows patterns of FST differentiation for candidate SNPs in six exemplary candidate genes; Appendix S1–S12 (Supporting information) show examples of candidate genes in major biological pathways, including hand-curated functional information from FlyBase and the literature. For a full list of candidate genes, see Table S5 (Supporting information).
Fig 6.
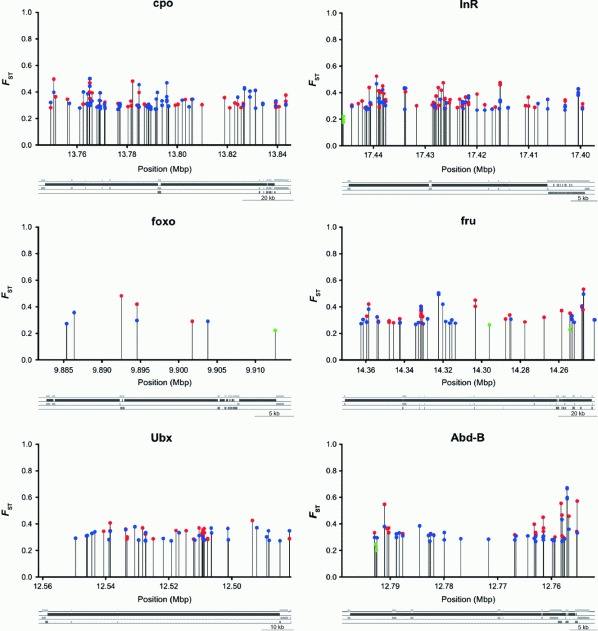
Examples of latitudinally differentiated candidate genes. FST of candidate SNPs in six exemplary candidate genes. The two genes shown in the top row (couch potato, cpo, and Insulin-like receptor, InR) have been previously found to vary clinally, whereas the remaining four genes (forkhead-box subgroup O, foxo; fruitless, fru; Ultrabithorax, Ubx, and Abdominal B, Abd-B) are novel candidates. Gene maps indicate locations of exons (first line from top), introns (second line), untranslated regions (UTRs; third line) and coding sequences (CDS; fourth line, bottom). For clarity, only one isoform is shown for genes that have multiple isoforms. Red dots: Florida – Maine; blue: Florida – Pennsylvania; green: Pennsylvania – Maine.
Many candidate genes have known roles in life history regulation (Flatt & Heyland 2011), and it is thus tempting to hypothesize that natural variants at these loci might underlie latitudinal differentiation in fitness-related traits. Notably, hormones are critical physiological regulators of life history traits (Finch & Rose 1995; Flatt & Heyland 2011), and we found many of our candidates to be involved in hormone signalling and production (Appendix S1–S3, Supporting information). In the insulin/insulin-like growth factor (IIS) and target of rapamycin (TOR) pathways, important for regulating growth, body size, metabolism, reproduction and lifespan (Oldham & Hafen 2003; Tatar et al. 2003), we found strongly differentiated SNPs in numerous genes, for example in two Drosophila insulin-like peptides (dilps 3 and 5); the insulin-like receptor (InR), previously found to vary clinally and affect life history traits in natural populations (Paaby et al. 2010; Kolaczkowski et al. 2011; Fig. 6); phosphatidylinositol-4,5-bisphosphate 3-kinase (Pi3K), previously linked to natural variation in reproductive dormancy (Williams et al. 2006); the forkhead transcription factor foxo downstream of IIS (Fig. 6) and in target of rapamycin (Tor) (Appendix S1, Supporting information). These findings are interesting in view of the fact that genetic manipulations of IIS/TOR are known to have major effects on life history traits in the laboratory (Tatar et al. 2003; Giannakou & Partridge 2007); in particular, they are consistent with the hypothesis that clinal variation in life history traits, for example body size, might be driven by natural variation in IIS/TOR signalling (De Jong & Bochdanovits 2003).
We also detected at least 14 candidate genes involved in ecdysone signalling and production (Appendix S2, Supporting information), a pathway important for regulating larval growth, body size, metamorphosis, ovarian development, reproductive dormancy, lifespan and immune function (Kozlova & Thummel 2000; Flatt et al. 2008; Galikova et al. 2011; Schmidt 2011). The perhaps most interesting candidate in this pathway is couch potato (cpo), a gene that is expressed in several tissues including the ring gland (larval site of ecdysone production), contains a large number of ecdysone response elements, varies both along the North American and Australian cline and underlies natural clinal variation in reproductive dormancy along the US east coast (Schmidt et al. 2008; Kolaczkowski et al. 2011; Schmidt 2011) (Fig. 6). Six of our candidates (cpo; the ecdysone inducible proteins Eip63E, Eip74EF, Eip75B, Eip93F; and Samuel) were also found for the Australian cline (Kolaczkowski et al. 2011) and three (Eip63E, Eip74EF, Eip75B) in an artificial selection experiment on body size (Turner et al. 2011), a trait known to vary clinally (David & Bocquet 1975; De Jong & Bochdanovits 2003). Moreover, a recent genomic study of latitudinal differentiation in Anopheles gambiae also detected strong differentiation in this pathway (Cheng et al. 2012). In contrast to Kolaczkowski et al. (2011), however, we did not detect significant differentiation at the ecdysone receptor (EcR) locus. Several nuclear hormone receptor and other endocrine genes, some of which are known to interact with ecdysone signalling (King-Jones & Thummel 2005), were also differentiated, including eclosion triggering hormone receptor (ETHR) (Appendix S3, Supporting information). Interestingly, Kolaczkowski et al. (2011) failed to find differentiation in ETHR but found clinal variation at eclosion hormone (Eh), the gene encoding the ligand for this receptor. The fact that these endocrine pathways all have major metabolic functions is perhaps consistent with the observation that the top three GO categories for FM and FP are related to metabolism (Table S8, Supporting information). In line with this, we also found several genes involved in lipid metabolism to be differentiated (Appendix S4, Supporting information).
Genes in the Toll/Imd pathways, involved in the regulation of innate immunity (Hoffmann 2003; Ferrandon et al. 2007), represent another major class of candidates (Appendix S5, Supporting information). Strongly differentiated candidates included peptidoglycan recognition proteins (PGRPs), central signalling components, such as immune deficiency (imd) and Toll, and various antimicrobial peptides such as Diptericin (Dpt) and Drosocin (Dro). Kolaczkowski et al. (2011) also observed enrichment of candidates in the Toll pathway as well as differentiation in other immunity genes, such as Irc and sick (sickie), which we also found. Our data thus indicate that latitudinal adaptation involves strong spatially varying selection on immunity, possibly due to variation in pathogen diversity and abundance across latitude (also see Turner et al. 2008; Kolaczkowski et al. 2011). In support of this notion, immunity genes are known to harbour a lot of genetic variation and to be under strong selection in natural populations (Lesser et al. 2006; Lazzaro 2008).
Several other central Drosophila signalling pathways contained differentiated candidate genes in our data, including EGFR, JAK/STAT, TGF-β/BMP and torso signalling; certain members of these pathways are known regulators of growth, body size, metamorphosis, reproductive development, immunity and metabolism (Appendix S6–S9, Supporting information). Again, we found differentiation in many candidates in these pathways also identified by Kolaczkowski et al. (2011), confirming that they are important targets of clinal selection. Similarly, clinal differentiation of candidates in the EGFR and TGF-β/BMP pathways has also been found in A. gambiae (Cheng et al. 2012). Genes involved in the molecular regulation of circadian rhythms were differentiated as well, including timeless (tim), timeout and cryptochrome (cry), which have all previously been found to vary clinally (Sandrelli et al. 2007; Tauber et al. 2007; Turner et al. 2008; Kolaczkowski et al. 2011), as well as a novel clinal candidate, clock (Clk) (Appendix S10, Supporting information). Yet, unlike other studies (Costa et al. 1992; Sawyer et al. 1997; Turner et al. 2008; Kolaczkowski et al. 2011), we failed to find differentiation in the period (per) locus, presumably due to our rather stringent criteria for defining candidates (see details in Appendix S10, Supporting information). Differentiation in this pathway is noteworthy because it has been implicated in the photoperiodic regulation of reproductive dormancy (Sandrelli et al. 2007; Tauber et al. 2007), which is known to vary clinally (Schmidt et al. 2005a,b; Schmidt & Paaby 2008). We also observed differentiation in several candidates involved in learning and memory (Appendix S11, Supporting information). One of the most prominent genes in this group is foraging (for), a cGMP-dependent protein kinase known to harbour a natural larval behavioural polymorphism (Osborne et al. 1997), which also affects adult learning and memory (Mery et al. 2007). Interestingly, for is also involved in the metabolic response to food deprivation by interacting with IIS (Kent et al. 2009). This locus was also found to be differentiated by Turner et al. (2008), and Kolaczkowski et al. (2011) similarly found enrichment of candidates involved in the development of the mushroom bodies, brain structures important for learning and memory. Finally, several well-known transcription factor genes showed clear patterns of differentiation, for example Ultrabithorax (Ubx) and Abdominal-B (Abd-B), two major Hox genes critically important for development, as well as fruitless (fru), a gene involved in determining sex-specific mating behaviour (Appendix S12, Supporting information; Fig. 6).
Clinal allele frequency change in candidate genes
To explicitly investigate the clinal dynamics of candidate genes, we analysed how allele frequencies change with latitude. While our data allowed us to go beyond comparing the endpoints of the cline (Turner et al. 2008; Kolaczkowski et al. 2011), our analysis based on only three populations is necessarily somewhat provisional. Nonetheless, our results confirm several genes previously reported to vary clinally and reveal numerous novel clinal candidates. For a full list of these clinal candidate genes, see Appendix S14 (Supporting information); many of the biologically interesting candidates discussed above are contained in this list.
We conditioned each SNP for the allele increasing in frequency between Florida and Maine and examined frequency changes across all populations. This resulted in three possible classes of frequency change: alleles that (i) show a constant increase across all populations; (ii) first drop in frequency between Florida and Pennsylvania and then increase between Pennsylvania and Maine and (iii) first increase in frequency between Florida and Pennsylvania and then drop between Pennsylvania and Maine. The latter two classes might not necessarily reflect clinal selection but might contain genes differentiated due to local adaptation or genetic drift. We therefore only considered SNPs showing a consistent increase in frequency across all populations and merged them into one clinal data set ('plus_plus' candidates), comprising 1974 candidate genes (6117 SNPs in total; FM: 88.4% of all candidate SNPs; FP: 28.5%; PM: 6.6%). For each of these candidate genes, we show plots of allele frequency against latitude in Appendix S14 (Supporting information). Importantly, numerous of these clinal candidates have also been found by Kolaczkowski et al. (2011) for the Australian cline (also see Table S9, Supporting information).
To functionally characterize these clinal candidates, we performed GO analysis using Gowinda to correct for gene length bias. The top three GO categories in terms of the lowest P-values were 'RNA methylation' (FDR = 0.04) and, similar to our analyses for FM and FP above, 'metabolic process' (FDR = 0.12) as well as 'primary metabolic process' (FDR = 0.24) (Table S8, Supporting information). We further refined our core set of clinal candidates by restricting the analysis to those SNPs whose 95% confidence intervals for allele frequencies did not overlap among populations; such SNPs show the steepest frequency change with latitude. This yielded a set of 173 significantly clinal SNPs located in 141 candidate genes (Appendix S14, Supporting information; plots containing SNPs with trajectories in red). Since confidence limits were often quite large, and because we only had data for three populations along the cline, this is a relatively small set of clinal candidates. To our knowledge, only 13 genes (9.3%) of this set have previously been mentioned in the literature as varying clinally: CG5466; CG31320; CG31380; the cardioacceleratory peptide receptor CcapR; cpo; Eip63E; the gustatory receptor Gr36a; the transcription factor Ino80; InR; the lipophorin receptor LpR1; sick; the JAK/STAT transcription factor Stat92E; and the transglutaminase Tg (Schmidt et al. 2008; Turner et al. 2008; Kolaczkowski et al. 2011; Paaby et al. 2010). Although we did not perform a comprehensive comparison with published data, this suggests that most of our significantly clinal candidates are novel. GO analysis of this refined set did not yield significant results (all FDRs > 0.25; not shown), probably due to a lack of statistical power and our conservative correction for gene length bias.
Some interesting examples of clinal candidate genes and their allele frequency trajectories across latitude are shown in Fig. 7. The top two panels depict two candidates already known to vary clinally, InR (Paaby et al. 2010) and sick (Kolaczkowski et al. 2011), whereas the bottom four panels show examples of newly identified clinal candidate genes that contain SNPs whose frequencies change very strongly with latitude: Tetraspanin96F (Tsp96F), a gene with unknown molecular function and phenotypic effect; SNF4/AMP-activated protein kinase gamma subunit (SNF4Agamma), a gene involved in lipid metabolism and the response to starvation (Johnson et al. 2010); CG5948, a gene with putative, electronically inferred roles in metal ion binding, oxidation reduction and superoxide metabolism; and CG13272, again a gene whose function is completely unknown (see FlyBase for further information).
Fig 7.
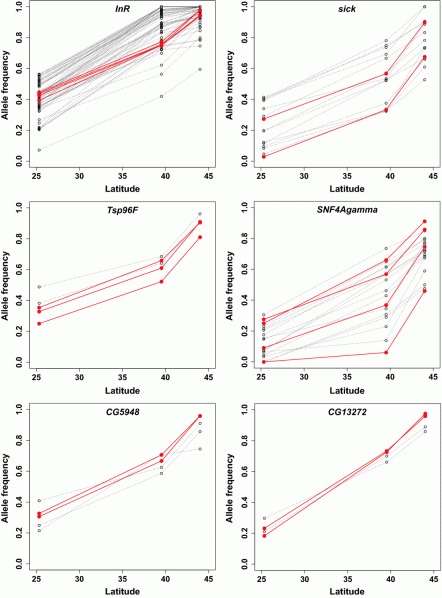
Examples of clinal SNPs in candidate genes. Allele frequencies of candidate SNPs in six exemplary candidate genes, rising in frequency across the cline, from low (Florida) to high latitude (Maine). The two genes in the top row (Insulin-like receptor, InR, and sickie, sick) have been previously found to vary clinally, whereas the remaining four are novel candidates (Tetraspanin 96F, Tsp96F; SNF4/AMP-activated protein kinase gamma subunit, SNF4Agamma; CG5948 and CG13272). Red lines indicate SNPs whose 95% binomial confidence intervals do not overlap across populations (latitudes).
Conclusions
Many previous studies have found major phenotypic and genetic differentiation in D. melanogaster along the well-known North American cline, a pattern thought to be caused by spatially varying selection (Oakeshott et al. 1982; Singh & Rhomberg 1987; Coyne & Beecham 1987; Hale & Singh 1991; Berry & Kreitman 1993; Schmidt et al. 2008; Turner et al. 2008; Paaby et al. 2010). Despite major progress (Turner et al. 2008), however, our understanding of the genetic basis of latitudinal differentiation along this cline is still limited. In an attempt to complement and extend recent genomic efforts towards understanding clinal variation in D. melanogaster (Turner et al. 2008; Kolaczkowski et al. 2011), we have performed the first genome-wide next-generation sequencing analysis of latitudinal differentiation along the North American cline. Our results are consistent with the hypothesis that hundreds of key genes and many important functional pathways might experience pervasive spatially varying selection along this cline, with many of the candidates being involved in the regulation of life history traits and metabolism. Our data thus provide a comprehensive catalogue of candidate genes for phenotypes known to vary clinally, including fitness-related traits such as body size, fecundity, lifespan and reproductive dormancy. Despite important limitations of the quantitative trait nucleotide (QTN) approach (Rockman 2012), it will clearly be of major interest to functionally analyse the phenotypic effects of natural variants we have uncovered. Interestingly, several of the pathways we have identified interact strongly with each other and are known to have highly pleiotropic phenotypic effects (also see Kolaczkowski et al. 2011), for example IIS and ecdysone signalling interact in regulating larval growth (Colombani et al. 2005) as well as reproductive dormancy (Schmidt 2011), and ecdysone signalling transcriptionally regulates the expression of antimicrobial peptides involved in humoral innate immunity (Flatt et al. 2008). If populations harbour genetic variance for such molecular interactions, genic targets of spatially varying selection might not be independent of each other. In this case, latitudinal adaptation might involve correlational selection, acting on suites of correlated phenotypes caused by genetic correlations, for example due to pleiotropy, epistasis or linkage (Sinervo & Svensson 2002). Indeed, one of our most important findings is that the majority of candidate SNPs and genes we have identified are located within the region spanned by the major cosmopolitan inversion on 3R, In(3R)Payne. This striking pattern might be consistent with the idea that In(3R)Payne represents a 'coadapted gene complex' or 'supergene' (Dobzhansky 1970; also see Krimbas & Powell 1992; Schaeffer et al. 2003; Hoffmann et al. 2004) or, alternatively, with strong linkage and hitchhiking within this inversion. Importantly, our data also provide compelling evidence for major parallel differentiation at numerous loci between the North American and Australian clines, a pattern that is most parsimoniously explained by spatially varying selection and that is unlikely solely due to demography. While the caveat remains that we cannot conclusively prove that our candidates are subject to selection, and while demonstrating selection will require in-depth studies of individual candidate genes and QTNs, our results considerably strengthen the case for spatially varying selection across latitude at numerous loci spread throughout the genome.
Acknowledgments
We are grateful to R. V. Pandey and M. Würdemann for help with programming; to A. Betancourt, A. Futschik, H. Bastide and R. Tobler for discussion and to three anonymous reviewers, D. Tautz and T. Vines for helpful comments on a previous version of the manuscript. This work was supported by grants from the Austrian Science Foundation (FWF P21498 to TF and FWF P19467 to CS), the Vienna Graduate School of Population Genetics (FWF grant W1225), a fellowship from the Wissenschaftskolleg zu Berlin to TF and a grant from the National Science Foundation (NSF DEB0921307 to PS).
D.F. and M.K. performed research, analysed data and wrote the paper; V.N. extracted DNA, prepared libraries and performed sequencing; R.K. contributed new analytical tools; P.S. collected samples; P.S., C.S. and T.F. conceived the study, designed research and analyses and wrote the paper.
Data accessibility
DNA sequences: http://www.ebi.ac.uk/ena/data/view/ERP001535
Supporting Information
Additional Supporting Information may be found in the online version of this article.
Fig. S1 Average coverage of pool-seq samples.
Fig. S2 Average scaled population mutation rate θW.
Fig. S3 Frequency of the major cosmopolitan inversion In(3R)Payne.
Fig. S4 Overlap of candidate genes among population comparisons.
Fig. S5 Decay of statistical significance around candidate SNPs.
Table S1 Average nucleotide diversity π.
Table S2 Average scaled population mutation rate θW.
Table S3 Average pairwise FST values.
Table S4 Average pairwise FST in- and outside inversions.
Table S5 Top candidate genes.
Table S6 Proportion of candidate SNPs within inversions.
Table S7 Genome annotations of candidate genes.
Table S8 Gene ontology (GO) analysis of candidates.
Appendix S1 Examples of candidate genes in the insulin/insulin-like growth factor (IIS) and target of rapamycin (TOR) signaling pathways.
Appendix S2 Examples of candidate genes involved in ecdysone biosynthesis and signaling.
Appendix S3 Examples of candidate genes involved in nuclear hormone receptor (NHR) signaling and other endocrine pathways.
Appendix S4 Examples of candidate genes involved in lipid metabolism.
Appendix S5 Examples of candidate genes involved in innate immunity (Toll/Imd signaling).
Appendix S6 Examples of candidate genes involved in epidermal growth factor (EGFR) signaling.
Appendix S7 Examples of candidate genes involved in JAK/STAT signaling.
Appendix S8 Examples of candidate genes involved in TGF-β/BMP signaling.
Appendix S9 Examples of candidate genes involved in torso signaling.
Appendix S10 Examples of candidate genes involved in circadian rhythms.
Appendix S11 Examples of candidate genes involved in learning and memory.
Appendix S12 Examples of some transcription factor candidate genes.
Appendix S13 Description of the bioinformatic analysis pipeline, including Python scripts.
Appendix S14 Plots for each clinal ('plus_plus') candidate gene, showing the changes in allele frequency for the candidate gene as a function of latitude.
Please note: Wiley-Blackwell are not responsible for the content or functionality of any supporting materials supplied by the authors. Any queries (other than missing material) should be directed to the corresponding author for the article.
References
- Adams MD, Celniker SE, Holt RA, et al. The genome sequence of Drosophila melanogaster. Science. 2000;287:2185–2195. doi: 10.1126/science.287.5461.2185. [DOI] [PubMed] [Google Scholar]
- Akey JM. Constructing genomic maps of positive selection in humans: where do we go from here? Genome Research. 2009;19:711–722. doi: 10.1101/gr.086652.108. [DOI] [PMC free article] [PubMed] [Google Scholar]
- Akey JM, Ruhe AL, Akey DT, et al. Tracking footprints of artificial selection in the dog genome. Proceedings of the National Academy of Sciences USA. 2010;107:1160–1165. doi: 10.1073/pnas.0909918107. [DOI] [PMC free article] [PubMed] [Google Scholar]
- Anderson AR, Collinge JE, Hoffmann AA, Kellett M, McKechnie SW. Thermal tolerance trade-offs associated with the right arm of chromosome 3 and marked by the hsr-omega gene in Drosophila melanogaster. Heredity. 2003;90:195–202. doi: 10.1038/sj.hdy.6800220. [DOI] [PubMed] [Google Scholar]
- Anderson AR, Hoffmann AA, McKechnie SW, Umina PA, Weeks AR. The latitudinal cline in the In(3R)Payne inversion polymorphism has shifted in the last 20 years in Australian Drosophila melanogaster populations. Molecular Ecology. 2005;14:851–858. doi: 10.1111/j.1365-294X.2005.02445.x. [DOI] [PubMed] [Google Scholar]
- Ashburner M, Lemeunier F. Relationships within the melanogaster species subgroup of the genus Drosophila (Sophophora). I. Inversion polymorphisms in drosophila melanogaster and Drosophila simulans. Proceedings of the Royal Society of London B. 1976;193:137–157. doi: 10.1098/rspb.1976.0036. [DOI] [PubMed] [Google Scholar]
- Ashburner M, Ball CA, Blake JA, et al. Gene ontology: tool for the unification of biology. The Gene Ontology Consortium. Nature Genetics. 2000;25:25–29. doi: 10.1038/75556. [DOI] [PMC free article] [PubMed] [Google Scholar]
- Barrett RDH, Hoekstra HE. Molecular spandrels: tests of adaptation at the genetic level. Nature Reviews Genetics. 2011;12:767–780. doi: 10.1038/nrg3015. [DOI] [PubMed] [Google Scholar]
- Barton NH. Multilocus clines. Evolution. 1983;37:454–471. doi: 10.1111/j.1558-5646.1983.tb05563.x. [DOI] [PubMed] [Google Scholar]
- Barton NH. Clines in polygenic traits. Genetical Research. 1999;74:223–236. doi: 10.1017/s001667239900422x. [DOI] [PubMed] [Google Scholar]
- Beaumont MA. Adaptation and speciation: what can FST tell us? Trends in Ecology and Evolution. 2005;20:435–440. doi: 10.1016/j.tree.2005.05.017. [DOI] [PubMed] [Google Scholar]
- Beaumont MA, Balding DJ. Identifying adaptive genetic divergence among populations from genome scans. Molecular Ecology. 2004;13:969–980. doi: 10.1111/j.1365-294x.2004.02125.x. [DOI] [PubMed] [Google Scholar]
- Begun DJ, Aquadro CF. Levels of naturally occurring DNA polymorphism correlate with recombination rates in D. melanogaster. Nature. 1992;356:519–520. doi: 10.1038/356519a0. [DOI] [PubMed] [Google Scholar]
- Berry A, Kreitman M. Molecular analysis of an allozyme cline: alcohol dehydrogenase in Drosophila melanogaster on the East Coast of North America. Genetics. 1993;134:869–893. doi: 10.1093/genetics/134.3.869. [DOI] [PMC free article] [PubMed] [Google Scholar]
- Black WC, IV, Baer CF, Antolin MF, DuTeau NM. Population genomics: genome-wide sampling of insect populations. Annual Review of Entomology. 2001;46:441–469. doi: 10.1146/annurev.ento.46.1.441. [DOI] [PubMed] [Google Scholar]
- Bouletreau-Merle J, Fouillet P, Varaldi J. Divergent strategies in low temperature environment for the sibling species Drosophila melanogaster and D. simulans: overwintering in extension border areas of France and comparison with African populations. Evolutionary Ecology. 2003;17:523–548. [Google Scholar]
- Calboli FC, Kennington WJ, Partridge L. QTL mapping reveals a striking coincidence in the positions of genomic regions associated with adaptive variation in body size in parallel clines of Drosophila melanogaster on different continents. Evolution. 2003;57:2653–2658. doi: 10.1111/j.0014-3820.2003.tb01509.x. [DOI] [PubMed] [Google Scholar]
- Caracristi G, Schlötterer C. Genetic differentiation between American and European Drosophila melanogaster populations could be attributed to admixture of African alleles. Molecular Biology and Evolution. 2003;20:792–799. doi: 10.1093/molbev/msg091. [DOI] [PubMed] [Google Scholar]
- Charlesworth B, Charlesworth D. Elements of Evolutionary Genetics. Greenwood Village, Colorado: Roberts and Company; 2010. [Google Scholar]
- Cheng C, White BJ, Kamdem C, et al. Ecological genomics of Anopheles gambiae along a latitudinal cline in Cameroon: a population resequencing approach. Genetics. 2012;190:1417–1432. doi: 10.1534/genetics.111.137794. [DOI] [PMC free article] [PubMed] [Google Scholar]
- Colombani J, Bianchini L, Layalle S, et al. Antagonistic actions of ecdysone and insulins determine final size in Drosophila. Science. 2005;310:667–670. doi: 10.1126/science.1119432. [DOI] [PubMed] [Google Scholar]
- Costa R, Peixoto AA, Barbujani G, Kyriacou CP. A latitudinal cline in a Drosophila Clock gene. Proceedings of the Royal Society of London B. 1992;250:43–49. doi: 10.1098/rspb.1992.0128. [DOI] [PubMed] [Google Scholar]
- Coyne JA, Beecham E. Heritability of two morphological characters within and among natural populations of Drosophila melanogaster. Genetics. 1987;117:727–737. doi: 10.1093/genetics/117.4.727. [DOI] [PMC free article] [PubMed] [Google Scholar]
- Cuevas JM, Domingo-Calap P, Sanjuan R. The fitness effects of synonymous mutations in DNA and RNA viruses. Molecular Biology and Evolution. 2011;19:17–20. doi: 10.1093/molbev/msr179. [DOI] [PubMed] [Google Scholar]
- Dalmasso C, Broët P, Moreau T. A simple procedure for estimating the false discovery rate. Bioinformatics. 2005;21:660–668. doi: 10.1093/bioinformatics/bti063. [DOI] [PubMed] [Google Scholar]
- David JR, Bocquet C. Evolution in a cosmopolitan species: genetic latitudinal clines in Drosophila melanogaster wild populations. Experientia. 1975;31:164–166. doi: 10.1007/BF01990682. [DOI] [PubMed] [Google Scholar]
- David JR, Capy P. Genetic variation of Drosophila melanogaster natural populations. Trends in Genetics. 1988;111:357–370. doi: 10.1016/0168-9525(88)90098-4. [DOI] [PubMed] [Google Scholar]
- De Jong G, Bochdanovits Z. Latitudinal clines in Drosophila melanogaster: body size, allozyme frequencies, inversion frequencies, and the insulin-signalling pathway. Journal of Genetics. 2003;82:207–223. doi: 10.1007/BF02715819. [DOI] [PubMed] [Google Scholar]
- Dobzhansky T. Genetics of the Evolutionary Process. New York: Columbia University Press; 1970. [Google Scholar]
- Endler JA. Geographic Variation, Speciation and Clines. Princeton, New Jersey: Princeton University Press; 1977. [PubMed] [Google Scholar]
- Felsenstein J. The theoretical population genetics of variable selection and migration. Annual Review of Genetics. 1976;10:253–280. doi: 10.1146/annurev.ge.10.120176.001345. [DOI] [PubMed] [Google Scholar]
- Ferrandon D, Imler J, Hetru C, Hoffmann J. The Drosophila systemic immune response: sensing and signaling during bacterial and fungal infections. Nature Reviews Immunology. 2007;7:862–874. doi: 10.1038/nri2194. [DOI] [PubMed] [Google Scholar]
- Finch CE, Rose MR. Hormones and the physiological architecture of life history evolution. Quarterly Review of Biology. 1995;70:1–52. doi: 10.1086/418864. [DOI] [PubMed] [Google Scholar]
- Flatt T, Heyland A. Mechanisms of Life History Evolution. The Genetics and Physiology of Life History Traits and Trade-Offs. Oxford: Oxford University Press; 2011. [Google Scholar]
- Flatt T, Heyland A, Rus F, et al. Hormonal regulation of the humoral innate response in Drosophila melanogaster. Journal of Experimental Biology. 2008;211:2712–2724. doi: 10.1242/jeb.014878. [DOI] [PMC free article] [PubMed] [Google Scholar]
- Futschik A, Schlötterer C. The next generation of molecular markers from massively parallel sequencing of pooled DNA samples. Genetics. 2010;186:207–218. doi: 10.1534/genetics.110.114397. [DOI] [PMC free article] [PubMed] [Google Scholar]
- Galikova M, Klepsatel P, Senti G, Flatt T. Steroid hormone regulation of C. elegans and Drosophila aging and life history. Experimental Gerontology. 2011;46:141–147. doi: 10.1016/j.exger.2010.08.021. [DOI] [PubMed] [Google Scholar]
- Giannakou ME, Partridge L. Role of insulin-like signalling in Drosophila lifespan. Trends in Biochemical Science. 2007;32:180–188. doi: 10.1016/j.tibs.2007.02.007. [DOI] [PubMed] [Google Scholar]
- Gockel J, Kennington WJ, Hoffmann AA, Goldstein DB, Partridge L. Nonclinality of molecular variation implicates selection in maintaining a morphological cline of Drosophila melanogaster. Genetics. 2001;158:319–323. doi: 10.1093/genetics/158.1.319. [DOI] [PMC free article] [PubMed] [Google Scholar]
- Gockel J, Robinson SJ, Kennington WJ, Goldstein DB, Partridge L. Quantitative genetic analysis of natural variation in body size in Drosophila melanogaster. Heredity. 2002;89:145–153. doi: 10.1038/sj.hdy.6800121. [DOI] [PubMed] [Google Scholar]
- Ha E-M, Oh C-T, Bae YS, Lee W-J. A direct role for dual oxidase in Drosophila gut immunity. Science. 2005a;310:847–850. doi: 10.1126/science.1117311. [DOI] [PubMed] [Google Scholar]
- Ha E-M, Oh C-T, Ryu J-H, et al. An antioxidant system required for host protection against gut infection in Drosophila. Developmental Cell. 2005b;8:125–132. doi: 10.1016/j.devcel.2004.11.007. [DOI] [PubMed] [Google Scholar]
- Hale LR, Singh RS. A comprehensive study of genic variation in natural populations of Drosophila melanogaster. IV. Mitochondrial DNA variation and the role of history vs. selection in the genetic structure of geographic populations. Genetics. 1991;129:103–117. doi: 10.1093/genetics/129.1.103. [DOI] [PMC free article] [PubMed] [Google Scholar]
- Hedrick PW. Genetic polymorphism in heterogeneous environments: the age of genomics. Annual Review of Ecology, Evolution, and Systematics. 2006;37:67–93. [Google Scholar]
- Hoffmann JA. The immune response of Drosophila. Nature. 2003;426:33–38. doi: 10.1038/nature02021. [DOI] [PubMed] [Google Scholar]
- Hoffmann AA, Weeks AR. Climatic selection on genes and traits after a 100 year-old invasion: a critical look at the temperate-tropical clines in Drosophila melanogaster from eastern Australia. Genetica. 2007;129:133–147. doi: 10.1007/s10709-006-9010-z. [DOI] [PubMed] [Google Scholar]
- Hoffmann AA, Anderson A, Hallas R. Opposing clines for high and low temperature resistance in Drosophila melanogaster. Ecology Letters. 2002;5:614–618. [Google Scholar]
- Hoffmann AA, Scott M, Partridge L, Hallas R. Overwintering in Drosophila melanogaster: outdoor field cage experiments on clinal and laboratory selected populations help to elucidate traits under selection. Journal of Evolutionary Biology. 2003;16:614–623. doi: 10.1046/j.1420-9101.2003.00561.x. [DOI] [PubMed] [Google Scholar]
- Hoffmann AA, Sgro CM, Weeks AR. Chromosomal inversion polymorphisms and adaptation. Trends in Ecology and Evolution. 2004;19:482–488. doi: 10.1016/j.tree.2004.06.013. [DOI] [PubMed] [Google Scholar]
- James AC, Partridge L. Thermal evolution of rate of larval development in Drosophila melanogaster in laboratory and field populations. Journal of Evolutionary Biology. 1995;8:315–330. [Google Scholar]
- Johnson EC, Kazgan N, Bretz CA, et al. Altered metabolism and persistent starvation behaviors caused by reduced AMPK function in Drosophila. PLoS ONE. 2010;5:e12799. doi: 10.1371/journal.pone.0012799. [DOI] [PMC free article] [PubMed] [Google Scholar]
- Karlin S, McGregor J. Application of method of small parameters to multi-niche population genetic models. Theoretical Population Biology. 1972a;3:186–209. doi: 10.1016/0040-5809(72)90026-3. [DOI] [PubMed] [Google Scholar]
- Karlin S, McGregor J. Polymorphisms for genetic and ecological systems with weak coupling. Theoretical Population Biology. 1972b;3:210–238. doi: 10.1016/0040-5809(72)90027-5. [DOI] [PubMed] [Google Scholar]
- Keller A. Drosophila melanogaster's history as a human commensal. Current Biology. 2007;17:R77–R81. doi: 10.1016/j.cub.2006.12.031. [DOI] [PubMed] [Google Scholar]
- Kennington WJ, Gockel J, Partridge L. Testing for asymmetrical gene flow in a Drosophila melanogaster body-size cline. Genetics. 2003;165:667–673. doi: 10.1093/genetics/165.2.667. [DOI] [PMC free article] [PubMed] [Google Scholar]
- Kennington WJ, Partridge L, Hoffmann AA. Patterns of diversity and linkage disequilibrium within the cosmopolitan inversion In(3R) Payne in Drosophila melanogaster are indicative of coadaptation. Genetics. 2006;172:1655–1663. doi: 10.1534/genetics.105.053173. [DOI] [PMC free article] [PubMed] [Google Scholar]
- Kennington WJ, Hoffmann AA, Partridge L. Mapping regions within cosmopolitan inversion In(3R)Payne associated with natural variation in body size in Drosophila melanogaster. Genetics. 2007;177:549–556. doi: 10.1534/genetics.107.074336. [DOI] [PMC free article] [PubMed] [Google Scholar]
- Kent CF, Daskalchuk T, Cook L, Sokolowski MB, Greenspan RJ. The Drosophila foraging gene mediates adult plasticity and gene-environment interactions in behaviour, metabolites, and gene expression in response to food deprivation. PLoS Genetics. 2009;5:e1000609. doi: 10.1371/journal.pgen.1000609. [DOI] [PMC free article] [PubMed] [Google Scholar]
- King-Jones K, Thummel CS. Nuclear receptors – a perspective from Drosophila. Nature Reviews Genetics. 2005;6:311–323. doi: 10.1038/nrg1581. [DOI] [PubMed] [Google Scholar]
- Knibb WR. Chromosome inversion polymorphisms in Drosophila melanogaster II. Geographic clines and climatic associations in Australasia, North America and Asia. Genetica. 1982;58:213–221. [Google Scholar]
- Knibb WR, Oakeshott JG, Gibson JB. Chromosome inversion polymorphisms in Drosophila melanogaster. I. Latitudinal clines and associations between inversions in Australasian populations. Genetics. 1981;98:833–847. doi: 10.1093/genetics/98.4.833. [DOI] [PMC free article] [PubMed] [Google Scholar]
- Kofler R, Schlötterer C. Gowinda: unbiased analysis of gene set enrichment for Genome Wide Association Studies. Bioinformatics. 2012;28:2084–2085. doi: 10.1093/bioinformatics/bts315. [DOI] [PMC free article] [PubMed] [Google Scholar]
- Kofler R, Orozco-terWengel P, De Maio N, et al. PoPoolation: a toolbox for population genetic analysis of next generation sequencing data from pooled individuals. PLoS ONE. 2011a;6:e15925. doi: 10.1371/journal.pone.0015925. [DOI] [PMC free article] [PubMed] [Google Scholar]
- Kofler R, Pandey RV, Schlötterer C. PoPoolation2: identifying differentiation between populations using sequencing of pooled DNA samples (Pool-Seq) Bioinformatics. 2011b;27:3435–3436. doi: 10.1093/bioinformatics/btr589. [DOI] [PMC free article] [PubMed] [Google Scholar]
- Kolaczkowski B, Kern AD, Holloway AK, Begun DJ. Genomic differentiation between temperate and tropical Australian populations of Drosophila melanogaster. Genetics. 2011;187:245–260. doi: 10.1534/genetics.110.123059. [DOI] [PMC free article] [PubMed] [Google Scholar]
- Kozlova T, Thummel CS. Steroid regulation of postembryonic development and reproduction in Drosophila. Trends in Endocrinology and Metabolism. 2000;11:276–280. doi: 10.1016/s1043-2760(00)00282-4. [DOI] [PubMed] [Google Scholar]
- Krimbas CB, Powell JR. Drosophila Inversion Polymorphism. Boca Raton, Florida: CRC Press; 1992. [Google Scholar]
- Lachaise D, Silvain JF. How two Afrotropical endemics made two cosmopolitan human commensals: the Drosophila melanogaster – D. simulans palaeogeographic riddle. Genetica. 2004;120:17–39. doi: 10.1023/b:gene.0000017627.27537.ef. [DOI] [PubMed] [Google Scholar]
- Langley CH, Lazzaro BP, Phillips W, Heikkinen E, Braverman JM. Linkage disequilibria and the site frequency spectra in the su(s) and su(wa) regions of the Drosophila melanogaster X Chromosome. Genetics. 2000;156:1837–1852. doi: 10.1093/genetics/156.4.1837. [DOI] [PMC free article] [PubMed] [Google Scholar]
- Latta RG. Differentiation of allelic frequencies at quantitative trait loci affecting locally adaptive traits. American Naturalist. 1998;151:283–292. doi: 10.1086/286119. [DOI] [PubMed] [Google Scholar]
- Lazzaro BP. Natural selection on the Drosophila antimicrobial immune system. Current Opinion in Microbiology. 2008;11:284–289. doi: 10.1016/j.mib.2008.05.001. [DOI] [PMC free article] [PubMed] [Google Scholar]
- Le Corre V, Kremer A. Genetic variability at neutral markers, quantitative trait loci and trait in a subdivided population under selection. Genetics. 2003;164:1205–1219. doi: 10.1093/genetics/164.3.1205. [DOI] [PMC free article] [PubMed] [Google Scholar]
- Lemeunier F, Aulard S. Inversion Polymorphisms in Drosophila melanogaster. In: Krimbas CB, Powell JR, editors. Drosophila Inversion Polymorphisms. Boca Raton, Florida: CRC Press; 1992. pp. 339–405. [Google Scholar]
- Lesser KJ, Paiusi IC, Leips J. Naturally occurring genetic variation in the age-specific immune response of Drosophila melanogaster. Aging Cell. 2006;5:293–295. doi: 10.1111/j.1474-9726.2006.00219.x. [DOI] [PubMed] [Google Scholar]
- Levene H. Genetic equilibrium when more than one ecological niche is available. American Naturalist. 1953;87:331–333. [Google Scholar]
- Lewontin RC. The Genetic Basis of Evolutionary Change. New York: Columbia University Press; 1974. [Google Scholar]
- Lewontin RC, Krakauer J. Distribution of gene frequency as a test of the theory of the selective neutrality of polymorphisms. Genetics. 1973;74:175–195. doi: 10.1093/genetics/74.1.175. [DOI] [PMC free article] [PubMed] [Google Scholar]
- Lewontin RC, Krakauer J. Testing the heterogeneity of F values. Genetics. 1975;80:397–398. doi: 10.1093/genetics/80.2.397. [DOI] [PMC free article] [PubMed] [Google Scholar]
- Li H, Durbin R. Fast and accurate short read alignment with Burrows-Wheeler transform. Bioinformatics. 2009;25:1754–1760. doi: 10.1093/bioinformatics/btp324. [DOI] [PMC free article] [PubMed] [Google Scholar]
- Li H, Handsaker B, Wysoker A, et al. The sequence alignment/map format and SAMtools. Bioinformatics. 2009;25:2078–2079. doi: 10.1093/bioinformatics/btp352. [DOI] [PMC free article] [PubMed] [Google Scholar]
- Luikart G, England P, Tallmon D, Jordan S, Taberlet P. The power and promise of population genomics: from genotyping to genome typing. Nature Reviews Genetics. 2003;4:981–994. doi: 10.1038/nrg1226. [DOI] [PubMed] [Google Scholar]
- Ma XF, Hall D, St Onge KR, Jansson S, Ingvarsson PK. Genetic differentiation, clinal variation and phenotypic associations with growth cessation across the Populus tremula photoperiodic pathway. Genetics. 2010;186:1033–1044. doi: 10.1534/genetics.110.120873. [DOI] [PMC free article] [PubMed] [Google Scholar]
- Mackay TFC, Richards S, Stone EA, et al. The Drosophila melanogaster genetic reference panel. Nature. 2012;482:173–178. doi: 10.1038/nature10811. [DOI] [PMC free article] [PubMed] [Google Scholar]
- Matzkin LM, Merritt TJS, Zhu C-T, Eanes WF. The structure and population genetics of the breakpoints associated With the cosmopolitan chromosomal inversion In(3R)Payne in Drosophila melanogaster. Genetics. 2005;170:1143–1152. doi: 10.1534/genetics.104.038810. [DOI] [PMC free article] [PubMed] [Google Scholar]
- Mayr E. Animal Species and Evolution. Cambridge, Massachusetts: Harvard University Press; 1963. [Google Scholar]
- Mery F, Belay AT, So AK, Sokolowski MB, Kawecki TJ. Natural polymorphism affecting learning and memory in Drosophila. Proceedings of the National Academy of Sciences USA. 2007;104:13051–13055. doi: 10.1073/pnas.0702923104. [DOI] [PMC free article] [PubMed] [Google Scholar]
- Mettler LE, Voelker RA, Mukai T. Inversion clines in populations of Drosophila melanogaster. Genetics. 1977;87:169–176. doi: 10.1093/genetics/87.1.169. [DOI] [PMC free article] [PubMed] [Google Scholar]
- Mitrovski P, Hoffmann AA. Postponed reproduction as an adaptation to winter conditions in Drosophila melanogaster: evidence for clinal variation under semi-natural conditions. Proceedings of the Royal Society of London B. 2001;268:2163–2168. doi: 10.1098/rspb.2001.1787. [DOI] [PMC free article] [PubMed] [Google Scholar]
- Miyashita N, Langley CH. Molecular and phenotypic variation of the white locus region in Drosophila melanogaster. Genetics. 1988;120:199–212. doi: 10.1093/genetics/120.1.199. [DOI] [PMC free article] [PubMed] [Google Scholar]
- Morris JZ, Hong A, Lilly MA, Lehmann R. twin, a CCR4 homolog, regulates cyclin poly(A) tail length to permit Drosophila oogenesis. Development. 2005;132:1165–1174. doi: 10.1242/dev.01672. [DOI] [PubMed] [Google Scholar]
- Nielsen R. Molecular signatures of natural selection. Annual Review of Genetics. 2005;39:197–218. doi: 10.1146/annurev.genet.39.073003.112420. [DOI] [PubMed] [Google Scholar]
- Nosil P, Funk DJ, Ortiz-Barrientos D. Divergent selection and heterogeneous genomic divergence. Molecular Ecology. 2009;18:375–402. doi: 10.1111/j.1365-294X.2008.03946.x. [DOI] [PubMed] [Google Scholar]
- Oakeshott JG, Gibson JB, Anderson PR, et al. Alcohol dehydrogenase and glycerol-3-phosphate dehydrogenase clines in Drosophila melanogaster on different continents. Evolution. 1982;36:86–96. doi: 10.1111/j.1558-5646.1982.tb05013.x. [DOI] [PubMed] [Google Scholar]
- Oldham S, Hafen E. Insulin/IGF and target of rapamycin signaling: a TOR de force in growth control. Trends in Cell Biology. 2003;13:79–85. doi: 10.1016/s0962-8924(02)00042-9. [DOI] [PubMed] [Google Scholar]
- Osborne KA, Robichon A, Burgess E, et al. Natural behavior polymorphism due to a cGMP-dependent protein kinase of Drosophila. Science. 1997;277:834–836. doi: 10.1126/science.277.5327.834. [DOI] [PubMed] [Google Scholar]
- Paaby AB, Schmidt PS. Dissecting the genetics of longevity in Drosophila melanogaster. Fly. 2009;3:1–10. doi: 10.4161/fly.3.1.7771. [DOI] [PubMed] [Google Scholar]
- Paaby AB, Blacket MJ, Hoffmann AA, Schmidt PS. Identification of a candidate adaptive polymorphism for Drosophila life history by parallel independent clines on two continents. Molecular Ecology. 2010;19:760–774. doi: 10.1111/j.1365-294X.2009.04508.x. [DOI] [PubMed] [Google Scholar]
- Quinn GP, Keough MJ. Experimental Design and Data Analysis for Biologists. Cambridge: Cambridge University Press; 2002. [Google Scholar]
- Rako L, Anderson AR, Sgro CM, Stocker AJ, Hoffmann AA. The association between inversion In(3R)Payne and clinally varying traits in Drosophila melanogaster. Genetica. 2006;128:373–384. doi: 10.1007/s10709-006-7375-7. [DOI] [PubMed] [Google Scholar]
- Rako L, Poulsen NA, Shirriffs J, Hoffmann AA. Clinal variation in post-winter male fertility retention; an adaptive overwintering strategy in Drosophila melanogaster. Journal of Evolutionary Biology. 2009;22:2438–2444. doi: 10.1111/j.1420-9101.2009.01852.x. [DOI] [PubMed] [Google Scholar]
- Robinson JT, Thorvaldsdóttir H, Winckler W, et al. Integrative genomics viewer. Nature Biotechnology. 2011;29:24–26. doi: 10.1038/nbt.1754. [DOI] [PMC free article] [PubMed] [Google Scholar]
- Rockman MV. The QTN program and the alleles that matter for evolution: all that's gold does not glitter. Evolution. 2012;66:1–17. doi: 10.1111/j.1558-5646.2011.01486.x. [DOI] [PMC free article] [PubMed] [Google Scholar]
- Sandrelli F, Tauber E, Pegoraro M, et al. A molecular basis for natural selection at the timeless locus in Drosophila melanogaster. Science. 2007;316:1898–1900. doi: 10.1126/science.1138426. [DOI] [PubMed] [Google Scholar]
- Sawyer LA, Hennessy JM, Peixoto AA, et al. Natural variation in a Drosophila clock gene and temperature compensation. Science. 1997;278:2117–2120. doi: 10.1126/science.278.5346.2117. [DOI] [PubMed] [Google Scholar]
- Schaeffer SW, Goetting-Minesky MP, Kovacevic M, et al. Evolutionary genomics of inversions in Drosophila pseudoobscura: evidence for epistasis. Proceedings of the National Academy of Sciences USA. 2003;100:8319–8324. doi: 10.1073/pnas.1432900100. [DOI] [PMC free article] [PubMed] [Google Scholar]
- Schlötterer C. A microsatellite-based multilocus screen for the identification of local selective sweeps. Genetics. 2002;160:753–763. doi: 10.1093/genetics/160.2.753. [DOI] [PMC free article] [PubMed] [Google Scholar]
- Schmidt PS. Evolution and mechanisms of insect reproductive diapause: a plastic and pleiotropic life history syndrome. In: Flatt T, Heyland A, editors. Mechanisms of Life History Evolution. Oxford: Oxford University Press; 2011. pp. 230–242. [Google Scholar]
- Schmidt PS, Paaby AB. Reproductive diapause and life-history clines in North American populations of Drosophila melanogaster. Evolution. 2008;62:1204–1215. doi: 10.1111/j.1558-5646.2008.00351.x. [DOI] [PubMed] [Google Scholar]
- Schmidt PS, Duvernell DD, Eanes WF. Adaptive evolution of a candidate gene for ageing in Drosophila. Proceedings of the National Academy of Sciences USA. 2000;98:10861–10865. doi: 10.1073/pnas.190338897. [DOI] [PMC free article] [PubMed] [Google Scholar]
- Schmidt P, Matzkin L, Ippolito M, Eanes W. Geographic variation in diapause incidence, life-history traits, and climatic adaptation in Drosophila melanogaster. Evolution. 2005a;59:1721–1732. [PubMed] [Google Scholar]
- Schmidt PS, Paaby AB, Heschel MS. Genetic variance for diapause expression and associated life histories in Drosophila melanogaster. Evolution. 2005b;59:2616–2625. [PubMed] [Google Scholar]
- Schmidt PS, Zhu CT, Das J, Batavia M, Yang L, Eanes WF. An amino acid polymorphism in the couch potato gene forms the basis for climatic adaptation in Drosophila melanogaster. Proceedings of the National Academy of Sciences USA. 2008;105:16207–16211. doi: 10.1073/pnas.0805485105. [DOI] [PMC free article] [PubMed] [Google Scholar]
- Sezgin E, Duvernell DD, Matzkin LM, et al. Single-locus latitudinal clines and their relationship to temperate adaptation in metabolic genes and derived Alleles in Drosophila melanogaster. Genetics. 2004;168:923–931. doi: 10.1534/genetics.104.027649. [DOI] [PMC free article] [PubMed] [Google Scholar]
- Shields DC, Sharp PM, Higgins DG, Wright F. "Silent" sites in Drosophila genes are not neutral: evidence of selection among synonymous codons. Molecular Biology and Evolution. 1988;5:704–716. doi: 10.1093/oxfordjournals.molbev.a040525. [DOI] [PubMed] [Google Scholar]
- Sinervo B, Svensson E. Correlational selection and the evolution of genetic architecture. Heredity. 2002;89:329–338. doi: 10.1038/sj.hdy.6800148. [DOI] [PubMed] [Google Scholar]
- Singh RS, Rhomberg LR. A comprehensive study of genic variation in natural populations of Drosophila melanogaster. II. Estimates of heterozygosity and patterns of geographic differentiation. Genetics. 1987;117:255–271. doi: 10.1093/genetics/117.2.255. [DOI] [PMC free article] [PubMed] [Google Scholar]
- Slatkin M. Spatial patterns in the distributions of polygenic characters. Journal of Theoretical Biology. 1978;70:213–228. doi: 10.1016/0022-5193(78)90348-x. [DOI] [PubMed] [Google Scholar]
- Stapley J, Reger J, Feulner PGD, et al. Adaptation genomics: the next generation. Trends in Ecology and Evolution. 2010;25:705–712. doi: 10.1016/j.tree.2010.09.002. [DOI] [PubMed] [Google Scholar]
- Stinchcombe JR, Hoekstra HE. Combining population genomics and quantitative genetics: finding the genes underlying ecologically important traits. Heredity. 2007;100:158–170. doi: 10.1038/sj.hdy.6800937. [DOI] [PubMed] [Google Scholar]
- Storey JD, Tibshirani R. Statistical significance for genomewide studies. Proceedings of the National Academy of Sciences USA. 2003;100:9440–9445. doi: 10.1073/pnas.1530509100. [DOI] [PMC free article] [PubMed] [Google Scholar]
- Tatar M, Bartke A, Antebi A. The endocrine regulation of aging by insulin-like signals. Science. 2003;299:1346–1351. doi: 10.1126/science.1081447. [DOI] [PubMed] [Google Scholar]
- Tauber E, Zordan M, Sandrelli F, et al. Natural selection favors a newly derived timeless allele in Drosophila melanogaster. Science. 2007;316:1895–1898. doi: 10.1126/science.1138412. [DOI] [PubMed] [Google Scholar]
- Teshima KM, Coop G, Przeworski M. How reliable are empirical genomic scans for selective sweeps? Genome Research. 2006;16:702–712. doi: 10.1101/gr.5105206. [DOI] [PMC free article] [PubMed] [Google Scholar]
- Turner TL, Levine MT, Eckert ML, Begun DJ. Genomic analysis of adaptive differentiation in Drosophila melanogaster. Genetics. 2008;179:455–473. doi: 10.1534/genetics.107.083659. [DOI] [PMC free article] [PubMed] [Google Scholar]
- Turner TL, Stewart AD, Fields AT, Rice WR, Tarone AM. Population-based resequencing of experimentally evolved populations reveals the genetic basis of body size variation in Drosophila melanogaster. PLoS Genetics. 2011;7:e1001336. doi: 10.1371/journal.pgen.1001336. [DOI] [PMC free article] [PubMed] [Google Scholar]
- Weeks AR, McKechnie SW, Hoffmann AA. Dissecting adaptive clinal variation: markers, inversion and stress/size associations in Drosophila melanogaster from a central field population. Ecology Letters. 2002;5:756–763. [Google Scholar]
- Whitlock MC. Evolutionary inference from QST. Molecular Ecology. 2008;17:1885–1896. doi: 10.1111/j.1365-294X.2008.03712.x. [DOI] [PubMed] [Google Scholar]
- Williams K, Busto M, Suster M, et al. Natural variation in Drosophila melanogaster diapause due to the insulin-regulated PI3-kinase. Proceedings of the National Academy of Sciences USA. 2006;103:15911–15915. doi: 10.1073/pnas.0604592103. [DOI] [PMC free article] [PubMed] [Google Scholar]
- Yagi Y, Ip YT. Helicase89B is a Mot1p/BTAF1 homologue that mediates an antimicrobial response in Drosophila. EMBO Reports. 2005;6:1088–1094. doi: 10.1038/sj.embor.7400542. [DOI] [PMC free article] [PubMed] [Google Scholar]
- Yukilevich R, Turner TL, Aoki F, Nuzhdin SV, True JR. Patterns and processes of genome-wide divergence between North American and African Drosophila melanogaster. Genetics. 2010;186:219–239. doi: 10.1534/genetics.110.117366. [DOI] [PMC free article] [PubMed] [Google Scholar]
Associated Data
This section collects any data citations, data availability statements, or supplementary materials included in this article.
Data Availability Statement
DNA sequences: http://www.ebi.ac.uk/ena/data/view/ERP001535