

Abstract
CONTEXT
Lower bone density in young amenorrheic athletes (AA) compared to eumenorrheic athletes (EA) and non-athletes may increase fracture risk during a critical time of bone accrual. Finite element analysis (FEA) is a unique tool to estimate bone strength in vivo, and the contribution of cortical microstructure to bone strength in young athletes is not well understood.
OBJECTIVE
We hypothesized that FEA-estimated stiffness and failure load are impaired in AA at the distal radius and tibia compared to EA and non-athletes despite weight-bearing exercise.
DESIGN AND SETTING
Cross-sectional study; Clinical Research Center
SUBJECTS
34 female endurance athletes involved in weight-bearing sports (17 AA, 17 EA) and 16 non-athletes (14-21y) of comparable age, maturity and BMI
OUTCOME MEASURES
We used HR-pQCT images to assess cortical microarchitecture and FEA to estimate bone stiffness and failure load.
RESULTS
Cortical perimeter, porosity and trabecular area at the weight-bearing tibia were greater in both groups of athletes than non-athletes, whereas the ratio (%) of cortical to total area was lowest in AA. Despite greater cortical porosity in EA, estimated tibial stiffness and failure load was higher than in non-athletes. However, this advantage was lost in AA. At the non-weight-bearing radius, failure load and stiffness were lower in AA than non-athletes. After controlling for lean mass and menarchal age, athletic status accounted for 5-9% of the variability in stiffness and failure load, menarchal age for 8-23%, and lean mass for 12-37%.
CONCLUSION
AA have lower FEA-estimated bone strength at the distal radius than non-athletes, and lose the advantage of weight-bearing exercise seen in EA at the distal tibia.
Keywords: athletes, adolescents, bone strength, stiffness, failure load
Introduction
Adolescence and young adulthood are critical times for bone acquisition [1], with nearly 90% of peak bone mass achieved by age 18 years [2]. Healthy athletes typically have bone mineral density (BMD) that is 5% to 30% greater than their sedentary counterparts [3, 4]. Maintenance of this elevated BMD could lead to a 50 to 80% fracture risk reduction [4-7]. However, poor nutritional status and impaired menstrual function can attenuate the beneficial effects of exercise [8, 9].
The female athlete triad of low energy availability, menstrual dysfunction and low bone mass is a common entity in young female endurance athletes, and up to 24% of adolescent athletes experience menstrual irregularities [10]. We have reported disordered eating patterns in up to 62% of teenage amenorrheic athletes (AA) [9], and lower BMD in AA compared to eumenorrheic athletes (EA) and non-athletic controls [11]. While measurement of BMD via dual-energy X-ray absorptiometry (DXA) is clinically useful to detect low bone mass, the microarchitecture of bone, as measured by high-resolution peripheral quantitative computed tomography (HR-pQCT), may be a better tool to distinguish healthy from impaired bone, with its ability to measure various cortical and trabecular properties [12]. Additionally, finite element analysis (FEA) applied to HR-pQCT images allows in vivo estimation of bone strength parameters, such as stiffness and failure load [12], that are associated with fracture risk [13-16] independent of bone density. For example, in one study of post-menopausal women, those who fractured had 13-17% lower stiffness at the radius and tibia than those without a history of fractures, despite similar DXA BMD results [17].
Data from FEA of HR-pQCT have been reported in studies of postmenopausal women, but these data are not available for young female athletes with amenorrhea compared with EA and non-athletes [18]. Additionally, the contribution of cortical parameters and porosity to strength parameters in this population is not known. Semi-automatic analysis of cortical bone microstructure in HR-pQCT images allows measurements of cortical area, thickness, porosity and tissue mineral density [19-21]. In older men, increased cortical porosity has been associated with lower bone strength and higher fracture risk [21, 22].
We recently reported differences in bone microarchitecture among adolescent AA, EA and non-athletes [23]. At the weight-bearing tibia, both groups of athletes had greater total and trabecular area than non-athletes, however, trabecular number was lower and trabecular separation higher in AA compared with the other two groups. At the non-weight-bearing radius, trabecular bone density was lower in AA than non-athletes. While our findings demonstrate a more impaired state in AA, microachitecture data alone (unlike FEA) do not specifically reflect the structural biomechanical properties of bone and its ability to resist deformation and fracture.
The purpose of our study was to compare cortical microarchitecture and bone strength parameters, including bone stiffness and failure load, in AA, EA, and non-athletes using HR-pQCT-derived cortical analysis and micro-finite element analysis. We predicted that weight-bearing and non-weight-bearing bones of AA would be less stiff and have lower failure loads than those of EA and non-athletes, despite increased weight-bearing exercise and normal body weight.
Subjects and Methods
Subject Selection
We studied 50 girls and young women 14–21 years old for this study (17 AA, 17 EA, and 16 non-athletes). Trabecular bone density and microarchitecture, but not data from cortical and finite element analysis, have been previously reported for 48 subjects [23]. Subjects were recruited through medical clinics and advertising in local newspapers and colleges. Inclusion criteria included a bone age of at least 15 years and body mass index (BMI) between the 10th and 90th percentiles. Amenorrhea (for AA) was defined as the absence of menses for at least 3 months within a period of oligomenorrhea (cycle length >6 weeks) for at least 6 months, or the absence of menarche at age 16 years or older. Eumenorrhea (for EA and non-athletes) was defined as at least nine menses (cycle length 21–35 days) in the preceding year. Median duration of oligoamenorrhea in AA was 30 months.
Athlete enrollment was limited to endurance athletes participating in ≥ 4 hours of aerobic weight-bearing training of the legs or ≥ 20 miles of running weekly for ≥ 6 preceding months to minimize variability from type of exercise. These criteria were modified for a young population based on published data in adult athletes after consultation with exercise physiologists [24]. Cyclists and swimmers were excluded because their training does not include true weight-bearing. Rowers and gymnasts were excluded given that these activities differ in the nature of weight-bearing and impact [25-27]. Nonathletic controls were eligible if weight-bearing exercise was ≤ 2 hours/week and if they did not participate in organized team sports. Exclusion criteria included the use of medications affecting bone metabolism and conditions other than endurance training that may cause amenorrhea (such as premature ovarian failure, thyroid dysfunction, hyperprolactinemia and polycystic ovarian syndrome). We have previously reported very low estradiol levels in amenorrheic athletes, supporting their hypogonadal status [23]. The study was approved by the Institutional Review Board of Partners HealthCare. Informed consent was obtained from subjects ≥18 years and parents of subjects < 18 years. Informed assent was obtained from subjects <18 years.
Experimental Protocol
Subjects underwent a complete history and physical examination. Height was measured on a wall-mounted stadiometer as the average of three measurements, and weight on an electronic scale. BMI was calculated as weight (in kilograms) divided by height (in meters) squared. A detailed history of exercise activity was obtained to confirm that endurance criteria were met. Screening labs were drawn to rule out conditions other than exercise activity that may cause amenorrhea. Subjects had a hand radiograph to assess bone age. We used DXA (Hologic 4500; Hologic Inc., Waltham, MA) to assess lean mass, fat mass, and spine and hip BMD. Spine bone mineral apparent density (BMAD) was calculated using published methods [28]. Subjects also completed the Bouchard 3-day activity record over two weekdays and one weekend day to quantify activity levels in athletes and non-athletes and as a check for athletic inclusion and exclusion criteria. This is a validated method to assess 24-h energy expenditure [29], and serves as an index of physical activity.
High-resolution peripheral quantitative computed tomography
For subjects meeting inclusion criteria, bone microarchitecture at the distal radius and tibia (nondominant) was assessed using HR-pQCT (XtremeCT; Scanco Medical AG, Bassersdorf, Switzerland), as previously described [23]. As trabecular microarchitectural parameters have been previously reported [23], we only report trabecular bone density in this paper. Scans were acquired at the distal radius and tibia according to manufacturer’s protocols. In brief, a 2D scout view was acquired and the first CT slice was acquired 9.5 mm and 22.5 mm from a reference line that is manually placed at the endplate of the radius and tibia, respectively [12]. All subjects were scanned using 60 kVp effective energy and 100 ms integration time to acquire 110 CT slices (9.02 mm) with an isotropic voxel size of 82 μm3. The precision for short-term repeated measurements is 0.7–1.5% for bone densities and 2.5–4.4% for trabecular and cortical microarchitecture. Effective radiation dose was 0.027 mSv per subject.
Cortical Microstructure and Micro-Finite Element Analysis
In addition to the standard clinical evaluation protocol provided by the HR-pQCT manufacturer, we also performed detailed cortical bone analysis by a semi-automated segmentation technique as previously described [19-21, 30]. This technique involves three stages: (a) segmentation of cortical bone compartment by an auto-contouring process generating periosteal and endosteal contours; (b) cortical porosity segmentation; and (c) generation of a refined cortical mask by combining segmented cortical bone and porosity images. Automatically generated contours were inspected to ensure proper placement of contours. When the contour visually deviated from the apparent periosteal or endosteal margin, manual adjustments were performed to the affected region.
Following image segmentation, measures of cortical bone density, geometry, and microarchitecture were obtained. Percent cortical area was calculated by dividing cortical area by total area and multiplying by 100. Cortical tissue mineral density (mg/cm3) was calculated as the mean mineralization of the segmented cortical bone voxels after surface partial volume suppression. Cortical bone mineral density (mg/cm3) consists of mean mineralization volume of the cortical compartment volume of interest, yielding apparent density of the cortex including all pore space. A direct 3D measure of endosteal-periosteal distance was used to provide apparent cortical thickness (mm), disregarding intracortical pores. The number of individual pores was counted using component labeling, and average intracortical pore volume (mm3) calculated as the total volume of pores divided by the pore number. Cortical porosity (%) was calculated as the volume of intracortical pore space normalized by the sum of the pore and cortical bone volume. Cortical parameters reported in this manuscript are derived from this detailed cortical analysis and have not been previously reported.
We used the 3D HR-pQCT images to perform linear micro-finite element analysis and calculate apparent biomechanical properties under uniaxial compression, as previously described [14, 20, 31-34]. In particular, following image segmentation to identify bone from non-bone voxels, each HR-pQCT bone voxel was converted to a hexahedral finite element having linear-elastic and isotropic material behavior, with a Young’s modulus and Poisson’s ratio of 10 GPa and 0.3, respectively. Boundary conditions simulated frictionless uniaxial compression of the region of interest. Failure load (kN) was estimated by scaling the resultant load from a 1% apparent compressive strain until 2% of all elements reached an effective strain > 7000 μstrain, per previously published methods [35]. FEA-derived estimates of failure load using these methods are strongly correlated (r2 = 0.75) with experimentally measured failure loads that produce Colles’ fractures in human cadaveric radii [35]. We also calculated the proportion of load carried by the cortical and trabecular compartments (%) at the distal and proximal ends of the region of interest. All HR-pQCT data were acquired on a single instrument by one operator, who performed standard evaluations (periosteal contouring). All finite element analyses (endosteal contouring) were also performed by one study investigator blinded to study groups.
Biochemical analysis
We used a chemiluminescent immunoassay to measure fasting 25-hydroxyvitamin D (DiaSorin, Stillwater, MN; sensitivity 4 ng/ml; intraassay coefficient of variation 2.9–5.5%). P1NP was assessed using a RIA (Orion Diagnostics, Espoo, Finland; lower limit of detection 0.7 mcg/L, intra-assay CV 3.5-5.3%, inter-assay CV 3.6-5.4%), and CTX using an IRMA (Immunodiagnostics Systems, Fountain Hills, AZ; lower limit of detection 0.02 mcg/L, intra-assay CV 5.2-6.8%, inter-assay CV 5.6-7.4 %).
Statistical Methods
We used JMP (version 9; SAS Institute, Inc., Cary, NC) for all analyses and report data as means ± sd. For 3-group comparisons, we performed an overall ANOVA, followed by a Tukey-Kramer analysis to assess between-group differences while controlling for multiple comparisons. Significance was defined as a 2-tailed p < 0.05. We used Pearson correlations to assess associations of cortical microarchitecture measures, trabecular bone density, bone age, body composition and menarchal age with strength parameters. We also used multivariate analysis to establish models to derive strength parameters at the distal radius and tibia using cortical parameters and trabecular bone density. We next performed stepwise regression modeling with subject group, lean mass and menarchal age entered into the model to determine independent predictors of strength parameters (p <0.10 to enter and leave model).
Results
Clinical Characteristics of study subjects are summarized in Table 1.
Table 1.
Clinical Characteristics of Amenorrheic Athletes, Eumenorrheic Athletes and Non-Athletic Controls
| Amenorrheic Athletes | Eumenorrheic Athletes | Non-athletes | p | |
|---|---|---|---|---|
| n = 17 | n = 17 | n = 16 | ||
| Chronological age (years) | 19.8 ± 1.7 | 18.5 ± 1.6 | 19.3 ± 1.2 | 0.07 |
| Bone age (years) | 17.6 ± 0.7 | 17.5 ± 0.9 | 17.7 ± 0.9 | NS |
| Age of menarche (years) | 14.2 ± 2.4 | 12.9 ± 1.2 | 12.1 ± 1.7 | 0.01a |
| Height (cm) | 166.3 ± 5.6 | 164.8 ± 6.7 | 163.2 ± 6.2 | NS |
| Weight (kg) | 57.5 ± 7.4 | 60.2 ± 9.1 | 57.0 ± 6.1 | NS |
| Body mass index (kg/cm2) | 20.8 ± 2.2 | 22.1 ± 2.2 | 21.5 ± 2.4 | NS |
| Total fat mass (kg) | 12.71 ± 3.55 | 14.28 ± 3.86 | 14.70 ± 3.90 | NS |
| Total lean mass (kg) | 44.68 ± 5.68 | 45.59 ± 6.93 | 40.63 ± 3.23 | 0.03b |
| % Body Fat | 21.2 ± 4.4 | 22.8 ± 4.0 | 25.4 ± 4.8 | 0.03a |
| Hip bone mineral density Z-score | -0.43 ± 0.94 | 0.70 ± 1.04 | -0.28 ± 0.70 | 0.002b,c |
| Lumbar spine bone mineral density Z-score | -1.11 ± 1.28 | 0.10 ± 0.85 | 0.17 ± 1.21 | 0.003a,c |
| Lumbar spine bone mineral apparent density (g/cm3) | 0.134 ± 0.016 | 0.148 ± 0.014 | 0.155 ± 0.020 | 0.002a,c |
Amenorrheic athletes vs. non-athletes p<0.05
Eumenorrheic athletes vs. non-athletes p<0.05
Amenorrheic athletes vs. Eumenorrheic athletes p<0.05
Levels of P1NP did not differ between groups. However, CTX was higher in both groups of athletes compared with non-athletes (1101±343, 1191±394 and 872±258 mcg/L; p=0.03).
Cortical Microstructure and Finite Element Analysis
Cortical and finite element analysis comparisons were striking at the weight-bearing distal tibia (Table 2). Total cross-sectional area was higher in AA and EA than non-athletes, as was cortical perimeter. However, AA had a lower cortical/total area ratio and lower cortical thickness. Cortical porosity was higher in both groups of athletes than non-athletes, and AA specifically had greater average pore diameter compared with non-athletes. Cortical tissue mineral density did not differ among groups.
Table 2.
Extended Cortical Analysis in Amenorrheic Athletes, Eumenorrheic Athletes and Non-athletes
| Amenorrheic Athletes | Eumenorrheic Athletes | Non-athletes | p | |
|---|---|---|---|---|
| n=17 | n=17 | n=16 | ||
| Distal Tibia | ||||
| Cortical area (mm2) | 100.1 ± 17.4 | 111.9 ± 13.8 | 106.9 ± 16.7 | NS |
| Trabecular area (mm2) | 601.1 ± 102.4 | 589.1 ± 101.0 | 494.4 ± 118.7 | 0.01a,b |
| Cortical area/Total area (%) | 14.6 ± 3.2 | 16.4 ± 3.0 | 18.6 ± 4.9 | 0.01a |
| Cortical thickness (mm) | 1.05 ± 0.20 | 1.17 ± 0.18 | 1.22 ± 0.25 | 0.06 |
| Cortical perimeter (mm) | 104.0 ± 7.8 | 103.9 ± 8.8 | 96.0 ± 9.7 | 0.02a,b |
| Cortical porosity (%) | 1.40 ± 0.52 | 1.44 ± 0.71 | 0.92 ± 0.37 | 0.01a,b |
| Cortical pore diameter (um) | 0.16 ± 0.02 | 0.15 ± 0.01 | 0.14 ± 0.01 | 0.04a |
| Cortical Tissue BMD (mgHA/cm3) | 969.9 ± 30.4 | 974.4 ± 34.8 | 989.2 ± 41.2 | NS |
| Cortical BMD (mgHA/cm3) | 951.0 ± 30.9 | 955.2 ± 40.4 | 976.1 ± 42.9 | NS |
| Trabecular BMD (mgHA/cm3) | 193.1 ± 24.2 | 212.3 ± 29.8 | 205.9 ± 33.2 | NS |
| % Load carried by cortical bone distally | 38.0 ± 7.4 | 39.6 ± 5.1 | 44.3 ± 6.8 | 0.02a |
| % Load carried by cortical bone proximally | 58.9 ± 7.4 | 60.2 ± 5.1 | 65.3 ± 6.9 | 0.02a |
| Distal Radius | ||||
| Cortical area (mm2) | 50.3 ± 11.9 | 52.7 ± 8.5 | 57.5 ± 10.5 | NS |
| Trabecular area (mm2) | 218.0 ± 52.7 | 234.9 ± 45.1 | 203.4 ± 46.0 | NS |
| Cortical area/Total area (%) | 19.4 ± 5.1 | 18.8 ± 3.8 | 22.8 ± 5.0 | 0.04b |
| Cortical thickness (mm) | 0.81 ± 0.82 | 0.82 ± 0.14 | 0.94 ± 0.18 | 0.07 |
| Cortical perimeter (mm) | 70.4 ± 7.2 | 73.2 ± 7.2 | 69.9 ± 6.5 | NS |
| Cortical porosity (%) | 0.71 ± 0.62 | 0.70 ± 0.45 | 0.63 ± 0.44 | NS |
| Cortical pore diameter (um) | 0.14 ± 0.01 | 0.14 ± 0.01 | 0.14 ± 0.01 | NS |
| Cortical tissue mineral density (mgHA/cm3) | 942.4 ± 39.2 | 921.3 ± 46.9 | 946.4 ± 56.1 | NS |
| Cortical BMD (mgHA/cm3) | 932.7 ± 44.3 | 911.5 ± 50.2 | 937.6 ± 58.9 | NS |
| Trabecular BMD (mgHA/cm3) | 158.3 ± 25.8 | 178.7 ± 30.5 | 188.3 ± 35.0 | 0.02a |
| % Load carried by cortical bone distally | 47.3 ± 8.6 | 42.3 ± 7.8 | 48.0 ± 7.6 | 0.09 |
| % Load carried by cortical bone proximally | 79.3 ± 8.6 | 75.9 ± 6.4 | 78.5 ± 5.4 | NS |
Amenorrheic athletes vs. non-athletes p<0.05
Eumenorrheic athletes vs. non-athletes p<0.05
Amenorrheic athletes vs. Eumenorrheic athletes p<0.05
FEA demonstrated that EA had greater estimated stiffness (p=0.009) and a higher estimated failure load (p=0.009) than non-athletes at the tibia (Figure 1). There was no significant difference in estimates of tibial stiffness and failure load between AA and non-athletes (p=0.49 and 0.52) nor AA and EA (p=0.13 and 0.12). In addition, the percent load carried by cortical (versus trabecular) bone both distally and proximally at the tibia was lower in AA than in non-athletes (p=0.02 at both locations). There were no significant differences in percent load carried between AA and EA nor EA and non-athletic controls (Table 2).
Figure 1.
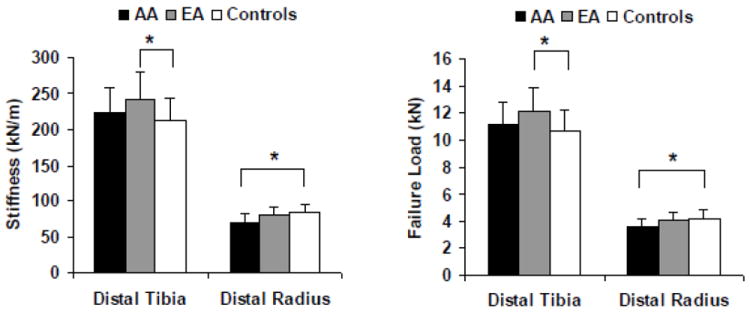
Stiffness (left) and failure load (right) in amenorrheic athletes (AA) (black bars), eumenorrheic athletes (EA) (gray bars) and non-athletic controls (white bars) at the distal tibia and distal radius. Stiffness and failure load at the distal tihia were higher in EA (but not AA) compared with controls. Stiffness and failure load at the distal radius were lower in AA (but not EA) compared with controls. * p<0.05
Differences among groups for cortical microstructure and FEA at the non-weight-bearing distal radius are also described in Table 2. Although there was no difference among groups for total cross-sectional area, the ratio of cortical/total area was lower in EA versus non-athletes, and cortical thickness trended lower in both groups of athletes. FEA estimates of bone stiffness and failure load were lower in AA compared to non-athletes (Figure 1) (p=0.04 and p=0.048 respectively), but there were no significant differences between AA and EA (p=0.16 and 0.17), nor EA and non-athletes (p=0.77 and p=0.81). Figure 2 shows a 3D rendering of von Mises stress from representative μFEA analysis of the distal radius from an AA, EA and non-athlete.
Figure 2.
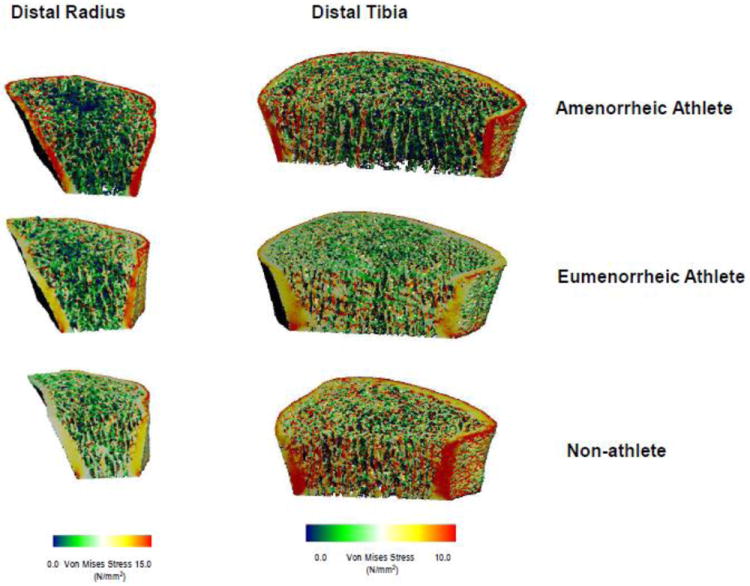
3D rendering of von Mises stress from representative μFEA analysis of the distal radius (left) and distal tibia (right) from an amenorrheic athlete, eumenorrheic athlete and non-athletic control. Each bone was subjected to a uniform axial compression of 1000 N for the distal radius and 2000 N for the distal tibia.
Correlations of Estimated Strength Parameters with Cortical Parameters and Trabecular Bone Density
Table 3 shows associations of FEA-estimated strength parameters with cortical parameters and trabecular bone density. At both the radius and tibia, cortical area and perimeter were correlated with FEA estimates of stiffness and failure load. Cortical BMD, weakly predicted estimated stiffness at the radius only. Trabecular BMD (from HRpCT) predicted estimated stiffness and failure load at both sites [in contrast to trabecular area, which weakly predicted estimated stiffness and failure load at the tibia only (data not shown)].
Table 3.
Associations of strength parameters with cortical and bone density parameters for the distal tibia and distal radius
| Distal Tibia | Stiffness | Failure Load | Distal Radius | Stiffness | Failure Load | ||||
|---|---|---|---|---|---|---|---|---|---|
| r | p | r | p | r | p | r | p | ||
| Cortical area | 0.58 | <0.0001 | 0.59 | <0.0001 | Cortical area | 0.75 | <0.0001 | 0.74 | <0.0001 |
| Trabecular area | 0.31 | 0.03 | 0.36 | 0.01 | Trabecular area | - | - | - | - |
| % Cortical area | - | - | - | - | % Cortical area | 0.37 | 0.009 | 0.33 | 0.02 |
| Cortical thickness | 0.29 | 0.04 | 0.27 | 0.06 | Cortical thickness | 0.56 | <0.0001 | 0.53 | <0.0001 |
| Cortical perimeter | 0.38 | 0.007 | 0.42 | 0.002 | Cortical perimeter | 0.29 | 0.04 | 0.34 | 0.02 |
| Cortical BMD | - | - | - | - | Cortical BMD | 0.29 | 0.046 | 0.25 | 0.09 |
| Trabecular BMD | 0.54 | <0.0001 | 0.51 | 0.0002 | Trabecular BMD | 0.53 | <0.0001 | 0.50 | 0.0002 |
Only associations with a p value of <0.1 are reported
Cortical porosity was not associated with strength parameters at either site
Multivariate Models for Strength Parameters (using Cortical Parameters and Trabecular Density)
The following prediction models using cortical parameters and trabecular bone density were derived for FEA-estimated strength parameters using multivariate modeling:
Distal Tibia: Stiffness= -228.796 + 2.177*Cortical perimeter (mm) + 0.849*Cortical area (mm2) + 0.707*Trabecular BMD (mgHA/cm3)
[R2=0.87; p<0.0001 for entire model and for each covariate]
Distal Tibia: Failure load= -11.122 + 0.111*Cortical perimeter (mm) + 0.043*Cortical area (mm2) + 0.033*Trabecular BMD (mgHA/cm3)
[R2=0.89; p<0.0001 for entire model and for each covariate]
Distal Radius: Stiffness= -128.252 + 0.958*Cortical perimeter (mm) + 0.781*Cortical area (mm2) + 0.059*Cortical BMD (mgHA/cm3) + 0.236*Trabecular BMD (mgHA/cm3)
[R2=0.87; p<0.0001 for entire model and for each covariate except cortical BMD (p=0.02)].
Distal Radius: Failure load= -6.053 + 0.050*Cortical perimeter (mm) + 0.039*Cortical area (mm2) + 0.003*Cortical BMD (mgHA/cm3) + 0.011*Trabecular BMD (mgHA/cm3)
[R2=0.87; p<0.0001 for entire model and for each covariate except cortical BMD (p=0.04)]
Regression Models for Strength Parameters (Using Athletic and Menstrual Status, Menarchal Age and Lean Mass)
On correlation analysis, lean mass was associated positively with FEA-estimated strength parameters (stiffness and failure load) at the distal tibia (r=0.57 and 0.60, p<0.0001 for both) and distal radius (r=0.34 and 0.36, p=0.02 and 0.009). Menarchal age correlated inversely with stiffness and failure load at the distal radius (r=-0.33 and -0.35, p=0.03 and 0.01).
Table 4 demonstrates regression modeling with subject group (AA, EA or non-athletes), lean mass and age at menarche entered into the model. At the distal tibia, all three were independently associated with stiffness and failure load (contributing to 47% and 50% of the variability respectively), and stiffness and failure load were lower in AA and non-athletes compared with EA. At the distal radius, subject grouping, lean mass and age at menarche again predicted both stiffness and failure load (contributing to 43% and 44% of the variability). Stiffness and failure load were lower in AA versus EA and non-athletes after controlling for other covariates, and trended lower in EA than non-athletes.
Table 4.
Stepwise regression model with subject group, age of menarche and lean mass entered into the model
| Parameter estimate | F ratio | P value | R2 | |
|---|---|---|---|---|
| Distal Tibia Stiffness | ||||
| Intercept | 137.791 | |||
| Subject grouping (AA and C versus EA) | -7.882 | 4.53 | 0.04 | 0.05 |
| Age of menarche (y) | -4.118 | 4.8 | 0.03 | 0.08 |
| Lean mass (kg) | 3.295 | 26.1 | <0.0001 | 0.34 |
| Failure Load | ||||
| Intercept | 6.691 | |||
| Subject grouping (AA and C versus EA) | -0.373 | 4.6 | 0.04 | 0.05 |
| Age of menarche (y) | -0.197 | 5.0 | 0.03 | 0.08 |
| Lean mass (kg) | 0.167 | 30.3 | <0.0001 | 0.37 |
|
| ||||
| Distal Radius Stiffness | ||||
| Intercept | 54.006 | |||
| Subject grouping (AA vs. EA and C) | -3.628 | 3.3 | 0.04 | 0.09 |
| Subject grouping (EA versus C) | -4.157 | 3.7 | 0.06 | |
| Age of menarche (y) | -3.158 | 10.6 | 0.002 | 0.12 |
| Lean mass (kg) | 1.463 | 21.1 | <0.0001 | 0.22 |
| Failure Load | ||||
| Intercept | 2.567 | |||
| Subject grouping (AA vs. EA and C) | -0.182 | 3.4 | 0.04 | 0.09 |
| Subject grouping (EA versus C) | -0.207 | 3.8 | 0.06 | |
| Age of menarche (y) | -0.148 | 9.6 | 0.003 | 0.23 |
| Lean mass (kg) | 0.075 | 22.8 | <0.0001 | 0.12 |
AA: amenorrheic athletes; EA: eumenorrheic athletes; C: controls (non-athletes)
Discussion
Prior work in older subjects has demonstrated that lower stiffness and failure load as assessed by FEA [17], and higher cortical porosity as assessed by extended cortical analysis [21, 22], indicate reduced bone strength and an increased risk of fractures [17]. We report lower FEA-estimates of stiffness and failure load at the distal non-weight-bearing radius in amenorrheic athletes compared with non-athletes, and these data suggest that at non-weight-bearing sites, hypogonadism may lead to reductions in bone strength. We also report that at weight-bearing sites, eumenorrheic athletes have greater stiffness and failure load than non-athletes. However, these beneficial effects of weight-bearing exercise on estimated bone strength might be lost in amenorrheic athletes. These data suggest that weight bearing activity in adolescents with normal gonadal function likely leads to an increase in bone strength. However, this advantage at weight bearing sites might be lost in hypogonadal athletes. As expected, lean mass is a positive determinant, whereas age at menarche is an inverse determinant of FEA-estimated strength parameters. However, hypogonadism in athletes might remain an important determinant of estimated strength parameters at non-weight-bearing bone even after controlling for these covariates. This is the first report, to our knowledge, of differences in FEA in athletes compared to healthy controls, when stratified by menstrual status.
Later age of menarche and lower percent body fat in AA versus non-athletes in this study are likely the result of intensive training in AA and varying degrees of dietary restraint. This is consistent with prior work by Warren et al., who found a later age of menarche, greater lean mass, and higher scores on the Eating Attitudes Test in amenorrheic dancers compared to eumenorreic non-dancers [36]. Higher lean mass and hip BMD in EA compared to non-athletes illustrates the positive impact of exercise on muscle mass and of site-specific mechanical loading forces on bone density [37, 38]. The beneficial effect of weight-bearing exercise on hip BMD was lost in AA, supporting the importance of a normal hormonal milieu to maximize benefits of weight-bearing exercise on BMD. At the lumbar spine, where much less weight-bearing occurs, AA had lower BMD than both groups, as measured by Z-scores and BMAD.
Increased total cross-sectional area and trabecular area observed in athletes at the tibia are likely a consequence of periosteal expansion due to increased levels of weight-bearing exercise. Cortical perimeter expands and trabecular area increases to a greater extent than cortical area. We speculate that lower cortical thickness and percent cortical area in AA than in non-athletes is a consequence of increased endocortical expansion (i.e. resorption) from inadequate estradiol, given that estradiol typically inhibits endosteal resorption. However, levels of CTX, were higher in both groups of athletes compared with non-athletes. Data from the cortical microstructure analysis are consistent with our findings from trabecular microarchitectural analysis [23].
In this study, we observed greater cortical porosity in both groups of athletes compared with non-athletes at the distal tibia, perhaps indicating greater modeling and/or remodeling activity in the athletes. In men aged 40-70 years old, increased cortical porosity has been associated with lower bone strength and a higher risk of fractures [21, 22]. However, when FEA was used to simulate axial compression loading, despite greater cortical porosity in EA, we observed greater stiffness and a higher failure load at the tibia in these subjects compared with non-athletes, indicating increased bone strength. It is important to recognize that although cortical porosity was greater in athletes than non-athletes, the absolute value of cortical porosity was low, and certainly lower than reported in other studies [22, 39, 40]. Studies suggest that optimal fluid flow within canaliculae and lacunae in the bony cortex is essential for mechanochemical signal transduction [41, 42], and hydrostatic stress gradients within bone, secondary to external dynamic stresses, may be required to initiate positive bone adaptation [41]. Mechanical loading enhances molecular transport within cortical bone of the rat tibia [43] and ulna [44]. Importantly, when vascular pores, fluid flow, and element mechanics are used in FEA computational models of bone, vascular pores within the cortex of various models significantly alter intracortical pressure and fluid flow [45, 46]. Thus, while optimal cortical porosity and pore diameter have yet to be determined, enhanced porosity in athletes compared with non-athletes may enable increased nutrient supply and optimal cell signaling to withstand bone stresses, eventually leading to periosteal apposition. Interestingly, although AA (like EA) had increased cortical porosity at the distal tibia compared with non-athletes, stiffness and failure load did not differ from non-athletes. The beneficial effects of weight bearing on estimated strength parameters seen in EA were thus lost in AA. This may be consequent to alterations in other factors that impact bone strength, such as percent cortical area and thickness, both of which were lowest in AA.
At the non-weight-bearing distal radius, AA had significantly lower stiffness and failure load than non-athletes, similar to findings at the radius in women with anorexia nervosa [47]. This is likely because the partially protective effect of exercise on bone strength is not seen at non-weight-bearing sites in these hypogonadal adolescents and young women.
Using similar techniques of HR-pQCT-derived FEA, Schnackenburg, et al. studied adult female athletes ages 18-45 years old who had sustained lower extremity stress fractures and compared their bone density and microarchitecture to age- and sport-matched controls [48]. In their study, the load carried by the cortex at the proximally scanned site was greater in the stress fracture group [48]. We found that percent load carried by cortical bone proximally and distally was lower in AA versus non-athletes. While Schnackenburg, et al. did not stratify by menstrual status, one may speculate that those with stress fractures have a similar load distribution to AA, as AA are at higher risk for stress fracture [48, 49]. Further work is needed to help explain this difference.
Cortical area, cortical perimeter, cortical thickness, and trabecular BMD all correlated with stiffness and failure load at the distal tibia and radius. While cortical area was the strongest predictor, strong associations of cortical perimeter with stiffness and failure load support the theory that an increase in bone perimeter in athletes likely enhances moment of inertia and decreases microdamage from strain [23]. It is unclear why cortical porosity was not associated with FEA-estimated strength parameters at either site, though the location of the porosity was not quantified, and pores towards the endocortical surface would have less of a detrimental mechanical effect than pores towards the periosteal surface. Increased porosity in athletes may reflect enhanced fluid flow systems that are beneficial to bone by inducing bone modeling in contrast to post-menopausal women, in whom increased porosity likely reflects increased bone resorption.
In our prediction models, cortical perimeter, cortical area, cortical BMD, and trabecular BMD together predicted 87% of both stiffness and failure load at the radius. Similar results were observed at the tibia, except that cortical BMD was not a significant determinant at that site. The other three covariates predicted 87% of stiffness and 89% of failure load at the tibia. That cortical and trabecular BMD are not the strongest predictors of stiffness and failure load supports prior work in postmenopausal women with ankle fractures. Compared to post-menopausal women who had similar DXA BMD results, those who fractured had 13-17% lower stiffness at the radius and tibia [17]. Other studies have similarly reported that estimated strength parameters are strong predictors of fracture risk [14, 21, 34, 50].
On stepwise regression modeling, subject grouping, age of menarche, and lean mass all predicted FEA-estimated stiffness and failure load at the tibia and radius. Even after controlling for lean mass and age at menarche, at the distal tibia, AA and non-athletes had lower stiffness and failure load than EA. At the radius, AA had lower estimated strength measures than EA and non-athletes. Because the greatest increases in bone accrual occur during puberty [51-53], encouraging weight-bearing exercise involving dynamic loading while building lean mass is important during adolescence. Our results emphasize the importance of normal menarchal age and cycle maintenance in optimizing bone accrual and strength.
Limitations of our study include its cross-sectional nature as associations do not prove causation. We thus look forward to examining prospective data to better explain interactions of menstrual irregularity and exercise on bone. Additionally, we only included athletes involved in endurance weight-bearing activities of the legs in this study. Having additional groups with other types of weight-bearing activity (resistance versus endurance training) at additional locations (e.g. rowing with its effects on the spine) may help clarify the associations we have found. Furthermore, the HR-pQCT images, while providing novel insights into bone microarchitecture, are not of sufficient resolution to identify small cortical pores that may have negatively impacted bone strength. In addition, our micro-finite element analyses estimated bone strength for a relatively small region (~ 9 mm in length) of the radius and tibia, and exercise and gonadal steroids could certainly have influenced other areas of bone not included in our measurement site. Further, the finite element analyses assumed that bone tissue has a single material property and thus did not account for spatial variation in elastic modulus that may have differed among groups. Future studies could address this by assigning material properties according to the measured tissue mineral density.
Strengths of the study include our specific criteria for AA, EA, and nonathletes. While our group of athletes was not robust in its diversity of activity, our strict criteria regarding weight-bearing endurance exercise of the legs minimizes variability of exercise forces on upper and lower extremities. We used a narrow age range, allowing the groups to be similar in both chronological and bone age with minimal deviation.
In conclusion, FEA-modeling suggests that athletic activity is associated with improved FEA estimated strength parameters, namely greater stiffness and failure load, at the weight-bearing tibia, but this benefit seems to be lost in amenorrheic (and thus hypogonadal) athletes. Amenorrhea may be even more detrimental to bone at the non-weight-bearing radius, where strength parameters are impaired in amenorrheic athletes compared with even nonathletes. Prospective studies are necessary to determine the best predictors of strength parameters and fracture risk in athletes.
Highlights.
Finite element analysis allows estimation of bone stiffness and failure load
Bone strength estimates were assessed in young, weight-bearing endurance athletes
Amenorrheic athletes (AA) have lower bone strength at the radius than non-athletes
Eumenorrheic athletes have higher bone strength at the tibia than non-athletes
In AA, loss of strength at the radius is attenuated at the weight-bearing tibia
Acknowledgments
Study design: MM and AK. Study conduct: KEA, GG, APT, LP, DBH, MB, MM. Data collection: KEA, MP, GG, APT, LP, DBH, MB, MM. Data analysis: KEA and MM. Data interpretation: KEA, MP, MB, AK, MM. Drafting manuscript: KEA, MP, MB, AK, MM. Revising manuscript content: KEA, MP, GG, APT, LP, DBH, MB, AK, MM. Approving final version of manuscript: KEA, MP, GG, APT, LP, DBH, MB, AK, MM. MM takes responsibility for the integrity of the data analysis.
We would like to thank Ellen Anderson, Head of the Bionutrition Core, and the dieticians and skilled nurses of the Clinical Research Center at Massachusetts General Hospital for their help with the study protocol. We would also like to thank our study participants without whom this study would not have been possible
This study was supported by NIH grants 1 UL1 RR025758-01 and 1 R01 HD060827-01A1
Footnotes
All authors state that they have no conflicts of interest.
Publisher's Disclaimer: This is a PDF file of an unedited manuscript that has been accepted for publication. As a service to our customers we are providing this early version of the manuscript. The manuscript will undergo copyediting, typesetting, and review of the resulting proof before it is published in its final citable form. Please note that during the production process errors may be discovered which could affect the content, and all legal disclaimers that apply to the journal pertain.
Bibliography
- 1.Harel Z, Gold M, Cromer B, Bruner A, Stager M, Bachrach L, Wolter K, Reid C, Hertweck P, Nelson A, Nelson D, Coupey S, Johnson C, Burkman R, Bone H. Bone mineral density in postmenarchal adolescent girls in the United States: associated biopsychosocial variables and bone turnover markers. J Adolesc Health. 2007;40:44–53. doi: 10.1016/j.jadohealth.2006.08.013. [DOI] [PubMed] [Google Scholar]
- 2.Whiting SJ, Vatanparast H, Baxter-Jones A, Faulkner RA, Mirwald R, Bailey DA. Factors that affect bone mineral accrual in the adolescent growth spurt. J Nutr. 2004;134:696S–700S. doi: 10.1093/jn/134.3.696S. [DOI] [PubMed] [Google Scholar]
- 3.Nichols DL, Bonnick SL, Sanborn CF. Bone health and osteoporosis. Clin Sports Med. 2000;19:233–49. doi: 10.1016/s0278-5919(05)70201-5. [DOI] [PubMed] [Google Scholar]
- 4.Nichols DL, Sanborn CF, Essery EV. Bone density and young athletic women. An update. Sports Med. 2007;37:1001–14. doi: 10.2165/00007256-200737110-00006. [DOI] [PubMed] [Google Scholar]
- 5.Johnston CC, Jr, Slemenda CW. Peak bone mass, bone loss and risk of fracture. Osteoporos Int. 1994;4(Suppl 1):43–5. doi: 10.1007/BF01623435. [DOI] [PubMed] [Google Scholar]
- 6.Nordstrom A, Karlsson C, Nyquist F, Olsson T, Nordstrom P, Karlsson M. Bone loss and fracture risk after reduced physical activity. J Bone Miner Res. 2005;20:202–7. doi: 10.1359/JBMR.041012. [DOI] [PubMed] [Google Scholar]
- 7.Kanis JA, Johnell O, Oden A, Dawson A, De Laet C, Jonsson B. Ten year probabilities of osteoporotic fractures according to BMD and diagnostic thresholds. Osteoporos Int. 2001;12:989–95. doi: 10.1007/s001980170006. [DOI] [PubMed] [Google Scholar]
- 8.Pearce G, Bass S, Young N, Formica C, Seeman E. Does weight-bearing exercise protect against the effects of exercise-induced oligomenorrhea on bone density? Osteoporos Int. 1996;6:448–52. doi: 10.1007/BF01629577. [DOI] [PubMed] [Google Scholar]
- 9.Christo K, Prabhakaran R, Lamparello B, Cord J, Miller KK, Goldstein MA, Gupta N, Herzog DB, Klibanski A, Misra M. Bone metabolism in adolescent athletes with amenorrhea, athletes with eumenorrhea, and control subjects. Pediatrics. 2008;121:1127–36. doi: 10.1542/peds.2007-2392. [DOI] [PMC free article] [PubMed] [Google Scholar]
- 10.Nichols JF, Rauh MJ, Lawson MJ, Ji M, Barkai HS. Prevalence of the female athlete triad syndrome among high school athletes. Arch Pediatr Adolesc Med. 2006;160:137–42. doi: 10.1001/archpedi.160.2.137. [DOI] [PubMed] [Google Scholar]
- 11.Russell M, Stark J, Nayak S, Miller KK, Herzog DB, Klibanski A, Misra M. Peptide YY in adolescent athletes with amenorrhea, eumenorrheic athletes and non-athletic controls. Bone. 2009;45:104–9. doi: 10.1016/j.bone.2009.03.668. [DOI] [PMC free article] [PubMed] [Google Scholar]
- 12.Boutroy S, Bouxsein ML, Munoz F, Delmas PD. In vivo assessment of trabecular bone microarchitecture by high-resolution peripheral quantitative computed tomography. J Clin Endocrinol Metab. 2005;90:6508–15. doi: 10.1210/jc.2005-1258. [DOI] [PubMed] [Google Scholar]
- 13.Bredella MA, Misra M, Miller KK, Madisch I, Sarwar A, Cheung A, Klibanski A, Gupta R. Distal radius in adolescent girls with anorexia nervosa: trabecular structure analysis with high-resolution flat-panel volume CT. Radiology. 2008;249:938–46. doi: 10.1148/radiol.2492080173. [DOI] [PMC free article] [PubMed] [Google Scholar]
- 14.Boutroy S, Van Rietbergen B, Sornay-Rendu E, Munoz F, Bouxsein ML, Delmas PD. Finite element analysis based on in vivo HR-pQCT images of the distal radius is associated with wrist fracture in postmenopausal women. J Bone Miner Res. 2008;23:392–9. doi: 10.1359/jbmr.071108. [DOI] [PubMed] [Google Scholar]
- 15.Vilayphiou N, Boutroy S, Sornay-Rendu E, Van Rietbergen B, Munoz F, Delmas PD, Chapurlat R. Finite element analysis performed on radius and tibia HR-pQCT images and fragility fractures at all sites in postmenopausal women. Bone. 46:1030–7. doi: 10.1016/j.bone.2009.12.015. [DOI] [PubMed] [Google Scholar]
- 16.Vilayphiou N, Boutroy S, Szulc P, Van Rietbergen B, Munoz F, Delmas PD, Chapurlat R. Finite element analysis performed on radius and tibia HR-pQCT images and fragility fractures at all sites in men. J Bone Miner Res. doi: 10.1002/jbmr.297. [DOI] [PubMed] [Google Scholar]
- 17.Stein EM, Liu XS, Nickolas TL, Cohen A, Thomas V, McMahon DJ, Zhang C, Cosman F, Nieves J, Greisberg J, Guo XE, Shane E. Abnormal microarchitecture and stiffness in postmenopausal women with ankle fractures. J Clin Endocrinol Metab. 2011;96:2041–8. doi: 10.1210/jc.2011-0309. [DOI] [PMC free article] [PubMed] [Google Scholar]
- 18.Melton LJ, 3rd, Riggs BL, Muller R, Achenbach SJ, Christen D, Atkinson EJ, Amin S, Khosla S. Determinants of forearm strength in postmenopausal women. Osteoporos Int. 2011 doi: 10.1007/s00198-011-1540-2. [DOI] [PMC free article] [PubMed] [Google Scholar]
- 19.Burghardt AJ, Buie HR, Laib A, Majumdar S, Boyd SK. Reproducibility of direct quantitative measures of cortical bone microarchitecture of the distal radius and tibia by HR-pQCT. Bone. 2010;47:519–28. doi: 10.1016/j.bone.2010.05.034. [DOI] [PMC free article] [PubMed] [Google Scholar]
- 20.Burghardt AJ, Kazakia GJ, Ramachandran S, Link TM, Majumdar S. Age- and gender-related differences in the geometric properties and biomechanical significance of intracortical porosity in the distal radius and tibia. J Bone Miner Res. 2010;25:983–93. doi: 10.1359/jbmr.091104. [DOI] [PMC free article] [PubMed] [Google Scholar]
- 21.Nishiyama KK, Macdonald HM, Buie HR, Hanley DA, Boyd SK. Postmenopausal women with osteopenia have higher cortical porosity and thinner cortices at the distal radius and tibia than women with normal aBMD: an in vivo HR-pQCT study. J Bone Miner Res. 2010;25:882–90. doi: 10.1359/jbmr.091020. [DOI] [PubMed] [Google Scholar]
- 22.Ostertag A, Cohen-Solal M, Audran M, Legrand E, Marty C, Chappard D, de Vernejoul MC. Vertebral fractures are associated with increased cortical porosity in iliac crest bone biopsy of men with idiopathic osteoporosis. Bone. 2009;44:413–7. doi: 10.1016/j.bone.2008.11.004. [DOI] [PubMed] [Google Scholar]
- 23.Ackerman KE, Nazem T, Chapko D, Russell M, Mendes N, Taylor AP, Bouxsein ML, Misra M. Bone microarchitecture is impaired in adolescent amenorrheic athletes compared with eumenorrheic athletes and nonathletic controls. J Clin Endocrinol Metab. 2011;96:3123–33. doi: 10.1210/jc.2011-1614. [DOI] [PMC free article] [PubMed] [Google Scholar]
- 24.Rickenlund A, Carlstrom K, Ekblom B, Brismar TB, Von Schoultz B, Hirschberg AL. Effects of oral contraceptives on body composition and physical performance in female athletes. J Clin Endocrinol Metab. 2004;89:4364–70. doi: 10.1210/jc.2003-031334. [DOI] [PubMed] [Google Scholar]
- 25.Robinson TL, Snow-Harter C, Taaffe DR, Gillis D, Shaw J, Marcus R. Gymnasts exhibit higher bone mass than runners despite similar prevalence of amenorrhea and oligomenorrhea. J Bone Miner Res. 1995;10:26–35. doi: 10.1002/jbmr.5650100107. [DOI] [PubMed] [Google Scholar]
- 26.Fehling PC, Alekel L, Clasey J, Rector A, Stillman RJ. A comparison of bone mineral densities among female athletes in impact loading and active loading sports. Bone. 1995;17:205–10. doi: 10.1016/8756-3282(95)00171-9. [DOI] [PubMed] [Google Scholar]
- 27.Mudd LM, Fornetti W, Pivarnik JM. Bone mineral density in collegiate female athletes: comparisons among sports. J Athl Train. 2007;42:403–8. [PMC free article] [PubMed] [Google Scholar]
- 28.Katzman DK, Bachrach LK, Carter DR, Marcus R. Clinical and anthropometric correlates of bone mineral acquisition in healthy adolescent girls. J Clin Endocrinol Metab. 1991;73:1332–9. doi: 10.1210/jcem-73-6-1332. [DOI] [PubMed] [Google Scholar]
- 29.Hart TL, Ainsworth BE, Tudor-Locke C. Objective and subjective measures of sedentary behavior and physical activity. Med Sci Sports Exerc. 2011;43:449–56. doi: 10.1249/MSS.0b013e3181ef5a93. [DOI] [PubMed] [Google Scholar]
- 30.Buie HR, Campbell GM, Klinck RJ, MacNeil JA, Boyd SK. Automatic segmentation of cortical and trabecular compartments based on a dual threshold technique for in vivo micro-CT bone analysis. Bone. 2007;41:505–15. doi: 10.1016/j.bone.2007.07.007. [DOI] [PubMed] [Google Scholar]
- 31.Macneil JA, Boyd SK. Bone strength at the distal radius can be estimated from high-resolution peripheral quantitative computed tomography and the finite element method. Bone. 2008;42:1203–13. doi: 10.1016/j.bone.2008.01.017. [DOI] [PubMed] [Google Scholar]
- 32.Kirmani S, Christen D, van Lenthe GH, Fischer PR, Bouxsein ML, McCready LK, Melton LJ, 3rd, Riggs BL, Amin S, Muller R, Khosla S. Bone structure at the distal radius during adolescent growth. J Bone Miner Res. 2009;24:1033–42. doi: 10.1359/JBMR.081255. [DOI] [PMC free article] [PubMed] [Google Scholar]
- 33.Vilayphiou N, Boutroy S, Sornay-Rendu E, Van Rietbergen B, Munoz F, Delmas PD, Chapurlat R. Finite element analysis performed on radius and tibia HR-pQCT images and fragility fractures at all sites in postmenopausal women. Bone. 2010;46:1030–7. doi: 10.1016/j.bone.2009.12.015. [DOI] [PubMed] [Google Scholar]
- 34.Vilayphiou N, Boutroy S, Szulc P, van Rietbergen B, Munoz F, Delmas PD, Chapurlat R. Finite element analysis performed on radius and tibia HR-pQCT images and fragility fractures at all sites in men. J Bone Miner Res. 2011;26:965–73. doi: 10.1002/jbmr.297. [DOI] [PubMed] [Google Scholar]
- 35.Pistoia W, van Rietbergen B, Lochmuller EM, Lill CA, Eckstein F, Ruegsegger P. Estimation of distal radius failure load with micro-finite element analysis models based on three-dimensional peripheral quantitative computed tomography images. Bone. 2002;30:842–8. doi: 10.1016/s8756-3282(02)00736-6. [DOI] [PubMed] [Google Scholar]
- 36.Warren MP, Brooks-Gunn J, Fox RP, Holderness CC, Hyle EP, Hamilton WG. Osteopenia in exercise-associated amenorrhea using ballet dancers as a model: a longitudinal study. J Clin Endocrinol Metab. 2002;87:3162–8. doi: 10.1210/jcem.87.7.8637. [DOI] [PubMed] [Google Scholar]
- 37.Duncan CS, Blimkie CJ, Cowell CT, Burke ST, Briody JN, Howman-Giles R. Bone mineral density in adolescent female athletes: relationship to exercise type and muscle strength. Med Sci Sports Exerc. 2002;34:286–94. doi: 10.1097/00005768-200202000-00017. [DOI] [PubMed] [Google Scholar]
- 38.Peltonen JE, Taimela S, Erkintalo M, Salminen JJ, Oksanen A, Kujala UM. Back extensor and psoas muscle cross-sectional area, prior physical training, and trunk muscle strength--a longitudinal study in adolescent girls. Eur J Appl Physiol Occup Physiol. 1998;77:66–71. doi: 10.1007/s004210050301. [DOI] [PubMed] [Google Scholar]
- 39.Nicks KM, Amin S, Atkinson EJ, Riggs BL, Melton LJ, 3rd, Khosla S. Relationship of age to bone microstructure independent of areal bone mineral density. J Bone Miner Res. 2012;27:637–44. doi: 10.1002/jbmr.1468. [DOI] [PMC free article] [PubMed] [Google Scholar]
- 40.Burghardt AJ, Issever AS, Schwartz AV, Davis KA, Masharani U, Majumdar S, Link TM. High-resolution peripheral quantitative computed tomographic imaging of cortical and trabecular bone microarchitecture in patients with type 2 diabetes mellitus. J Clin Endocrinol Metab. 2010;95:5045–55. doi: 10.1210/jc.2010-0226. [DOI] [PMC free article] [PubMed] [Google Scholar]
- 41.Turner CH, Pavalko FM. Mechanotransduction and functional response of the skeleton to physical stress: the mechanisms and mechanics of bone adaptation. J Orthop Sci. 1998;3:346–55. doi: 10.1007/s007760050064. [DOI] [PubMed] [Google Scholar]
- 42.Duncan RL, Turner CH. Mechanotransduction and the functional response of bone to mechanical strain. Calcif Tissue Int. 1995;57:344–58. doi: 10.1007/BF00302070. [DOI] [PubMed] [Google Scholar]
- 43.Knothe Tate ML, Steck R, Forwood MR, Niederer P. In vivo demonstration of load-induced fluid flow in the rat tibia and its potential implications for processes associated with functional adaptation. J Exp Biol. 2000;203:2737–45. doi: 10.1242/jeb.203.18.2737. [DOI] [PubMed] [Google Scholar]
- 44.Tami AE, Nasser P, Schaffler MB, Knothe Tate ML. Noninvasive fatigue fracture model of the rat ulna. J Orthop Res. 2003;21:1018–24. doi: 10.1016/S0736-0266(03)00099-8. [DOI] [PubMed] [Google Scholar]
- 45.Goulet GC, Hamilton N, Cooper D, Coombe D, Tran D, Martinuzzi R, Zernicke RF. Influence of vascular porosity on fluid flow and nutrient transport in loaded cortical bone. J Biomech. 2008;41:2169–75. doi: 10.1016/j.jbiomech.2008.04.022. [DOI] [PubMed] [Google Scholar]
- 46.Steck R, Niederer P, Knothe Tate ML. A finite element analysis for the prediction of load-induced fluid flow and mechanochemical transduction in bone. J Theor Biol. 2003;220:249–59. doi: 10.1006/jtbi.2003.3163. [DOI] [PubMed] [Google Scholar]
- 47.Walsh CJ, Phan CM, Misra M, Bredella MA, Miller KK, Fazeli PK, Bayraktar HH, Klibanski A, Gupta R. Women with anorexia nervosa: finite element and trabecular structure analysis by using flat-panel volume CT. Radiology. 2010;257:167–74. doi: 10.1148/radiol.10100222. [DOI] [PMC free article] [PubMed] [Google Scholar]
- 48.Schnackenburg KE, Macdonald HM, Ferber R, Wiley JP, Boyd SK. Bone Quality and Muscle Strength in Female Athletes with Lower Limb Stress Fractures. Med Sci Sports Exerc. 2011;43:2110–2119. doi: 10.1249/MSS.0b013e31821f8634. [DOI] [PubMed] [Google Scholar]
- 49.Joy EA, Campbell D. Stress fractures in the female athlete. Curr Sports Med Rep. 2005;4:323–8. doi: 10.1097/01.csmr.0000306294.72578.a8. [DOI] [PubMed] [Google Scholar]
- 50.Melton LJ, 3rd, Riggs BL, van Lenthe GH, Achenbach SJ, Muller R, Bouxsein ML, Amin S, Atkinson EJ, Khosla S. Contribution of in vivo structural measurements and load/strength ratios to the determination of forearm fracture risk in postmenopausal women. J Bone Miner Res. 2007;22:1442–8. doi: 10.1359/jbmr.070514. [DOI] [PubMed] [Google Scholar]
- 51.Gilsanz V, Chalfant J, Kalkwarf H, Zemel B, Lappe J, Oberfield S, Shepherd J, Wren T, Winer K. Age at onset of puberty predicts bone mass in young adulthood. J Pediatr. 2011;158:100-5–105 e1-2. doi: 10.1016/j.jpeds.2010.06.054. [DOI] [PMC free article] [PubMed] [Google Scholar]
- 52.Theintz G, Buchs B, Rizzoli R, Slosman D, Clavien H, Sizonenko PC, Bonjour JP. Longitudinal monitoring of bone mass accumulation in healthy adolescents: evidence for a marked reduction after 16 years of age at the levels of lumbar spine and femoral neck in female subjects. J Clin Endocrinol Metab. 1992;75:1060–5. doi: 10.1210/jcem.75.4.1400871. [DOI] [PubMed] [Google Scholar]
- 53.Soyka LA, Fairfield WP, Klibanski A. Clinical review 117: Hormonal determinants and disorders of peak bone mass in children. J Clin Endocrinol Metab. 2000;85:3951–63. doi: 10.1210/jcem.85.11.6994. [DOI] [PubMed] [Google Scholar]