

DEAR EDITOR,
Malnutrition of pre-school children is one of the most serious health problems in developing countries including India.,[1,2] and measurement of child growth is the universal mean to assess adequate nutrition, health and development of the child community.[3] According to de Onis (2003)[4] growth assessment is the single best measurement for evaluating child health and nutritional status, and it provides an indirect measurement of the quality of life of an entire population.
Anthropometric measurements are widely used procedures for assessing children's nutritional status.[5] The assessment of growth and nutritional status by measurement of weight, height, head circumference, body mass index, skin fold thicknesses, and mid-upper arm circumference is vital to the identification of growth failure and undernutrition.[3,6] Measurements of mid-arm circumference and head circumference (HC) are good indicators of marginal cases of protein energy malnutrition in both survey and screening programs.[7] Head growth, primarily owing to brain development, is most rapid within the first three years of life. Routine measurement of HC (the frontal occipital circumference) is a component of the nutritional assessment in children up to age three and longer in children who are at high nutritional risk. HC is a less sensitive indicator of short-term nutritional status than weight because brain growth is generally preserved in cases of nutritional stress. It should be mentioned that HC is not a helpful nutritional status measure in children with hydrocephalus, microcephaly and macrocephaly.[8] Savage et al.,[6] suggested that head circumference is an especially useful index that should be measured more often. But in many studies these measurements are omitted. In particular, few published data are available on growth patterns and prevalence of undernutrition among pre-school children using head circumference.
In the above light, the present investigation has been designed to assess nutritional status among urban pre-school children using the WHO (2007) age and sex specific head circumference cut-off point.
This cross sectional study was carried out among the urban pre-school children of Bengalee ethnicity attending an immunization clinic in Midnapore District Red Cross Hospital situated at Midnapore town, West Bengal, India during the period of January 2010 to December 2011. Children between 1 year to 3 years who attended the hospital immunization clinic were included. Children with numerous pathologic conditions associated with abnormal head size were excluded. HC was measured (cm) using a flexible, non stretch tape measure according to standard method.[3] Care was taken to keep the tape measure flat against the head parallel on both sides. The measurement was recorded to the nearest 0.1 cm. Nutritional assessment of the children was evaluated using the World Health Organization (WHO) 2007 recommended HC-for-age specific z-scores cut-off value.[9] Nutritional status of the children was evaluated using the following scheme:
Moderate undernutrition: <-2 standard deviation (SD) Z-score value
Severe undernutrition: <-3 SD Z-score value Where SD refers to the age and sex-specific.
The objective of the study was explained and consent also was obtained from the parents of each children.
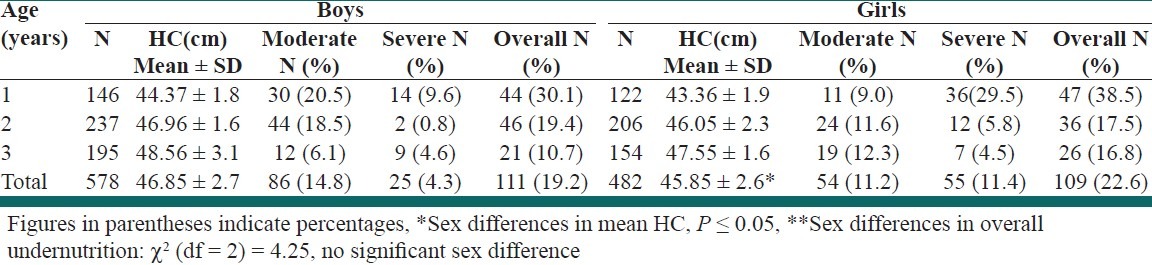
A total of 1,060 children (578 boys and 482 girls) in the age group of 1 - 3 years were included. The assessment of nutritional status of these preschool children by head circumference is presented in Table 1. The mean head circumference among boys and girls was 46.85 cm (± 2.7) and 45.85 cm (± 2.6), respectively and it was statistically significant between sexes. It increased with age. The overall prevalence (age combined) of under nutrition based on head circumference cut-off points was slightly higher in girls (22.6%) than boys (19.2%) but the differences was not significant. The age-specific highest prevalence of undernutrition was found at the age of one year among both boys (30.1%) and girls (38.5%). It was also apparent that the prevalence of undernutrition decreased sharply with age in both boys and girls.
Table 1.
Assessment of nutritional status of the pre-school children by head circumference
The head circumference mainly relates to brain size. In the present study the mean value of HC was not significant between the boys and girls of all age groups, but other study in India[1,2] showed significant sex difference among the pre-school children. The mean value of HC of pre-school children ranging in age 1-3 years were compared with WHO standards. A previous study by Singh and Bisnoi (2005)[7] among female pre-school children of Faizabad District, U. P. showed lower HC mean values than the NCHS standard. Correspondingly, Sing and Grover (2003)[1] have also documented that HC of Panjabi pre-school children was significantly lower than the standard. Overall prevalence rates of undernutrition based on HC was 20.7% and it was higher among girls than boys. In a similar study conducted in rural pre-school children of Hooghly district of West Bengal indicated that the much higher prevalence of undernutrition (boys 64.9% and girls 62.8%).[2] This may be attributed to the fact that the present study participants were from an urban area having better socio-economic conditions with less nutritional stress. But, Jain and Saxena (1977) revealed that the HC of children did not differ much between the lower socio-economic group and the higher socio-economic group.[10] In the present study, we show that children under 3 years of age in Midnapore town remain at risk for malnutrition. And that the malnutrition remains a common problem among urban preschool children in India.
Footnotes
Source of Support: Nil.
Conflict of Interest: None declared.
REFERENCES
- 1.Singh I, Grover K. Nutritional profile of urban pre-school children of Punjab. Anthropologist. 2003;5:149–53. [Google Scholar]
- 2.Mandal GC, Bose K. Undernutrition among the rural preschool children (ICDS) of Arambag, Hooghly district, West Bengal, India, using new head circumference cut-off points. Int J Curr Res. 2010;10:7–11. [Google Scholar]
- 3.Physical status: The use and interpretation of anthropometry: Technical report series. Geneva: World Health Organization; 1995. WHO. Report No.:854. [PubMed] [Google Scholar]
- 4.de Onis M. Child growth and development. In: Semba RD, Bloem MW, editors. Nutrition and Health in Developing Countries. Totana, N.J: Humana Press Inc; 2001. [Google Scholar]
- 5.Johnson MD, Yamanaka WK, Formacion CS. A comparison of anthropometric methods for assessing nutritional status of preschool children: The Philippines study. J Trop Pediatr. 1984;30:96–104. doi: 10.1093/tropej/30.2.96. [DOI] [PubMed] [Google Scholar]
- 6.Savage SA, Reilly JJ, Edwards CA, Durnin JV. Adequacy of standards for assessment of growth and nutritional status in infancy and early childhood. Arch Dis Child. 1999;80:121–4. doi: 10.1136/adc.80.2.121. [DOI] [PMC free article] [PubMed] [Google Scholar]
- 7.Singh S, Bisnoi I. Trend of growth in mid-arm circumference and head circumference of pre school female children of Faizabad District, U.P. Indian J Prev Soc Med. 2005;36:143–6. [Google Scholar]
- 8.Maqbool A, Olsen IE, Stallings VA. Clinical assessment of nutritional status. Nutrition in Pediatrics. 4th ed. Hamilton, Ontario, Canada: BC Decker Inc; 2008. pp. 6–13. Chapter 2. [Google Scholar]
- 9.Methods and Development. Geneva: World Health Organization; 2007. WHO Child Growth Standards: Head circumferencefor-age, arm circumference-for-age, triceps skin foldfor-age and subscapular skin fold-for-age. [Google Scholar]
- 10.Jain VK, Saxena S. Various Socio-economic Class of Jaipur. M.D thesis (unpublished) Rajasthan: University of Rajasthan; 1977. ‘Study of physical growth of children between 0-5 years of life’ Nutritive value of Indian foods. (Pediatrics) [Google Scholar]