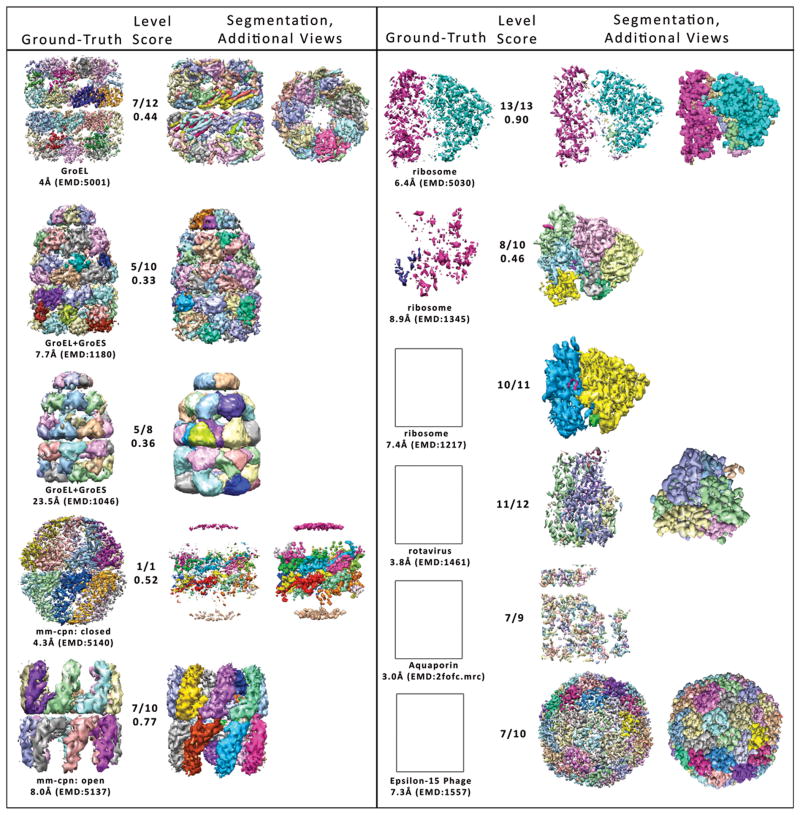
Figure 3. Segmentations of Challenge maps.
Colored regions correspond to unique clusters. For each map, the hierarchy level with the highest scoring segmentation is shown (third column). In the second column, the hierarchy level is given out of the total number of hierarchy levels for that Nhs segmentation, as well as the shape-match score for this segmentation. In the first column, the ground-truth partitioning of the map, for which the shape-match score was calculated is shown. Ground-truth maps and predicted segmentations are shown at the intensity threshold used for the segmentation. For GroEL at 4Å and Rotavirus, top-views of the segmented map are shown in the fourth column. For Mm-cpn at 4.3Å, Ribosome at 6.8Å, and Epsilon-15 Phage at 7.3Å, the map is shown at a lower intensity threshold for clarity in the fourth column. Figures generated in Matlab and Chimera with TOM Toolbox (26).

