Abstract
The ability to sort and capture more than one cell type from a complex sample will enable a wide variety of studies of cell proliferation, death, and the analysis of disease states. In this work, we integrated a pneumatic actuated control layer to an affinity separation layer to create different antibody coating regions on the same fluidic channel. The comparison of different antibody capture capabilities to the same cell line was demonstrated by flowing Ramos cells through anti-CD19 and anti-CD71 coated regions in the same channel, respectively. It was determined that cell capture density on anti-CD19 region was 2.44±0.13 times higher than on anti-CD71 coated region. This approach can be used to test different affinity molecules for selectivity and capture efficiency using a single cell line in one separation. Selective capture of Ramos and HuT 78 cells from a mixture was also demonstrated using two antibody regions in the same channel. Greater than 90% purity was obtained on both capture areas in both continuous flow and stop flow separation modes. A four-region antibody coated device was then fabricated to study the simultaneous, serial capture of three different cell lines. In this case the device showed effective capture of cells in a single separation channel, opening up the possibility of multiple cell sorting. Multi-parameter sequential blood sample analysis was also demonstrated with high capture specificity (>97% for both CD19+ and CD4+ leukocytes). The chip can also be used to selectively treat cells after affinity separation.
Introduction
Microfluidic devices have become an increasingly important analytical platform for biological research as they provide precise fluid control, minimum sample and reagent consumption, device miniaturization and large scale integration. Numerous investigations and applications in microfluidic devices have been reported in recent years [1], including cancer research, drug discovery and screening, single cell analysis and stem cell research, etc. In most biological studies, it is important to obtain a pure cell population to simplify experiment parameters and eliminate variations in experiments [2, 3]. Moreover, disease diagnosis benefits from specific cells counting and separation [4]. Chip-based cell separation systems have also been studied extensively to combine the advantages of microfluidic systems with conventional separation approaches. These approaches include hydrodynamic separation, dielectrophoresis, fluorescence activated cell sorting (FACS), magnetic activated cell sorting (MACS), affinity separation, etc. [5-14]. Among these approaches, on-chip affinity cell separation methods have gained interests due to the advantages of label free separation, rapid analysis, high specificity, low cost and ease of operation. Devices based on affinity surface separation have been reported for cancer cell separation, circulating tumor cell enrichment and CD4+ cell counting for HIV diagnosis [15-21].
For cell affinity separations, separation occurs when cells have different affinity to surface-immobilized molecules. Cells that have low affinity with the capture surface require low shear stress to be removed, whereas high affinity cells require higher shear stress for removal. As a result, different cell lines can be separated by choosing appropriate applied shear stress, which will remove low affinity cells from the surface while maintaining high affinity cells [21]. In a straight, rectangular channel, shear stress can be expressed as:
| (1) |
Where μ is the buffer viscosity, Q is the volumetric flow rate, w is the width of separation channel and h is the height of channel. Shear stress can be adjusted in most cases by changing the volumetric flow rate. In practical experiments, the flow rate is often controlled by pump pressure or syringe pump speed.
Surface modification is also an important factor for microfluidic affinity cell separation. Surface roughness and micro structures have been exploited to enhance cell-surface interaction to obtain better capture efficiency [15, 17, 19, 22]. Surface coating patterns are also an important aspect for microfluidic affinity separation. Patterned affinity surface coatings can extend the affinity separations to multi-parameter capture and separation. To coat the separation surface with desired patterns and molecules, micro-contact printing and microfluidic printing are the widely used strategies [23]. Micro-contact printing uses fabricated stamps (e.g. Polydimethylsiloxane (PDMS) stamps) with designed patterns to transfer said designs onto the surface. Affinity molecules are subsequently conjugated to the patterned surface [24-26]. Flexible coating patterns and arrays can be easily transferred onto surface via standard lithography or soft lithography. However, it is difficult to control the concentration of surface-conjugated molecules, and precise alignment is required to achieve complex coating patterns. For affinity based cell separation where fluidic channels are used to control shear stress for separation, post assembly modification of the capture surface is difficult. Therefore, microfluidic printing is a more favorable approach for microfluidic affinity cell separation [15-18, 27-31].
Microfluidic printing allows capture molecule coating to occur in the final assembled device. Surface modification reagents are loaded into separation channels for conjugation, thus surface coverage can be controlled by changing the solution concentration. Cell samples can be directly introduced into the separation channels after modification without any additional procedures. However, microfluidic printing is not as flexible as micro-contact printing in creating coating patterns. For example, it is difficult to modify one straight channel with different affinity molecule regions. In chips where multiple cell types are to be separated, either parallel or series approaches can be used. In the case of parallel chips, the cell sample is split into parallel channels, each loaded with a different antibody. Series separation chips feature multiple antibody separation zones in a single channel. Series chips allow for multi-parameter cell separations with a single channel, eliminating differences in flow rates between channels. Oftentimes, however, these chips are difficult to fabricate and cannot allow for collection of individual separation zones for additional analyses.
In this study, we demonstrate the feasibility of using well-established multi-layer soft lithography techniques [32] to define different coating regions in one straight separation channel. As the proof of concept, four antibody capture zones were produced in a single separation channel. Multi-parameter cell separations were performed using anti-CD19, anti-CD4, anti-CD71, and anti-CD8 regions. Pneumatic valves were employed to confine different coating reagents in desired areas in the separation channel. We also demonstrated the ability to select individual separation regions for secondary analyses or cell treatment. This multi-parameter cell separation chip can be used for a wide variety of cell separation assays, including secondary analysis of isolated cell types.
Experimental Section
Cells and cell culture
HuT-78 T lymphocytes (TIB-161), Ramos cells (CRL-1596), and Prostate cancer cells (CRL-1435) were obtained from American Type Culture Collection (ATCC). HuT-78 T lymphocytes are CD4 and CD71 positive and CD19 negative, while Ramos cells are CD71 and CD19 positive and CD4 negative. Prostate cancer cells are CD71 positive, CD4 negative, and CD19 negative. All cell lines were tested for expression of CD4, CD19, and CD71 using flow cytometry. While the cell lines in question express multiple surface markers, we only report the expression of antigens matching the capture antibodies used in this work.
All cell lines were cultured at 37°C and 5% CO2 in RPMI 1640 medium (Hyclone) with 10% fetal bovine serum (Hyclone) and 20 mL/L antibiotic (penicillin-streptomycin solution stabilized, Sigma-Aldrich, Inc.) solution. Both HuT-78 T and Ramos cells were subcultured one to two times a week. Prostate cancer cells were subcultured once they were fully confluent. Before each experiment, cells were taken out from the culture flask and concentrated using a centrifuge to the experiment concentration. The typical cell concentration range in this study was from 1000-5000 cells/μL, determined by hemacytomer before each experiment.
Device fabrication
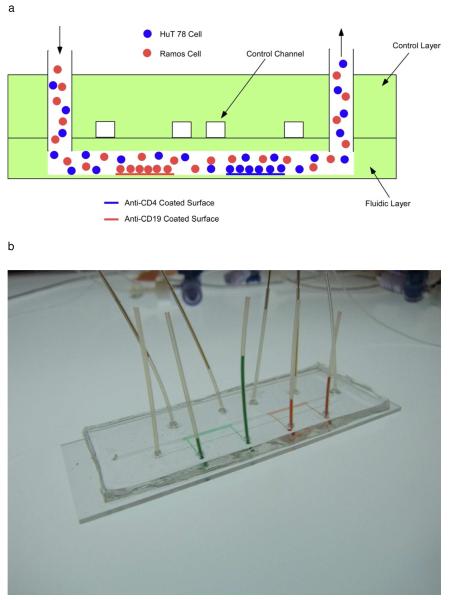
Devices in this work were fabricated using the typical procedures of multilayer soft lithography [32]. Briefly, a microfluidic design (Fig. 1) was drawn on computer and printed at 20,000 dpi by CAD Art Services. Photolithography was used to make the molds for both fluidic layer (bottom layer) and control layer (top layer). Negative photoresist SU-8 2015 (Micro Chem) was spin coated at 1000 rpm for 30 seconds to form an about 40 μm thick layer on a 4 inch diameter silicon wafer. Wafers were processed by baking for 6 minutes at 95°C, 15 seconds of UV exposure, 6 minutes baking at 95°C, and 6 minutes of developing using SU-8 developer (Micro Chem). Perfluorooctyltrichlorosilane (Alfa Aesar) was coated on the mold surface under vacuum to protect the wafer.
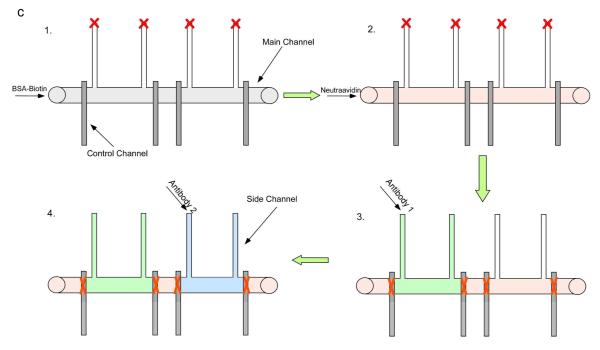
Fig. 1.
Schematic of the fluid network design (2-parameter cell separation shown). A) Illustration of side view of device operation. Different antibodies can be coated on the different regions in the same channel, allowing for multi-parameter cell separation. B) Actual image of a device with two antibody zones. Red and green food coloring were introduced to the individual separation zones for visualization. C) The surface modification procedure. Biotinylated bovine serum albumin and neutravidin were added sequentially to the main channel. Afterward, control valves were closed (symbolized by “X”) to allow antibodies to be coated in specific capture zones.
Both the fluidic layer and control layer were made of PDMS (SYLGARD 184, Dow Corning). To make the control layer, PDMS pre-polymer was mixed with the curing agent at 5:1 ratio and baked at 95°C for 1 hour. 25:1 of PDMS pre-polymer and curing agent was spin coated at 2000 rpm for 30s to form the thin fluidic layer and baked at 70°C for 30 minutes. The cured control layer was layered onto the fluidic layer and baked at 120°C for 2 hours to seal the two layers. Holes were punched to form fluid inlets and outlets and sealed on a glass slide using an oxygen plasma.
Affinity surface modification procedure
To prepare the modified glass surface, fluidic channels were first rinsed with deionized water and dried. 5 μL of biotin-conjugated bovine serum albumin (1 mg/mL in 10 mM Tris–HCl, pH 8.0, 50 mM NaCl) solution were loaded into the main separation channel and incubated for 45 min at room temperature [33]. After rinsing with 10 μL 10mM Tris–HCl buffer, 5 μL of neutravidin (0.2 mg/mL in 10mM Tris–HCl buffer, Pierce) solution were loaded into the main channel and incubated for 15 min. Modified devices were washed with 10 μL 10mM Tris–HCl buffer and 10 μL deionized water and stored in refrigerator at 4°C after air dry. At this point, the entire chip surface was coated with a layer of neutravidin. Before each experiment, antibodies were coated onto the desired region of the main channels. In general, 5 μL of antibody 1 was first introduced into the main channel from the side fluidic channel and incubated for 20 minutes. Mouse anti-human CD4-biotin, mouse anti-human CD19-biotin, and mouse anti-human CD71-biotin were purchased from the eBioscience. Mouse anti-human CD8-biotin was purchased from BD Biosciences. All antibodies were monoclonal. Control channels were connected with an air source and were controlled via a 3-way stopcock (Small parts). The process was repeated for each antibody capture zone. The surface modification procedure is summarized in Figure 1c.
The biotinylated BSA layer has been shown in our previous work and also by other groups to be an effective method of producing an affinity capture surface. The BSA-biotin later, followed by neutravidin or streptavidin, and finally a biotinylated antibody, has been shown to withstand shear stress at flow rates used for cell capture. During affinity surface production and chip operation, there is no loss in capture affinity in the chip, indicating that the coating strategy is stable. However, at much higher flow rates, the coating allows cells to be recovered. In our previous work [34] we have shown that the affinity surface cannot be reused due to either denaturation of the antibody or loss of the BSA-glass adhesion. However, in other work in our group [35], we have shown that when biotinylated aptamers are used instead of antibodies, the affinity surface can be reused.
Cell separation and detection
Cell sample introduction and flow rate control were achieved using syringe pumps (KD Scientific). Syringes and chips were connected via 30-gauge PTFE tubing (Small Parts). 3% bovine serum albumin (BSA, Sigma-Aldrich) in phosphate-buffered saline (PBS, Mediatech)) was first introduced into the channel. To minimize the cell loading time, a 0.5 mL/h flow rate was used to load cells into the tubing and chip inlet. Once cells were observed in the separation channel under the microscope, the flow rate was decreased to 0.05 to 0.1 mL/h for cell capture. The separation time varied from 10 to 30 minutes. To measure cell velocity and throughput, 30-secondsvideos were recorded at different time intervals and chip positions. For cell mixtures, HuT 78 cells were pre-stained with 10 μL of 10 μM Calcein-AM (Invitrogen) to differentiate different cell lines. Fluorescent cells were observed using inverted epifluorescence microscope (IX71, Olympus) with appropriate filters and a 0.3 NA 10X objective. Microscope images and videos were recorded with a cooled CCD camera coupled to the microscope and analyzed using ImageJ (Version 1.43u, National Institutes of Health).
Blood cell separations
Whole blood standards (Multi-Check Control) were purchased from Becton-Dickinson. Erythrocytes in the blood samples were first lysed by diluting the sample 1:10 in distilled H2O for 30s. Osmolarity was restored using concentrated NaCl. Each blood sample was then injected into separation channel using a syringe pump. Once the sample was filled in the channel, the pump was stopped and cells settled onto the surface for 30min. The channel was then washed with 200 μL PBS containing 20 μL FITC-antiCD4 and PE-antiCD19 at 0.1ml/h to remove unbound cells and check captured cells.
Results and Discussion
Surface modification with pneumatic valves
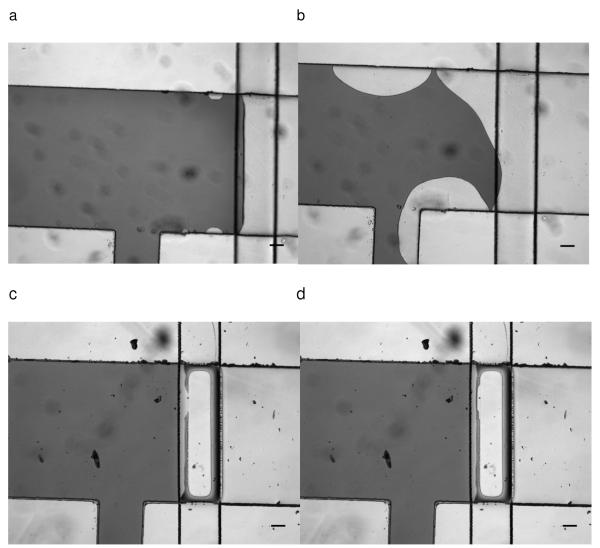
In our approach, we used pneumatic valves to confine the coating of antibodies to desired regions. However, the positive air pressure (in this study, ~75-80 kPa) typically applied to actuate valves tended to introduce air to the fluidic channels due to the gas permeability of PDMS membrane. Thus, long term operation of valves may introduce air bubbles into the fluidic system and disrupt the coating process. In Fig 2a, even after short term operation (~5 seconds) to produce confined reagent coatings, small bubbles were observed. Over a 20-minute interval the bubble volume increased. The bubbles disrupted the boundary of the antibody-modified area, resulting in the decrease of coating resolution (Fig. 2b). Water-actuated valves were employed to overcome this difficulty. Since the PDMS membrane is gas permeable, using water in the control channels will eliminate bubble formation. The same air pressure was then applied to the water filled channels to close the valve. In this manner, water isolated the air from the fluidic system to prevent bubbles coming into the channels, allowing long-term valve operation. Fig.2c and 2d show the water filled valve confined a dye in the desired region, and that the boundary was stable for 20 minutes with the valves closed. Using this valve operation approach, the spatial control of the coating region depended on the valve actuated area.
Fig. 2.
a) 0 min of localized coating with pneumatic valve. Dark area indicated solution of red food color. Light area indicated air region. Pneumatic valve was released in this image. b) 20 min of localized coating with pneumatic valve. Disruption of coating boundary can be observed. The coating solution boundary was irregular. c) 0 min of localized coating with water filled pneumatic valve. d) 20 min of localized coating with water filled pneumatic valve. Valve was closed all the time during the 20 minutes period. Coating boundary was stable during the coating period using water filled pneumatic valve. No bubbles were observed under the microscope.
Comparison of cell antigen-antibody interaction on cell capture
Our coating strategy was able to create well-defined cell capture areas. We first used this device to assess capture efficiency of different capture ligands using a single cell line. Although antibody-antigen affinity assays and flow cytometry can be used to predict antibody performance, an on-chip assay is a direct method for the comparison since channel dimensions, anchoring of capture molecules to the chip surface, and shear stress can be evaluated. In our study, we used the same concentration (6.25 μg/mL) of anti-CD19 and anti-CD71 to modify the channel surface. Both capture region areas were approximately 1cm x 1mm and there was a 1cm x 1mm region between the capture zones lacking any capture molecules. Ramos cells in 3% BSA solution were loaded into the microfluidic channels under flow rate of 0.1 ml/h for cell capture (See Supporting Information for cell capture images).
To compare cell capture density, the cell velocity and cell throughput should not have significant differences in order to make the comparison valid. After side channels were visually confirmed to be closed, cell velocity at the two different antibody regions was measured. The cell velocity was 0.83±0.07 mm/s at the anti-CD19 capture zone and 0.79±0.09 mm/s at the anti-CD71 capture zone (no statistical difference). Cell throughput at each area was also measured. If the majority of cells were captured at the first antibody region, the number of cells that reached second capture area will be lower. For comparison of antibody capture of the same cell line, this bias must be avoided. Cell throughput at the anti-CD19 region was 31±2 cells/s and 31±1 cells/s at anti-CD71 region, indicating no significant difference. The number of captured cells at the anti-CD19 coated region after 10 minutes of continuous collection was 840 cells, which means about one cell was captured every second. The number of captured cells was only a small portion (~4%) of total number of cells passing through the anti-CD19 coated region in 10 minutes. Therefore, cell throughput did not change significantly.
The focus of this work was the creation of multiple, individually addressable affinity coatings in a single channel. In future work, the flow rate and channel dimensions will be optimized. In addition, microstructures can be added for enhanced capture efficiency. However, if a single cell type is being tested with different antibodies, a high cell capture can be detrimental, as the preceding capture stages may deplete most of the cells, altering the concentration of cells in subsequent capture stages significantly.
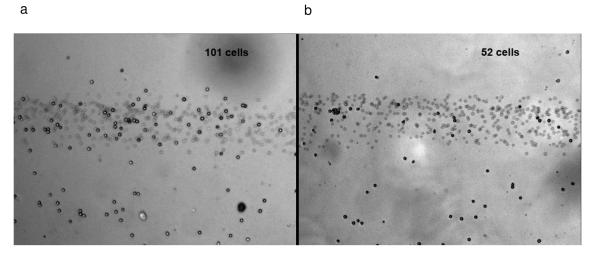
The cell capture density of anti-CD19 and anti-CD71 were compared to study the difference in capture efficiency. Representative cell capture images at both regions are shown in Fig. 3a and 3b (results are summarized in Table 1). In three trials, the cell capture density ratio of anti-cd19 to anti-cd71 was 2.44±0.13, indicating anti-cd19 has larger capture efficiency. It should be noted that the positions of the antibody zones were switched in trial 3. However, a similar density ratio was obtained, excluding the possibility that the cell capture density may be affected by the relative position of a zone to the device inlet. Cell capture under continuous flow condition is a complicated process. Both the surface antigen expression and the affinity of the bonds will affect cell capture on the surface. Flow cytometry experiments (See Supporting Information) indicate that expression of CD71 was higher on Ramos cells. Therefore a direct comparison of cell capture in the microchannel is the best way to evaluate different antibody effects on cell capture. If comparison experiments are performed in multiple single coating devices, inlet effects and cell settling during transportation must be taken into considerations, which reduces the reliability of results. In our device, cell injection conditions are the same for both antibody regions. As Table 1 indicates, our device shows reproducible cell capture that reflects the capture affinity, rather than antigen expression. The difference between the captured cell densities between trials may be due to the different concentrations of cells and conditions (e.g. surface antigen density) between trials. In addition, the difference may be due in part to the variation between each operation, such as the switching time between flow rates (for cell loading vs. cell separation). The difference between cell densities, but with similar separation ratios, underscores our chip’s advantage when comparing cell capture in a single channel.
Fig. 3.
a) Image of Ramos cells captured on an anti-CD19 coated area. Cell density was 91 cells/mm2. b) Image of Ramos cells captured on an anti-CD71 coated area in the same channel. Cells density was 39 cells/mm2. The ratio of cells on the anti-CD19 and anti-CD4 zones was consistent between experiments and was independent of antibody zone position. The band of blurred cells in the figure is from cells still moving in the flowing stream (each image is an average of five camera frames). The cell numbers of each area are shown.
Table 1.
Ramos cell capture density on anti-cd19 and anti-cd71 coated zones. Three images were taken at each zone to calculate average capture density after 10 minutes of continuous flow capture. Initial cell concentrations for trial 1, 2, 3 were 5600±1900, 7100±900, 20400±800 cells/μL, respectively. SD = Standard Deviation
| Anti-CD19 (cells/mm2) | Anti-CD71 (cells/mm2) | ||||
|---|---|---|---|---|---|
| Mean | SD | Mean | SD | CD19/CD71 | |
| Trial 1 | 91.1 | 3.4 | 38.9 | 3.0 | 2.34 |
| Trial 2 | 39.4 | 6.9 | 15.3 | 1.0 | 2.58 |
| Trial 3 | 69.5 | 3.0 | 29.1 | 3.9 | 2.39 |
The feasibility of using this device for direct comparison of antibody capture strength was demonstrated. This assay not only showed qualitative comparison of different antibody capture strength, but also provided quantitative information on cell capture density for microfluidic cell chromatography.
Selective capture of multiple cell lines from cell sample mixture
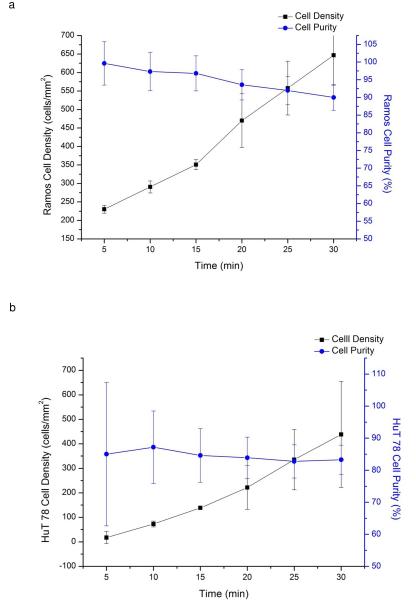
The localized coating device can also be used to capture multiple cell lines using several antibody zones in a single channel. In this study, we created anti-CD19 and anti-CD4 coated areas in the separation channel to selectively capture Ramos cells (CD19+, CD4−) and HuT 78 cells (CD4+, CD19−) from a mixture. To identify specified cells, HuT 78 cells were pre-stained with Calcein-AM. Continuous flow cell capture was performed to selectively capture Ramos or HuT 78 cells from the mixture. The cell capture density increased over time, whereas captured cells purity decreased (Figure 4a and 4b). This result is not unexpected, as longer separations can experience more nonspecific binding as the cell surface is increasingly covered with target cells [30-31]. From 5 minutes to 30 minutes, cell density increased from 230±10 to 650±80 cells/mm2 on the anti-CD19 coated area, and 20±20 to 400±200 cells/mm2 on the anti-CD4 coated area. However, the chance of colliding and trapping non-target cells would also increase due to nonspecific binding between target and non-target cells. If a non-target cell collided with the captured cells, it may decrease its flow velocity and be captured on the surface or be trapped by bound target cells. At 30 min, Ramos cell purity on the anti-CD19 coated surface was 90%, comparing with 57% in the initial mixture. In the same channel, HuT 78 cell purity on the anti-CD4 coated surface was 83%, comparing with 43% in the initial mixture.
Fig. 4.
a) Change in Ramos cell capture density (black squares) and purity (blue circles) over time, indicating the chip is capable of positive selection of target cells. As the captured cell density increases over time, the likelihood of nonspecific binding also increases as target cells cover the affinity surface. As a result, cell capture purity begins to decline at longer separation times. b) Change of HuT 78 cells capture density and purity over time. As in the case of anti-CD19 capture of Ramos cells, HuT 78 cell purity decreases at longer separation times and higher cell capture density. A mixture of Ramos cells and HuT 78 cells introduced into the chip under continuous flow conditions. The mixture concentration was 3600±1120 cell/μL; (43% HuT 78 cells).
To further enhance the cell separation purity, we compared both stop flow capture as well as washing steps after continuous flow capture. Stop flow capture will avoid excessive cell collisions, which leads to non-specific capture. On the other hand, non-specifically bound cells may be washed away under elevated flow rate after continuous flow capture since nonspecific binding is typically weaker than specific capture (see Supporting Information). The separation purity after 30 minutes of continuous flow capture was 87% and 85% for Ramos cells and HuT 78 cells, respectively. After washing at 0.2 mL/h (10 min), 0.5 mL/h (4 min), and 1 mL/h (2 min), purity increased to 98% for Ramos cells and 95 % for HuT 78 cells. With the same sample mixture, stop flow capture showed >99% and 98% purity for Ramos cells and HuT 78 cells, respectively. Both washing step after continuous collection and stop flow capture enhanced separation purity. Cell capture density was higher for continuous flow capture than stop flow capture since a larger cell sample passed through the separation channel under continuous flow conditions. The capture purity was lower for continuous flow capture than stop flow, because there is more chance for flowing cells to collide with the captured cells, leading to nonspecific binding (Supporting Information). Moreover, cell density did not show a significant difference before and after washing steps (1300+/-200 cells/mm2 and 1200+/-110 cells/mm2 on anti-CD4 coated regions, respectively). In summary, both stop flow and continuous flow affinity chromatography successfully captured cells on specific antibody coating regions with high purity in this chip. The choice between continuous flow and stop flow capture can be based on the requirement of cell density, the compatibility of other fluidic systems, and experimental needs.
Four-parameter sequential cell separations in a single channel
Four-parameter sequential cell capture was performed on a cell mixture to demonstrate the ability to perform cell capture and control experiments in a single channel. The number of parameters separated in a single channel is limited by the channel length, as well as the size of the antibody coated region and the space between regions). It is possible to scale our current approach to larger numbers of antibody capture zones, each controlled by PDMS valves.
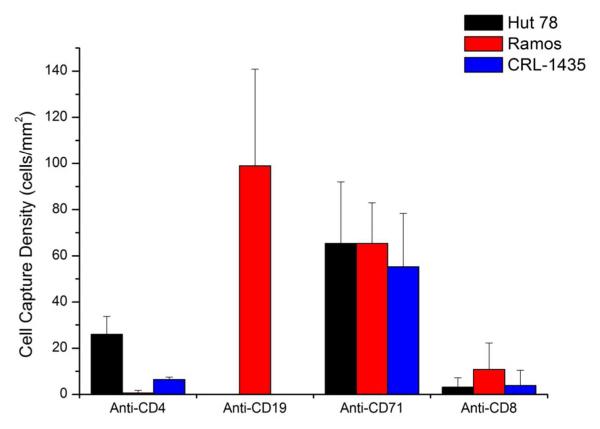
The number of coating regions can be increased by repeating the valve system as needed. To further demonstrate the extendibility of this coating strategy, we performed four-region, multi-parameter cell capture in one device. In this study, we employed three cell lines, Hut 78, Ramos and Prostate cancer cells (CRL-1435). The chip was coated with four antibodies, anti-CD19, anti-CD4, anti-CD71 and anti-CD8. Anti-CD19 and anti-CD4 region should only capture Ramos cells and Hut 78 cells, respectively. Anti-CD71 will capture all three cell lines. Anti-CD8 should capture none of them, serving as negative control. Continuous flow capture for 30 minutes was followed by a wash step (2mL/h, 2.5 minutes) to wash away non-specifically bound cells. Results were summarized in Fig. 5, showing cell capture at different regions was related to cell surface antigen expression. The purity of the anti-CD4 zone was 79 ± 14%, while the purity of the anti-CD19 zone was 100% ± 8%. The binding of cells to the anti-CD8 zone showed that there was a degree of nonspecific binding between that antibody type and the cells. In regions without antibodies, cells were not captured, indicating that the interaction was between the cells and the anti-CD8 antibodies. As expected, all three cell lines adhered to the anti-CD71 spot. In future work, we will expand the number of antibody zones, as applying this approach to blood screening, antibody testing, and a range of other applications.
Fig. 5.
Four-region, multi-parameter cell capture. A mixture of HuT 78, Ramos and Prostate cancer cells was continuously captured at 0.05 mL/h for 30 min, followed by a wash step (2 mL/h for 2.5 min). Fluorescence images were taken at each antibody coated area to calculate capture density. The purity of the anti-CD4 zone was 79 ± 14%, while the purity of the anti-CD19 zone was 100% ± 8%. The cell mixture concentration was 4600 ± 300 cells/μL; the mixture of the three cells was approximately 1:1.8:1 (Hut 78:Ramos:CRL-1435). Error bars represent the standard deviation of three different microscope fields of view in the same antibody coated region.
Sequential capture CD4+ and CD19+ cells in blood sample
Multi-parameter sequential capture of cells in blood sample was also performed. Anti-CD4 and anti-CD19 coating regions were established in the main channels to selectively capture CD4+ and CD19+ cells, respectively. The average number of captured cells for the anti-CD4 and anti-CD19 regions was 360 ± 40 cells/μL and 130 ± 70 cells/μL, respectively. The average capture specificity of three trials for anti-CD4 and anti-CD19 region was 99.1 ± 0.4% and 97 ± 2%, respectively (Table 2). This high capture purity with a lysed blood sample indicates that this chip design and separation method can be used for blood analysis without the artifacts introduced by multiple flow channels.
Table 2.
Blood cell separations using the multi-affinity region chip. Purity exceeded 97% for lysed blood samples, with >50% capture efficiency.
| Anti-CD4 Region | Anti-CD19 Region | |
|---|---|---|
| Captured Target Cells/μL * | 360 ± 40 | 130 ± 70 |
| Total Cells/μL | 370 ± 30 | 130 ± 70 |
| Lot-certified cells/μL** | 707 | 214 |
| Capture Purity (%) | 99.1 ± 0.4 | 97 ± 2 |
| Capture Efficiency (%) | 51% | 61% |
For anti-CD4 Regions, CD4+ lymphocytes and CD4+ monocytes will be collected in this study.
Cell concentrations certified by manufacturer.
The efficiency of blood cell capture was determined based on the number of cells capture/ μL compared to the theoretical number derived from the lot number of the blood sample. The capture efficiency of CD4+ leukocytes (both CD4+ T lymphocytes and CD4+ monocytes) was 51%. The capture efficiency of CD19+ B cells was 61%. The differences in capture efficiency between cell types can be attributed to differences in antigen density and antigen-antibody bond strength. In cell affinity chromatography, cells are retained in a flowing stream if the force of the affinity bonds exceeds the shear force [3]. The force of the affinity capture is the product of the number of bonds formed and the average force of an antigen-antibody bond. Therefore it is difficult to predict separation efficiency, as a particularly strong antibody-antigen bond may be more influential than antigen density alone. The capture purity and efficiency would also be affected by the total number of cells injected into the chip. For stop flow capture in this work the cell concentration was 6550 ± 570 cells/μL, as measured by hemacytometer.
Zone-selective cell assays after separation
After cells were captured on the surface, reagents could be loaded into the localized coated sections for various types of cellular analysis. Different capture zones can be exposed to the same or different chemicals to study cell response in a single microfluidic device. To test the reagent delivery approach and fluorescence detection in this device, we used 70% ethanol to induce cell death in selected capture zones. Cell viability was determined by propidium iodide (PI) exclusion. Stop flow separations were performed to selectively capture Ramos and HuT 78 cells on their respective regions. 70% ethanol with PI was then introduced into the anti-CD4 coated area while 3% BSA in PBS buffer was delivered to the anti-CD19 coated area. Both the ethanol solution and buffer solution contained 10 μg/mL PI. After washing away the unbound cells, valves on the main channel were closed to confine reagent flow. Ethanol solution was loaded into anti-CD4 coated area from side channel and directed out via the other side channel, while 3% BSA buffer was introduced through the anti-CD19 coated area simultaneously.
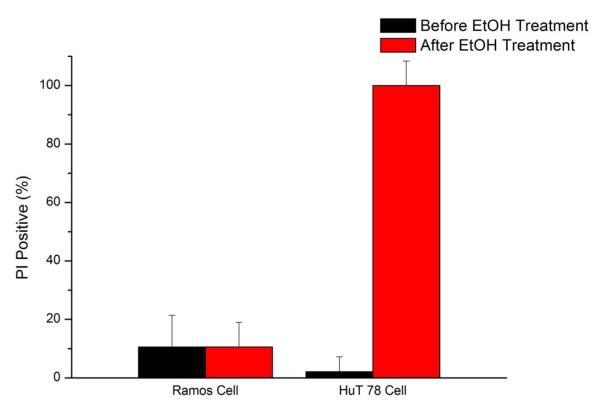
Though cell death induced by ethanol can be detected immediately, ethanol flow was maintained for 10 minutes to check whether the reagent delivery is stable and ethanol will leak into anti-CD19 coated area. Figure 6 showed the PI positive cells in both the anti-CD19 and anti-CD4 areas after 20 minutes of reagent loading. Cells were all dead at the anti-CD4 zone area, whereas cell viability was maintained at the anti-CD19 zone. This result showed the fluidic network was capable of delivering different reagents to different coating areas after cells capture. Ethanol leakage into buffer loading area was not detected in this device, as cells viability did not show significant changes. Ethanol is an effective cell killing reagent; even if small amount of ethanol leaked into the anti-CD19 area it would cause significant cell death. We showed under mild reagent loading speed (0.2 mL/h) reagent loading was stable and no cross-contamination was found.
Fig. 6.
Selective exposure of reagents to a single antibody region. Ethanol (70%) was exposed to the anti-CD4 zone while buffer was exposed to the anti-CD19 zone. Propidium iodide staining indicated that all cells were killed by ethanol in the anti-CD4 zone, while viability was not affected in the anti-CD19 zone. The control valves were able to direct reagent flow only to the desired antibody zone, preventing leakage into other parts of the chip. Using this approach, multi-parameter cell separations can be followed by selective reagent treatment after cell isolation. Error bars represent the relative counting error.
It was worth noting that the channel geometry used in this study is not optimized for valve operation. Channels are rectangular in our device as the SU-8 mold will not reflow after high temperature baking to form round shaped channels. It was reported that round channels can be closed more effectively by pneumatic valves [32]. However, rectangular channels used in this study can be closed effectively, as reagent leakage was not found in both reagent coating and reagent loading steps with closed valves. This result is reasonable because valves were not exposed to significant pressure, since the volumetric flow rate applied in this study was low (0.2 mL/h). The mild flow rate in this study is also typical for cell separation assays, as higher shear stress may be harmful to the cells. For the applications that require higher flow rate, round channels may be a better choice to prevent reagents from leaking through the valves.
Conclusion
In this study, we presented a chip capable of multi-parameter cell analysis based on label-free cell separation. The chip was capable of separation using a single channel, with zone-selective reagent delivery after separation possible. In future work, it will be possible to sort cells as well, using a single channel to separate cells but collecting them from individual capture zones independently.
Operating cell separations in tandem (sequential) or parallel arrangement should depend on the actual application, as in this work the tandem connection is better for comparing capture molecule affinity against one cell type, for each capture region experiences the same flow rate effects, also can be individually addressable. Single serial channels are better for comparing capture molecule affinity against one cell type, for each capture region experiences the same flow rate effects.
This method is also a flexible approach, as the modification region is defined by the number and position of valves, which makes it compatible with various fluidic network designs and applications. The use of a single channel for multi-parameter sequential cell separations eliminates differences in flow rate for parallel devices, and also opens up the possibility of performing serial separations in the future, where cells captured in one antibody zone are further separated by subsequent zones.
Supplementary Material
Acknowledgement
Y.G. would like to acknowledge support by a Provost’s Fellowship. This work was supported by grants from the National Institutes of Health (Grant RR025782 and GM103550) and the Robert A. Welch Foundation (Grant D-1667).
References
- [1].Arora A, Simone G, Salieb-Beugelaar GB, Kim JT, Manz A. Anal. Chem. 2010;82:4830–4847. doi: 10.1021/ac100969k. [DOI] [PubMed] [Google Scholar]
- [2].Sharma SK, Mahendroo PP. J. Chromatogr. 1980;184:471–499. doi: 10.1016/s0021-9673(00)93875-5. [DOI] [PubMed] [Google Scholar]
- [3].Pappas D, Wang K. Anal. Chim. Acta. 2007;601:26–35. doi: 10.1016/j.aca.2007.08.033. [DOI] [PubMed] [Google Scholar]
- [4].Yu M, Stott S, Toner M, Maheswaran S, Haber DA. J. Cell Biol. 2011;192:373–382. doi: 10.1083/jcb.201010021. [DOI] [PMC free article] [PubMed] [Google Scholar]
- [5].Kruger J, Singh K, O’Neill A, Jackson C, Morrison A, O’Brien P. J. Micromech. Microeng. 2002;12:486–494. [Google Scholar]
- [6].Yamada M, Seki M. Lab Chip. 2005;5:1233–1239. doi: 10.1039/b509386d. [DOI] [PubMed] [Google Scholar]
- [7].Takagi J, Yamada M, Yasuda M, Seki M. Lab Chip. 2005;5:778–784. doi: 10.1039/b501885d. [DOI] [PubMed] [Google Scholar]
- [8].Di Carlo D, Wu LY, Lee LP. Lab Chip. 2006;6:1445–1449. doi: 10.1039/b605937f. [DOI] [PubMed] [Google Scholar]
- [9].Manbachi A, Shrivastava S, Cioffi M, Geun CB, Moretti M, Demirci U, Yliperttula M, Khademhosseini A. Lab Chip. 2008;8:747–754. doi: 10.1039/b718212k. [DOI] [PMC free article] [PubMed] [Google Scholar]
- [10].Nilsson J, Evander M, Hammarstreom B, Laurell T. Anal. Chim. Acta. 2009;649:141–157. doi: 10.1016/j.aca.2009.07.017. [DOI] [PubMed] [Google Scholar]
- [11].Marek R, Caruso M, Rostami A, Grinspan JB, Sarma JD. J. Neurosci. Methods. 2008;175:108–118. doi: 10.1016/j.jneumeth.2008.08.016. [DOI] [PubMed] [Google Scholar]
- [12].Issadore D, Shao H, Chung J, Newton A, Pittet M, Weissleder R, Lee H. Lab Chip. 2011;11:147–151. doi: 10.1039/c0lc00149j. [DOI] [PMC free article] [PubMed] [Google Scholar]
- [13].Sim TS, Kwon K, Park JC, Lee J, Jung H. Lab Chip. 2011;11:93–99. doi: 10.1039/c0lc00109k. [DOI] [PubMed] [Google Scholar]
- [14].Chen C, Chen K, Pan Y, Lee T, Hsiung L, Lin C, Chen C, Lin C, Chiang B, Wo AM. Lab Chip. 2011;11:474–483. doi: 10.1039/c0lc00332h. [DOI] [PubMed] [Google Scholar]
- [15].Stotta SL, Hsua C, Tsukrova DI, Yu M, Miyamotod DT, Waltmand BA, Rothenbergd SM, Shaha AM, Smasd ME, Korira GK, Floyd FP, Gilmand AJ, Lordd JB, Winokurd D, Springerd S, Irimia D, Nagratha S, Sequistd LV, Leed RJ, Isselbacherd KJ, Maheswaran S, Haberd DA, Toner M. Proc. Natl. Acad. Sci. USA. 2010;107:18392–18397. doi: 10.1073/pnas.1012539107. [DOI] [PMC free article] [PubMed] [Google Scholar]
- [16].Xu Y, Phillips JA, Yan JL, Li Q, Fan ZH, Tan W. Anal. Chem. 2009;81:7436–7442. doi: 10.1021/ac9012072. [DOI] [PMC free article] [PubMed] [Google Scholar]
- [17].Cheng X, Irimia D, Dixon M, Sekine K, Demirci U, Zamir L, Tompkins RG, Rodriguez W, Toner M. Lab Chip. 2007;7:170–178. doi: 10.1039/b612966h. [DOI] [PMC free article] [PubMed] [Google Scholar]
- [18].Nagrath S, Sequist LV, Maheswaran S, Bell DW, Irimia D, Ulkus L, Smith MR, Kwak EL, Digumarthy S, Muzikansky A, Ryan P, Balis UJ, Tompkins RG, Haber DA, Toner M. Nature. 2007;450:1235–1239. doi: 10.1038/nature06385. [DOI] [PMC free article] [PubMed] [Google Scholar]
- [19].Wang S, Liu K, Liu J, Yu ZT-F, Xu X, Zhao L, Lee T, Lee EK, Reiss J, Lee Y-K, Chung LWK, Huang J, Rettig M, Seligson D, Duraiswamy KN, Shen CK-F, Tseng H-R. Angew. Chem. Int. Ed. 2011;50:3084–3088. doi: 10.1002/anie.201005853. [DOI] [PMC free article] [PubMed] [Google Scholar]
- [20].Dharmasiri U, Njoroge SK, Witek MA, Adebiyi MG, Kamande JW, Hupert ML, Barany F, Soper SA. Anal. Chem. 2011;83:2301–2309. doi: 10.1021/ac103172y. [DOI] [PMC free article] [PubMed] [Google Scholar]
- [21].Pappas D. Practical Cell Analysis. Wiley-Blackwell; 2010. [Google Scholar]
- [22].Nalayanda DD, Kalukanimuttam M, Schmidtke DW. Biomed. Microdevices. 2007;9:207–214. doi: 10.1007/s10544-006-9022-6. [DOI] [PubMed] [Google Scholar]
- [23].Didara TF, Tabrizian M. Lab Chip. 2010;10:3043–3053. doi: 10.1039/c0lc00130a. [DOI] [PubMed] [Google Scholar]
- [24].Wilbur JL, Kumar A, Kim E, Whitesides GM. Adv. Mater. 1994;6:600–604. [Google Scholar]
- [25].Xia Y, Whitesides GM. Langmuir. 1997;13:2059–2067. [Google Scholar]
- [26].Trinkle CA, Lee LP. Lab Chip. 2011;11:455–459. doi: 10.1039/c0lc00095g. [DOI] [PubMed] [Google Scholar]
- [27].Sin A, Murthy SK, Revzin A, Tompkins RG, Toner M. Biotechnol. Bioeng. 2005;91:816–826. doi: 10.1002/bit.20556. [DOI] [PubMed] [Google Scholar]
- [28].Plouffe BD, Njoka DN, Harris J, Liao J, Horick NK, Radisic M, Murthy SK. Langmuir. 2007;23:5050–5055. doi: 10.1021/la0700220. [DOI] [PubMed] [Google Scholar]
- [29].Green JV, Murthy SK. Lab Chip. 2009;9:2245–2248. doi: 10.1039/b906768j. [DOI] [PubMed] [Google Scholar]
- [30].Li P, Tian Y, Pappas D. Anal. Chem. 2011;83:774–781. doi: 10.1021/ac102975g. [DOI] [PMC free article] [PubMed] [Google Scholar]
- [31].Li P, Gao Y, Pappas D. Anal. Chem. 2011;83:7963–7869. doi: 10.1021/ac201752s. [DOI] [PMC free article] [PubMed] [Google Scholar]
- [32].Unger MA, Chou H-P, Thorsen T, Scherer A, Quake SR. Science. 2000;288:113–116. doi: 10.1126/science.288.5463.113. [DOI] [PubMed] [Google Scholar]
- [33].Jing R, Bolshakov VI, Flavell AJ. Nat. Protoc. 2007;2:168–177. doi: 10.1038/nprot.2006.408. [DOI] [PubMed] [Google Scholar]
- [34].Wang K, Marshall MK, Garza G, Pappas D. Anal. Chem. 2008;80:2118–2124. doi: 10.1021/ac702553w. [DOI] [PubMed] [Google Scholar]
- [35].Liu Y, Bae SW, Wang K, Hong J-I, Zhu Z, Tan W, Pappas D. Anal. Chim. Acta. 2010;673:95–100. doi: 10.1016/j.aca.2010.05.017. [DOI] [PubMed] [Google Scholar]
Associated Data
This section collects any data citations, data availability statements, or supplementary materials included in this article.


