

Abstract
The polycyclic aromatic hydrocarbon (PAH), benzo[a]pyrene (BaP), was compared to dibenzo[def,p]chrysene (DBC) and combinations of three environmental PAH mixtures (coal tar, diesel particulate and cigarette smoke condensate) using a two stage, FVB/N mouse skin tumor model. DBC (4 nmol) was most potent, reaching 100% tumor incidence with a shorter latency to tumor formation, less than 20 weeks of 12-O-tetradecanoylphorbol-13-acetate (TPA) promotion compared to all other treatments. Multiplicity was 4 times greater than BaP (400 nmol). Both PAHs produced primarily papillomas followed by squamous cell carcinoma and carcinoma in situ. Diesel particulate extract (1 mg SRM 1650b; mix 1) did not differ from toluene controls and failed to elicit a carcinogenic response. Addition of coal tar extract (1 mg SRM 1597a; mix 2) produced a response similar to BaP. Further addition of 2 mg of cigarette smoke condensate (mix 3) did not alter the response with mix 2. PAH-DNA adducts measured in epidermis 12 h post initiation and analyzed by 32P post- labeling, did not correlate with tumor incidence. PAH- dependent alteration in transcriptome of skin 12 h post initiation was assessed by microarray. Principal component analysis (sum of all treatments) of the 922 significantly altered genes (p<0.05), showed DBC and BaP to cluster distinct from PAH mixtures and each other. BaP and mixtures up-regulated phase 1 and 2 metabolizing enzymes while DBC did not. The carcinogenicity with DBC and two of the mixtures was much greater than would be predicted based on published Relative Potency Factors (RPFs).
Keywords: PAHs, Cyp1a1, Cyp1b1, adducts, relative potency factor, skin1
Introduction
Polycyclic aromatic hydrocarbons (PAHs) are planar aromatic compounds with varying potencies of carcinogenicity defined by their individual structures (IARC, 2010). PAHs occur naturally in the environment in fossil fuels such as coal, oil, and tar and are considered environmental pollutants formed during incomplete combustion (coal, tobacco, diesel, asphalt, creosote, gasoline, wood smoke, etc.) leading to their presence in air, food and soils (Lijinsky, 1991; Weissenfels et al., 1992; Lewtas, 2007; Ding et al., 2011). PAHs occur in the environment typically as mixtures covering a spectrum from non-toxic compounds to potent carcinogens (Baird et al., 2005; Mao et al., 2007; Allan et al., 2012; Wickramasinghe et al., 2012). Different types of combustion result in different compositions of PAHs both in relative amounts and individual PAHs present (Poster et al., 2000). Occupational exposure to PAH mixtures in aluminum production, iron and steel foundries, fossil fuel processing, wood impregnation, roofing and road sealing can pose risks for lung, skin, and bladder cancers (Boffetta et al., 1997; IARC, 2010; Cogliano et al., 2011). Epidemiological studies support a relationship between dermal exposure to PAHs and skin cancers (Boffetta et al., 1997; Marczynski et al., 2009; IARC, 2010). One of the most common cancers in Caucasian populations is non-melanoma skin cancer, recently reported to be on the rise throughout the world (Lomas et al., 2012). Benzo[a]pyrene (BaP), the most extensively studied carcinogenic PAH, is classified by IARC as a Group 1 or known human carcinogen (IARC, 2010). Four of the top ten priority pollutants, designated by the Agency for Toxic Substances and Disease Registry (ATSDR) in 2011, are single PAHs or PAH mixtures (PAHs, BaP, benzo[b]fluoranthene, and dibenzo[a,h]anthracene) (ATSDR, 2011).
PAHs are carcinogenic in a number of animal models with multiple targets, including skin (Nesnow et al., 1998; Arif et al., 1999; Darwiche et al., 2007; Courter et al., 2008; IARC, 2010; Wester et al., 2011). Our laboratories have documented that dibenzo[def,p]chrysene (DBC), formerly referred to as dibenzo[a,l]pyrene, is a potent carcinogen in mice (Marston et al., 2001; Yu et al., 2006; Mahadevan et al., 2007a; Castro et al., 2008a). Oral administration results in tumors of the liver, lung, breast, ovaries and hematopoietic tissue. DBC can also be an effective transplacental carcinogen (Yu et al., 2006a; 2006b;Castro et al., 2008a; 2008b; Guttenplan et al., 2011; Chen et al., 2012; Shorey et al., 2012).
PAHs require bioactivation through metabolism in order to be mutagenic, carcinogenic or teratogenic to target cellular macromolecules (Baird and Mahadevan, 2004; IARC, 2010). With higher molecular weight PAHs, such as BaP and DBC containing a “bay” and/or “fjord” region, respectively, the most well characterized bioactivation pathway has been cytochrome P450 (CYP)- dependent epoxygenation, hydrolysis by epoxide hydrolase and a second CYP epoxygenation to the 7,8-dihydrodiol-9,10 epoxide (BPDE) in the case of BaP, and to the 11,12-dihydrodiol-13,14 epoxide (DBCDE) in the case of DBC (Shou et al., 1996; Xue and Warshawsky, 2005; Shimada, 2006). Hydrolysis of the initial epoxide produces two trans stereoisomers and the second epoxygenation can be above or below the plane of the ring; thus, four possible BPDEs or DBCDEs are produced. (Figure 1.) With BaP, the most mutagenic and carcinogenic BPDE is thought to be (+)-7,8-anti-9,10-BPDE. PAHs such as BaP and DBC can also be bioactivated through 1-electron oxidations (peroxidases) producing radical cations (Cavalieri and Rogan 1992;1995), predominantly at the 1,6- and 3,6-positions. Once formed these radical cations may bind to DNA. The role of aldo-keto reductases (AKRs) in bioactivation of PAHs has also been demonstrated (Penning et al., 1996; Palackal et al., 2001; 2002). AKRs effectively convert the PAH dihydrodiol to a catechol. As with other catechols, a redox-cycling can then occur through 1-electron reactions to the semi-quinone and quinone. These reversible reactions generate superoxide anion radical and other reactive oxygen species (ROS) and can also directly react with nucleophilic sites on DNA. The metabolism of PAHs through peroxidative and AKR-mediated pathways is consistent with oxidative stress- associated PAH toxicity (Kumar et al., 2012).
Fig. 1.
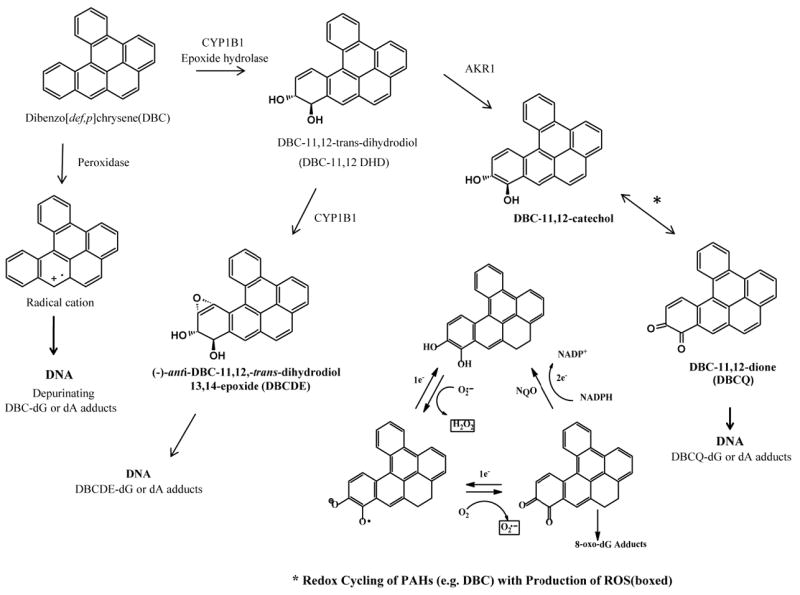
Metabolic pathways for bioactivation of PAHs using the fjord containing dibenzo[def,p]chrysene as an example. From left to right, the peroxidase pathway resulting in radical cations which may be capable of forming DNA adducts. The most well characterized P450 CYP dependent epoxygenation hydrolysis by epoxide hydrolase shows one of two (+) and (-) trans- DBC-11,12 DHD products followed by epoxygenation to one of four DBCDE products capable of adducting to macromolecules such as DNA. Also shown is the AKR pathway producing semi-quinones and quinones. *These reversible reactions can produce radical oxygen species resulting in additional oxidative stress.
The most important CYPs in PAH metabolism are CYP1A1, CYP1A2, CYP1B1, and to a lesser extent CYP2C9 and CYP3A4 (Shimada, 2006). Recent evidence from our laboratories and others has suggested that CYP1B1 plays a predominant role in the toxicity and carcinogenicity of both BaP and DBC in the mouse (Uno et al., 2006; Castro et al., 2008a).
The murine two-stage skin tumor model has been used extensively to investigate mechanisms of carcinogenesis (Cavalieri et al., 1991; Higginbotham et al., 1993) and the inbred FVB strain has been shown to be suitable for initiation/promotion studies (Hennings et al., 1993). This model is a powerful tool for studying early indicators of “high risk” papillomas that can develop into invasive squamous cell carcinomas (Glick et al., 2007). The vast majority of cancer studies in animal models have tested single PAHs. Unfortunately this is incongruous with the complex mixtures of PAHs to which human populations are exposed. In this study we sought to examine the relative potency of BaP and DBC, compared to combinations of some environmentally relevant PAH mixtures. We hypothesized that early PAH-dependent alterations in the transcriptome of mouse epidermis following initiation could be correlated with DNA adduct formation at the same time point and predict probable tumor outcomes. The EPA is currently evaluating the potential of a Relative Potency Factor (RPF) approach in estimating risk for exposure to PAH mixtures. Our results demonstrate that, at least with respect to skin cancer following dermal exposures, the RPF markedly underestimates DBC and PAH mixture potency. Furthermore, alterations in gene expression 12 h post-initiation suggest the strong possibility that these PAH treatments are acting through multiple and distinct mechanisms.
Materials and methods
Caution: BaP and DBC are potent carcinogens and should be handled in accordance with National Cancer Institute (NCI) guidelines. All pure PAHs and mixtures were prepared under UV depleted light.
Chemicals
BaP and DBC were purchased from Midwest Research Institute (Kansas City MO). Diesel particulate (SRM 1650b), and coal tar extract (CTE, SRM 1597a) were purchased from the National Institute of Standards & Technology, Gaithersburg, MD. Cigarette smoke condensate (CSC) was a gift from Dr. Hollie Swanson, University of Kentucky. RNases, proteinase K, and Trizol® were purchased from Life Technologies™ (Invitrogen, Grand Island, N.Y). Dichloromethane, toluene, acetone, and DMSO were obtained from Fisher Scientific (Pittsburgh, PA). All other reagents were purchased from Sigma-Aldrich (St. Louis, MO).
Preparation of PAH mixtures
Diesel particulate, SRM 1650b, (200 mg) was placed in a 25 × 80 mm thimble, Schleicher & Schull # 350217 (Keene, N.H.) and extracted with 200 ml dichloromethane in a Soxhlet apparatus at 40° C for 24 h. The final extract was concentrated and exchanged into toluene, and evaporated with N2 gas to a final volume of 10 ml. An aliquot was diluted with toluene containing 5% DMSO to make PAH mix 1 equivalent to 5 mg/ml diesel particulate extract (DPE). CTE SRM 1597a, was concentrated to 10 mg/ml by evaporating with a stream of N2 gas. PAH mix 2 (DPE+CTE) contained 5 mg/ml DPE and 5 mg/ml CTE. CSC was received as a 40 mg/ml stock solution in DMSO. In order to keep the final DMSO concentration at or below 5%, CSC was evaporated in a Savant Speed Vac centrifuge to 200 mg/ml and was diluted to 40 mg/ml with toluene. PAH mix 3 was comprised of mix 2 plus 10 mg/ml cigarette smoke condensate (DPE +CTE + CSC).
Skin tumor study
All procedures were conducted according to National Institutes of Health guidelines and were approved by the Oregon State University Institutional Animal Care and Use Committee. Six-week-old, female FVB/N inbred mice were obtained from the NCI-Fredrick’s Animal Production Program (Frederick, MD). Most of the historical skin tumor data from our laboratory has been done with the Sencar mouse. The FVB/N strain was chosen because an inbred strain is more suitable for gene profiling, it has been proven to give a robust tumor response to chemically initiated carcinogenesis and could be readily backcrossed into specific knockout or transgenic mouse models for future studies. Mice were acclimated for ten days and fed AIN93-G pellets, Research Diets, Inc. (New Brunswick, N.J.) throughout the experiment. Animals were housed in micro-ventilated racks, four animals per cage on a standard 12 h light/dark cycle, at 22°C and 40-60% humidity. At 7.5 weeks of age, mice were shaved on their dorsal surface and allowed to rest 48 h to confirm that animals were in the resting phase of the hair growth cycle. The following initiation treatments were applied to groups of 36 mice by slowly pipetting solutions on the shaved area; toluene vehicle control (200 μl), BaP 400 nmol (100 μg), DBC 4 nmol (1.2 μg), DPE 1 mg (mix 1), DPE 1 mg + CTE 1 mg (mix 2), or DPE 1 mg + CTE 1 mg + CSC 2 mg (mix 3). In order to handle the large sample sizes, mice were shaved and initiated in three different cohorts separated by a one week start time. Multiple animals for all treatments were included within each cohort. Two weeks post-initiation, a 25-week promotion regimen was begun, treating animals twice weekly with 12-O-tetradecanoylphorbol-13-acetate (TPA), 6.5 nmol in 200 μl acetone. Mice were observed and tumor incidence recorded weekly throughout the 25-week promotion interval. Following promotion, all animals were euthanized and necropsied. Skin tumors were removed and immediately fixed in buffered formalin. Trimmed tumors were embedded in paraffin. Haematoxylin and eosin-stained sections were analyzed by histopathology to determine degree of progression from papilloma to squamous cell carcinoma.
DNA extraction from PAH-treated epidermis
For measurement of DNA adduct levels, groups of 10 mice were treated with initiators as above and euthanized 12 h post-treatment by a combination of CO2 and cervical dislocation. Epidermal cells were harvested using the method of (Slaga et al., 1974). Shaved dorsal skin was removed and treated with Nair™ depilatory cream (Church & Dwight Inc., Princeton, N.J.) for 8 min to remove hair from follicles. Skin was wiped with sterile water and submerged in a 58°C water bath for 30 s then submerged in an ice water bath to loosen the epidermal layer. Epidermal cells were scraped away from the dermis with a razor blade and snap frozen in liquid N2. Samples from two mice were pooled and homogenized in 0.5 ml buffer (5 mM Tris, 5 mM EDTA,100 mM NaCl, 2 mM CaCl2, 1% (w/v) SDS, pH 8.0) using a Tissue Tearor™ (BioSpec Products, Inc. Bartlesville, OK). Homogenates were treated with 10 μl RNase, (DNase free 50 U/ml) and 10 μl RNase T1 (1000 U/ml) and incubated at 37°C for 1 h followed by addition of 20 μl of proteinase K (20 mg/ml) and incubated at 55° C for 2 h. DNA was extracted with 25:24:1 phenol:chloroform:isoamyl alcohol, precipitated with 100% ethanol, washed with 75% ethanol, and dissolved in DNase-free water.
DNA adducts analysis by 32P-postlabeling
DNA adduct formation was measured for each sample using the nuclease P1 enrichment version of the 32P-postlabeling method as described previously (Phillips and Arlt, 2007; Arlt et al., 2008). Briefly, DNA samples (4 μg) were digested with micrococcal nuclease (120 mU, Sigma, UK) and calf spleen phosphodiesterase (40 mU, Calbiochem, UK), enriched and labelled as reported. Solvent conditions for the resolution of 32P-labelled adducts on polyethyleneimine-cellulose thin-layer chromatography (TLC; Macherey-Nagel, Düren, Germany) were: D1, 1.0 M sodium phosphate, pH 6.0; D3, 4 M lithium-formate, 7 M urea, pH 3.5; D4, 0.8 M lithium chloride, 0.5 M Tris, 8.5 M urea, pH 8.0. DNA adduct levels were calculated from the adduct dpm, the specific activity of [γ-32P]ATP (Hartmann-Analytic, Braunschweig, Germany) and the amount of DNA (pmol of DNA) used. As in prior studies, total DNA adduct levels were measured in the diagonal radioactive zone (DRZ) area of the TLC plates and were considered representative of PAH-DNA and other aromatic/hydrophobic adducts resistant to nuclease P1 digestion (Tang et al., 2001). The method provides a summary measure of a complex mixture of adducts present in the postlabeling chromatograms. Results were expressed as DNA adducts/108 nucleotides. An external BPDE-DNA standard was employed for identification of adducts in experimental samples (Phillips and Castegnaro, 1999).
RNA extraction from PAH-treated skin
Five mice per treatment group were given one initiation dose using the same techniques and treatments as described in the tumor study. Shaved skin was harvested 12 h after treatment and RNA extracted for gene expression analysis. In order to eliminate RNase degradation, epidermis and dermis layers were kept intact, removed as one piece and snap frozen in liquid nitrogen. A 1-cm2 section of frozen skin was placed in a 15-ml sterile, disposable conical homogenizer, VWR Scientific Inc. (San Francisco, CA.) and homogenized in 2 ml Trizol® reagent. RNA was extracted according to the manufacturer’s instructions followed by a clean-up step using an RNeasy® mini kit, Qiagen Corp. (Valencia, CA.). RNA was quantitated on a Nanodrop spectrophotometer, Thermo Scientific (Wilmington, DE.). Acceptable A260/A280 ratios were 1.9-2.2. Sample quality was confirmed by examining18S and 28S peaks using an Agilent Technologies Bioanalyzer 2100 (Santa Clara, CA.); RNA samples with relative integrity numbers of 6.5 or greater were used in array analysis.
Gene profiling with Agilent microarrays
The RNA was labeled with Agilent’s 2 color Quickamp kit and the platform utilized was the Agilent 8X60 K mouse array.
Statistical analysis
Time to first tumor was initially compared across the six treatments using the Wilcoxon and Log-rank tests followed by pairwise comparisons (with Tukey adjustment) in the SAS Lifetest procedure version 9.3, SAS Institute, Cary, NC. For the 4 treatments with greater than 10% incidence a more complex and conservative shared frailty model was also fit due to evidence of differences in treatment effects across the cohorts in the study. The model was fit with the SAS Phreg (Proportional Hazards regression) procedure with the random clusters being the treatment groups within each cohort. Because all treatment differences are either very large or very small, the conclusions did not change using the more complex model and only the simpler initial tests results are shown. The four treatments (BAP, DBC, Mix 2 and Mix3) with more than 1 tumor-bearing animal (TBA) were compared with respect to their tumor multiplicity per TBA. The exact Kruskal-Wallis (K-W) rank test (SAS npar1way procedure) was used to compare multiplicity for three of the treatments (BAP, Mix 2 and Mix 3) because no evidence was found of cage or cohort differences within those treatments (p>0.3 all 3 K-W tests). DBC multiplicity was compared to the other three treatments with more conservative tests due to evidence of cage differences within that treatment (p<0.005 K-W test). The more conservative and approximate model was a linear mixed model with log of multiplicity as the response and heterogeneous random cage effects that are allowed to be different for the DBC treated group (SAS Mixed procedure).
Quality control analysis was performed on preprocessed data in GeneSpring v.11 (Silicon Genetics) software using feature intensity distributions from Box-whisker plots to determine interquartile range span and median intensity value across the experiment. The intra-group versus between-group comparisons were made using correlation matrix plots, followed with principle components analysis to determine potential outliers. Raw Agilent intensity data were background subtracted and quantile-normalized by RMA summarization as described by (Bolstad et al., 2003). Statistical analysis was performed by one-way ANOVA for unequal variances (Welch’s ANOVA) with Tukey’s posthoc test and 5% FDR. Unsupervised bidirectional hierarchical clustering of microarray data were performed using Euclidean distance metric and centroid linkage clustering to group treatments and gene expression patterns by similarity. Principal components analysis was performed on condition using non-transformed normalized intensity values. The clustering algorithms, heat map visualizations and centroid calculations were performed in GeneSpring software based on log2 expression ratio values. Functional analysis was performed in Bioinformatics Resource Manager v2.3 (Shah et al., 2007) using the DAVID functional annotation tool (Huang da et al., 2009), which utilizes the Fisher Exact test to measure gene enrichment in biological process Gene Ontology (GO) category terms for significant genes compared to background, which included all genes on the Agilent platform.
Results
Time to tumor, multiplicity, and progression
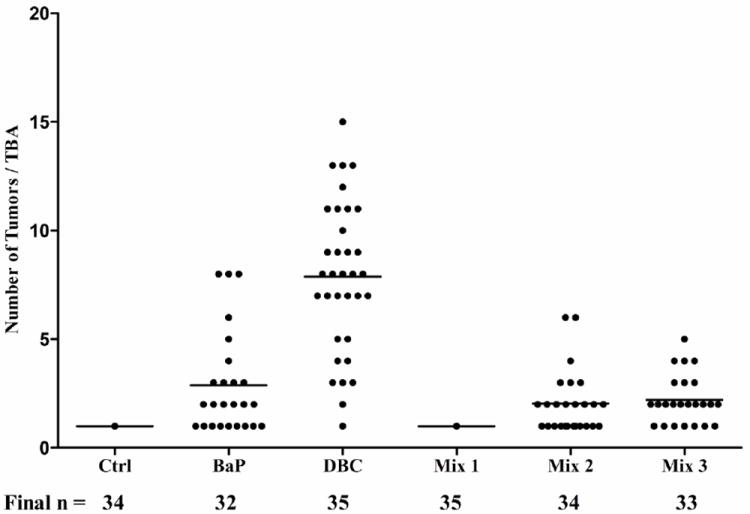
Toluene control and diesel extract (mix 1) treatment groups were similar in time to tumor (p>0.5). These two treatments were also very different from the other treatments (p<0.0001 for all pairwise comparisons). BaP and the remaining two mixtures, DPE + CTE (mix 2), and DPE + CTE+ CSC (mix 3), had similar outcomes to one another for time until tumor event (p>0.5 all 3 pairwise comparisons) and were different from controls (p<0.001), DPE (p<0.001) and DBC (p<0.001) (Figure 2). Control and mix 1 produced only one papilloma in the entire group (3% incidence) by the end of twenty weeks of promotion and therefore were not used in statistical modeling of tumor multiplicity. BaP, mix 2 and mix 3, were also similar in tumor multiplicity with 2.88 ± 2.33, 2.03 ± 1.42, and 2.21 ± 1.14 tumors per tumor-bearing animal, respectively (Figure 3). DBC was different from all the other treatments with respect to time to tumor formation (p<0.001, Figure 2) and multiplicity, 7.88 ± 3.48 tumors per tumor-bearing mouse (Figure 3). Tumor progression was assessed from initial hyperplasia and classified as dysplasia, papilloma, carcinoma in situ, or squamous cell carcinomas (Figures 4 and 5). With only one papilloma, DPE application to the skin did not elicit a carcinogenic response. The overall trend was again seen with respect to a similarity between BaP (32 mice), mix 2 (34 mice) and mix 3 (33 mice) with hyperplasia in 14, 14, and 12 animals; papillomas in 25, 25, and 27 animals; and carcinoma in situ in 8, 2, and 6, animals, respectively. BaP treatment resulted in a slightly higher incidence of squamous cell carcinomas (17) compared to mix 2 and mix 3 (10 and 7, respectively). DBC was far more potent, producing 37 total hyperplasias and 125 papillomas. Although the total number of all tumor types was greater with DBC, the rate of progression from papilloma to carcinoma in situ and squamous cell carcinoma showed similar ratios as BaP, 28 cases of carcinoma in situ and 75 squamous cell carcinomas.
Fig.2.

Kaplan-Meier estimation of percent tumor bearing animals throughout 25 wk of promotion with TPA (6.5 nmol/200 μl), twice weekly starting two weeks post initiation. Initiation doses were 200 μl toluene (Ctrl), 400 nmol (100 μg) BaP, 4 nmol (1.2 μg) DBC, 1 mg DPE (mix 1), 1 mg DPE + 1 mg CTE (mix 2), and 1 mg DPE + 1 mg CTE + 2 mg CSC (mix 3). Individuals that died tumor free before the end of 25 weeks and those that were tumor free at the end of 25 weeks were censored and are indicated by an *.
Fig. 3.
Tumor multiplicity in tumor-bearing animals (TBA, female FVB/N mice) with at least one tumor after initiation with a carcinogen followed by 25 wk of promotion with TPA. Dots represent individual animals with at least one tumor at the end of promotion; mean numbers of tumors in a given treatment represented by line. The number of mice surviving to 10 months in each group from the initial 35 is indicated below the treatments.
Fig. 4.
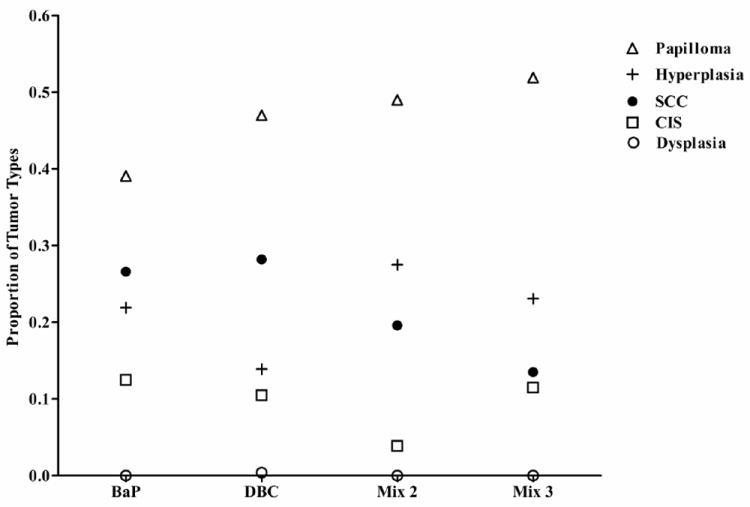
Proportional incidence of hyperplasia, dysplasia, papillomas, carcinoma in situ (CIS), and squamous cell carcinoma (SCC) in each treatment group, determined by histopathology as described in Materials and Methods.
Fig. 5.
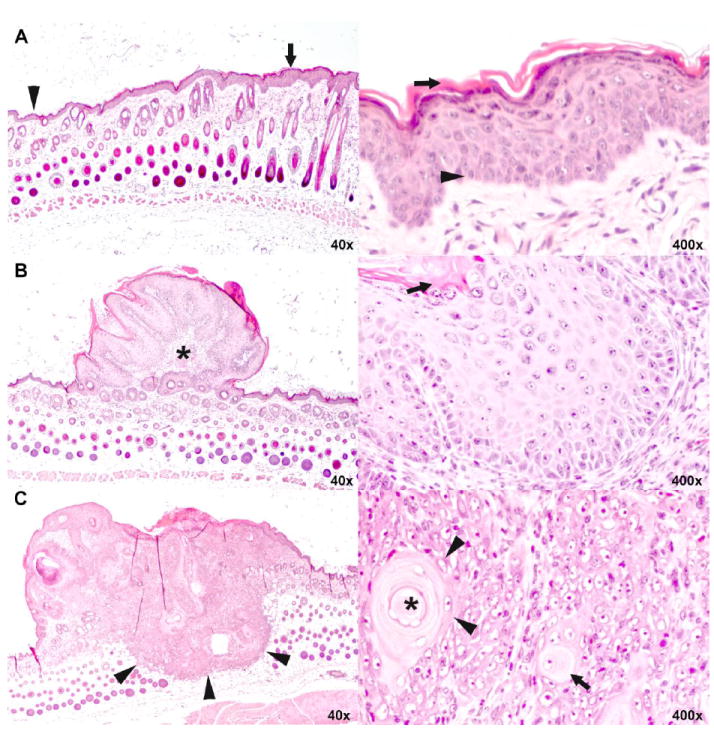
Histopathology of epidermal hyperplasia, squamous papilloma and squamous cell carcinoma of the skin.
A. Low (left) and high (right) magnification of skin with epidermal hyperplasia. In the low magnification, normal thickness of the epidermis is shown on the left (arrow head) and increased thickness of the hyperplastic epidermis on the right (arrow). While the number of cell layers is increased, keratinocytes progress in the same orderly manner from basal cells (arrow head) at bottom to fully keratinized cells (arrow) at top as they do in normal epidermis.
B. Low (left) and high (right) magnification of skin with squamous papilloma. At lower magnification, the small, protruding mass is bordered by epidermis of normal (left) to slightly increased thickness (right). It comprises a fibrovascular core (asterisk) covered with very thick epithelium that, at high magnification, recapitulates orderly keratinization of basal cells (arrow head) to fully keratinized cells (arrow) of normal and hyperplastic epidermis shown in A.
C. Low (left) and high (right) magnification of skin with squamous cell carcinoma. At low magnification, the plaque-like mass has a flat to umbilicated top (asterisk) and deeply infiltrates into the subcutis (arrow heads). At higher magnification, keratinocytes are arranged in solid nests. Individual keratinocytes (arrow) and groups of keratinocytes (arrow heads) haphazardly keratinize without orderly progression. A concentrically layered keratin pearl is present at the upper right (asterisk in center). Note that high magnification is not the same as in A and B.
DNA adduct formation in mouse skin
DNA adducts were quantified at 12 h in skin of the mouse following one initiation treatment with BaP, DBC, or a PAH mixture. Adducts migrating across the diagonal radioactive zone (DRZ) of the TLC image were compared and expressed as total adducts (Figure 6). BaP had over three times the level of total DNA adducts compared to DBC (141 ± 37 versus 45 ± 13 adducts/108 nucleotides, Figure 6A). As shown in Figure 6B the TLC autoradiogram for the BaP-treated mouse skin DNA showed one major spot; this adduct was identified as reported previously (Arlt et al, 2008) as 10-(deoxyguanosin-N2yl)-7,8,9-trihydroxy-7,8,9,10-tetrahydrobenzo[a]pyrene (dG-N2-BPDE) that co-migrated with the (±)-7,8-anti-9,10-BPDE-DNA standard. DBC produced a less intense spot with a similar mobility to the BPDE-DNA standard plus two additional spots; one major, faster migrating and a minor slower one. Our laboratory has seen a similar pattern when comparing B[a]P and DBC 32P-post labeled adducts at 24 h post initiation in Sencar mice (Courter et al. 2008). Buters et al.(2002) showed embryonic fibroblasts from wild type mice produced three major and two minor adduct peaks 24h after treatment with 100nM DBC. Four of the peaks formed from (-)-anti-DBCDE and two peaks from (+)-syn-DBC. All three PAH mixes produced only one spot on the TLC autoradiogram similar to the location of the (±)-7,8-anti-9,10-BPDE-DNA standard. DNA adduction formation as determined by 32P post-labeling, 12 h following PAH administration, did not predict the relative tumor potency of BaP, DBC or the PAH mixtures.
Fig. 6.
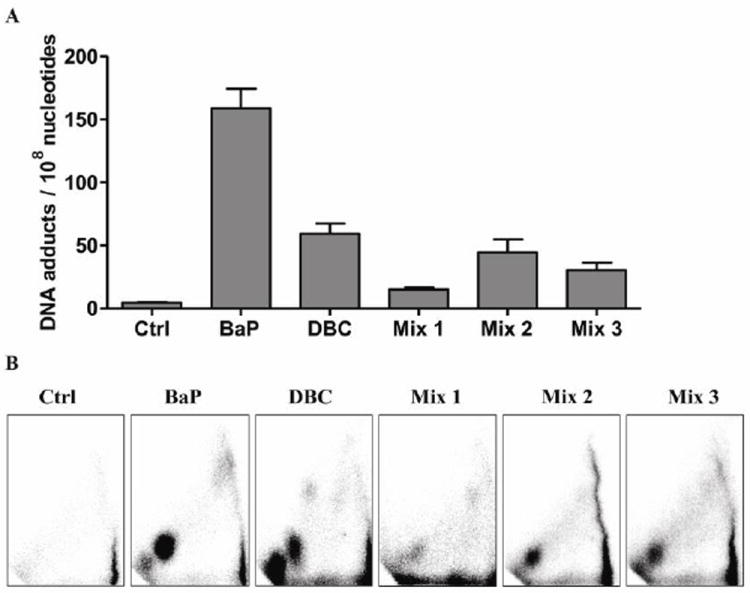
DNA adduct formation in FVB mouse skin tissue 12 h post-treatment with 200 μl toluene (Ctrl), 400 nmol (100 μg) BaP, 4 nmol (1.2 μg) DBC, 1 mg DPE (mix 1), 1 mg DPE + 1 mg CTE (mix 2), or 1 mg DPE + 1 mg CTE + 2 mg CSC (mix 3). DNAadducts were measured by the nuclease P1 enrichment version of 32P-postlabeling method. (A) Bars represent mean ± SD, N=5 pools, 2 mice/pool. Total adducts were measured across the DRZ, diagonal radioactive zone of the TLC autoradiogram. (B) Representative autoradiograms showing DNA adduct profiles.
Gene expression in mouse skin
Global gene analysis using Agilent microarrays resulted in a total of 922 genes expressed at significant levels (p<0.05, 5% FDR) across all treatment groups compared to toluene controls. Raw and normalized Agilent data files are available online at http://www.ncbi.nlm.nih.gov/geo/query/. Principal components analysis of the 922 significant genes showed strong separation of the data based on PAH exposure with biological replicates clustering by treatment group (Figure 7). Mix 2 and 3, which both contained diesel exhaust and coal tar extract, had overlapping clusters indicating similarity in gene expression between these groups. Mix 1, which included the diesel exhaust, did not cluster with the coal tar mixtures, indicating the gene expression changes in mix 2 and 3 were driven by the coal tar extract. Instead, mix 1 clustered closely with the toluene control group consistent with its lack of potency and also had the fewest number of differentially regulated genes relative to the other treatments. In comparison, the BaP and DBC clusters were distinct from each other and from all the mixtures. The certified concentration of B[a]P in CTE (NIST SRM 1597a) used in mix 2 and 3 was 93.5 ± 1.4 mg/kg. We applied 1 mg CTE which translated to 0.094 μg/animal, about 0.1% of the BaP treatment, and an RPF of 0.34 BaPeq compared to 100 for the B[a]P treatment. This suggests there were additional components in the CTE driving the carcinogenic alterations in mouse skin transcriptome resulting in a similar tumor response in BaP, mix 2 and 3.
Fig. 7.
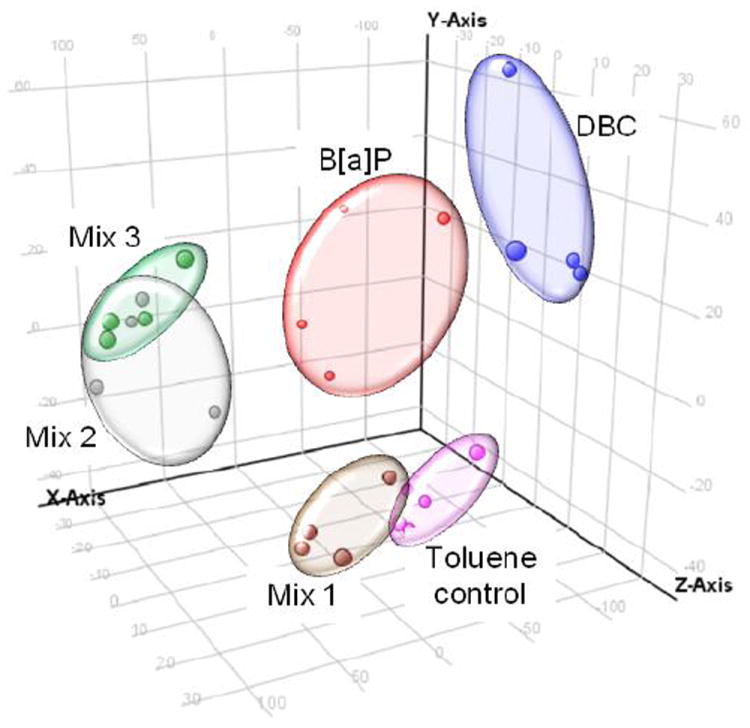
Principal components analysis of gene expression data by treatment. Each data point represents a biological replicate (N=4 per treatment). All genes differentially regulated (p<0.05) between treated and toluene control were included in analysis. Replicates cluster based on treatment group. Toluene control = pink; Mix 1 = brown; Mix 2 = gray; Mix 3 = green; B[a]P = red; DBC = blue.
The results indicated that the coal tar extract was likely driving the carcinogenic potential and the transcriptional response of the PAH mixtures. In order to look more closely at gene transcription by coal tar extract, the three PAH mixture treatments were directly compared to each other to identify genes regulated in common between mixtures 2 and 3, but unique from mixture 1. A Venn diagram comparing the alteration in gene expression in the skin, 12 h after application of the PAH mixtures, demonstrated that there were 234 genes in common when comparing mix 2 and 3 to toluene controls (Figure 8A). Visualization of these genes in a heatmap confirms that they are regulated in common (based on direction and magnitude) between mix 2 and 3, but were not regulated by mix 1 (Figure 8B). Since these genes in particular may provide insight into mechanisms associated with induction of skin tumorigenesis, the biological processes significantly (p<0.05) enriched for this gene set were identified. The major gene pathways up-regulated were associated with xenobiotic metabolic response, carbohydrate biosynthesis and hemopoiesis, whereas down-regulated pathways included genes associated with DNA repair, microtubule cytoskeleton organization, mitotic sister chromatid exchange, M phase of the cell cycle and nucleosome assembly (Figure 8B).
Fig. 8.
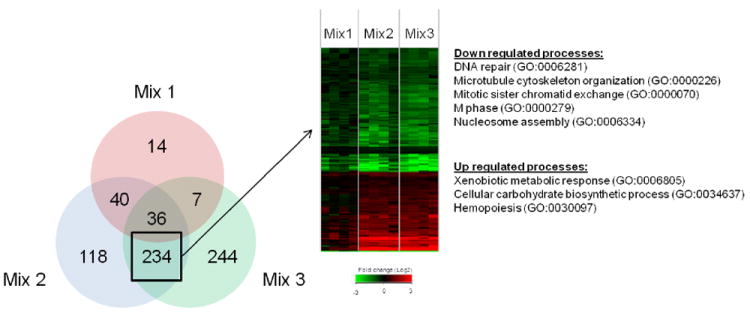
Comparison of differentially expressed genes among PAH mixture treatments by Venn diagram (A). Values represent genes significant (p<0.05) versus toluene control. Genes common between mix 2 and mix 3, but unique from mix 1 are shown as a heatmap (B). Values in heatmap are fold-change (Log2) compared to toluene control (red is up regulated, green is down regulated and black is no change). GO biological processes significantly enriched (p<0.05) for up or down regulated genes are shown.
Many of the genes up-regulated by mix 2 and 3 and associated with xenobiotic metabolic response were also significantly up-regulated (p<0.05) by BaP treatment, including strong induction (4-fold change or greater) of Cyp1a1 and Cyp1b1 (Figure 9). Consistent with its lack of potency in producing skin tumors after 25 weeks promotion, the diesel particulate extract (mix 1) had only a modest impact on CYP enzyme expression. Interestingly, an initiation dose of DBC did not induce expression of either gene and, in fact, resulted in a trend towards down regulation of Cyp1a1 and Cyp1b1 that did not reach statistical significance. With respect to phase 2 enzymes, which are expected to contribute to the detoxication of DBC, a similar pattern was again seen across the PAH treatment groups (Figure 9). Up-regulation was fairly robust by BaP, mix 2 and 3 for NAD(P)H-quinone oxidoreductase 1 (Nqo1), glutathione-S-transferases Gsta1, and Gsta2 as well as gamma glutamylcysteine synthetase (Gclc). Alteration in expression of Gstp1, Gstp2 and Gstm5 was much more modest and, in fact, expression of the latter Gsts was less with BaP than seen with mix 2 or mix 3 (Figure 9). DBC again gave quite different results with modest decreases or no change in expression of these phase 2 enzymes.
Fig. 9.
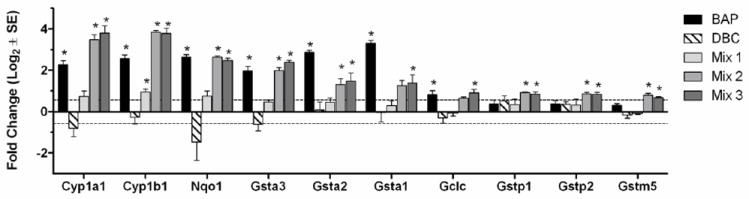
Gene expression of select xenobiotic metabolizing enzymes, including Phase 1 CYP enzymes and Phase 2 enzymes, regulated by PAH mixtures 2 and 3. Values are average Log2 fold-change (± SE) for each treatment group (N=4 biological replicates) measured by Agilent microarray. *Indicates p<0.05 compared to toluene control.
Discussion
The mouse skin initiation-promotion model has been used extensively to assess the carcinogenicity of numerous PAHs, singularly and as mixtures (IARC, 2010) (LaVoie et al., 1993). The EPA and other agencies use this data, along with results from other animal models, to assess the RPF for PAHs. In this study we employed female FVB/N mice to compare the potency of some complex PAH mixtures found in the environment to the characterized skin carcinogens BaP and DBC. Given the marked increase in tumor incidence, multiplicity and time-to-tumor formation with DBC at 1/100 the molar dose of BaP, we assert that the potency of DBC in this two-stage skin tumor model was more than 100-fold greater than that of BaP and is inconsistent with the current EPA estimate of a BaPeq of 30 for DBC. (Figures 2 and 3). At 100 μg, the RPF of BaP was 100 and DBC 36 μg BaPeq (1.2 μg × 30). The yield of squamous cell carcinomas was also greater with the 1/100-fold lower DBC dose than with BaP (Figure 4). Thus, the RPF of DBC in this model is much greater than the currently proposed value of 30 (BaP set at 1). To determine a more accurate RPF for DBC in this model, we would need to conduct a dose-response study.
Examining the results with the environmental PAH mixtures, a similar underestimation of potency can be seen. Based on the published RPFs for the PAHs in the coal tar extract (SRM 1597), the RPF for mix 2 would be 0.34 μg BaPeq and one would predict a much weaker tumor response compared to BaP alone; however the incidence, latency, multiplicity and tumor type were no different. It is entirely possible that DBC and the mixtures exhibit greater promotional activity than BaP (i.e., are more complete carcinogens). Certainly, with the mixture extracts, there are other components that could be capable of enhancing the TPA promotional activity. These results were somewhat unexpected given previous demonstration that this same PAH mixture inhibits the metabolic activation of BaP and DBC in MCF-7 cells (Mahadevan et al., 2005) and V79 cells expressing either CYP1A1 or CYP1B1 (Mahadevan et al., 2007b). The experimental design employed was novel in that we wanted to assess the effect of “mixtures of mixtures”. The lack of response with diesel extract is consistent with the low RPF of 0.004 μg BaPeq. It would also appear that the increase in RPF (0.47μg, or 0.13 μg above mix 2) with the addition of CSC did not affect carcinogenicity. It is apparent though that the current RPF system for estimation of carcinogenic potency of environmental PAH mixtures or even individual PAHs such as DBC, is inadequate. Our previous observations have shown that individual PAHs exhibit less than additivity and can compete with more potent individual PAHs for the same enzymes (Courter et al., 2006; 2008, Mahadevan et al., 2007a) It is also unlikely that complex environmental PAH mixtures have been exhaustively characterized with respect to all components and accurate RPFs determined. It would seem a more prudent approach when conducting risk assessments to utilize RPFs of mixtures rather than a summation of individual PAHs. It would also seem prudent to more thoroughly test PAHs such as DBC that exhibit high carcinogenic potency (levels of DBC are rarely reported in environmental samples) using additional models (both in vivo animal models and in vitro human cell models). The distinct pattern of gene expression with DBC also raises an important question with respect to whether or not all PAHs are carcinogenic through the same mechanism of action (MOA) which is important with respect to whether or not an RPF approach for carcinogenic risk assessment for mixtures is appropriate.
Another conclusion from this study is that PAH-DNA adduct formation in skin after single administration did not predict the final tumor response (Figure 6). Based on the total DNA adducts present in skin 12 hours post-initiation, one would predict that BaP would give the most robust tumor response (3-fold greater than DBC). Measuring adducts at one time point may not be sufficient for comparing these particular PAHs; however (Courter et al. 2008) found similar results at 24 h in Sencar mice. An attempt was made to investigate a time when adduct formation would be at peak levels. The 12 h post initiation time was chosen for measuring DNA adduct formation based on previous work in our lab (Marston et al., 2001). Sencar mice treated topically with BaP showed peak DNA adduct levels at 12 h. Adduct levels in DBC treated animals peaked at 12 h and were sustained until 24 h post treatment. It has been well documented that PAH structural features (Geacintov et al. 2002, Wu et al., 2002), specific types of adducts formed (Dreij et al., 2005), DNA repair enzyme recognition (Braithwaite et al., 1999), and replication bypass fidelity (Lagergvist et al., 2011) all contribute to levels of PAH caused mutagenicity. BaP forms predominantly adducts at the N2 position of dG while DBC forms more at the N6 position of dA. The bay region containing BaP is a planar, less flexible molecule compared to the fjord containing DBC. These two structural features in DNA adduct formation are thought to enable DBC adducts to sit in the large groove of the helix and be unrecognized by repair enzymes (Geacintov et al., 2002). Initial DNA damage, persistence of the damage, as well as the mutagenic specificity of individual DNA adducts, all contribute to the mutagenic potency and subsequently carcinogenic potency of the tested PAHs. This suggests that one must be cautious in interpretation of DNA adduction as a biomarker of PAH dependent skin tumorigenesis, especially if relying on a single time point or comparing PAHs that may be bioactivated through a variety of pathways.
In order to determine similarities and differences in comparing DBC, BaP and the PAH mixtures with respect to potential mechanisms of action, we examined alterations in the transcriptome of the skin 12 h post-initiation. A total of 922 genes were significantly up or down regulated cumulatively for all treatment groups relative to the toluene control. PAHs are known to exert toxicity, including carcinogenesis, through alteration of Ahr-regulated genes (Andrysik et al., 2011). As expected BaP and the mixtures containing coal tar extract significantly induced both Cyp1a1 and Cyp1b1. The response with DBC was unexpected. Although DBC is a much more potent skin carcinogen, dermal Cyp1a1 and Cyp1b1 expression was not induced but was slightly decreased (Figure 9). PAHs are also known to exhibit toxicity through induction of oxidative stress (Kumar et al., 2012). A number of genes regulated by the Keap 1- Nrf-2 signaling system (Niestroy et al., 2011) were up-regulated by BaP and the coal tar-containing mixtures but, again, DBC had no effect or slightly down-regulated expression (Figure 9). Principal component analysis confirmed that DBC altered a set of genes that did not cluster with BaP or the coal tar-containing mixtures (Figure 7). In support of the enzyme expression profiles and clustering analysis, we observed that the biological process, response to xenobiotic stimulus (GO:0009410), was significantly (p<0.05) enriched by BaP and not by DBC. In fact, the genes in this category were strongly up-regulated by BaP and either not changed or slightly down-regulated by DBC at 12 hours post-initiation. These data suggest that BAP may be inducing a protective response early during initiation through up-regulation of xenobiotic metabolism, while DBC exposure may result in a less protected cellular environment resulting in a higher tumor incidence. Future studies will examine the regulatory differences between BaP and DBC to understand how early changes during initiation may contribute to tumor outcome.
The principal components analysis also revealed that the coal tar mixtures clustered separately from both DBC and BaP (Figure 7). Our study shows that the coal tar extract is driving both the tumor incidence and gene expression profiles of the environmental PAH mixtures. Therefore, we focused our bioinformatic analysis of the transcriptional data on genes that are expressed in common between mixtures 2 and 3, but unique from mixture 1, to identify mechanisms associated with skin tumorigenesis. The Venn diagram (Figure 8A) shows that over 50% of the genes altered by mix 2 or 3 (270 out of 428 or 521, respectively) were shared between them and only a fraction of these genes (13% or 36 out of 270) were also shared with mix 1. These results call into question whether or not PAHs, in such environmental mixtures, share a common mode of action (MOA), an assumption important in utilizing an RPF approach in risk assessment. Functional analysis of the genes specific to the coal tar PAH mixtures (Figure 8B) suggest that down-regulation of DNA repair and cell cycle processes and up-regulation of xenobiotic metabolism are consistent with the enhanced tumorigenicity of these mixtures compared to diesel extract.
In conclusion, the results from this study suggest that an approach to assessing the carcinogenicity of PAH mixtures employing RPFs of individual PAHs has some potential areas of concern. We found DBC and PAH mixtures containing coal tar to have potency as skin carcinogens much greater than would be predicted from the RPFs. A common biomarker to predict carcinogenicity, covalent DNA adducts, did not predict final tumor response. An RPF approach to risk assessment also assumes (as with TEQs) for dioxins/dibenzofurans (Gies et al., 2007) a common MOA. Our examination of PAH-dependent alterations in the transcriptome from mouse skin calls into question whether or not a common MOA can be assumed. The pattern with DBC was markedly different than BaP and the coal tar-containing mixtures were distinct when compared to either BaP or DBC. Of course, an important caveat to this conclusion is that we sampled a single time-point of 12 hours. The pathways in the Figure 1, in addition to the well studied Cyp driven diol epoxides, include peroxidase formation of radical cations and AKR formation of o-quinones. Further studies looking at the role of these additional pathways as mechanisms of DBC bioactivation and inhibition of Cyps should be done to broaden our understanding of the complexities and differences among different PAHs and mixtures of PAHs. Further study is needed to determine how the distinct gene clustering in mouse skin at this time point relates to the tumor response in this 25-week two stage initiation-promotion model.
Highlights.
Dibenzo[def,p]chrysene (DBC) and 3 PAH mixtures were compared to benzo[a]pyrene (BaP).
DBC and 2 PAH mixtures were more potent than Relative Potency Factor estimates.
Transcriptome profiles 12 hours post initiation were analyzed by microarray.
Principle components analysis of alterations revealed treatment-based clustering.
DBC gave a unique pattern of gene alterations compared to BaP and PAH mixtures.
Acknowledgments
We would like to thank Dr. Margaret Pratt of US EPA, IRIS/NCEA/ORD, Washington D.C., Dr. Kim Anderson’s lab and Glen Wilson in particular, Erin Madeen, Anna Sherman, and Brady Do, Sarah Tscheu, Oregon State University, for their varied technical assistance. Cigarette smoke condensate was a generous gift from Hollie Swanson, University of Kentucky. Bradley Stewart carried out the Agilent array work at the University of Wisconsin EDGE3 Core Facility. Volker M. Arlt and David H. Phillips are members of ECNIS2 (Environmental Cancer Risk, Nutrition and Individual Susceptibility 2), a European Union network of excellence.
Funding
This work was supported by the National Institute of Environmental Health (grants P42ES016465 and P42ES016465-S1). Work at King’s College London is supported by Cancer Research UK.
Footnotes
Abbrevations: PAH-polycyclic aromatic hydrocarbon, BaP-benzo[a]pyrene, DBC-dibenzo[def,p]chrysene, DPE-diesel particulate extract, CTE-coal tar extract, CSC-cigarette smoke condensate, RPF-relative potency factor, TBA-tumor bearing animal, BPDE-BaP-7,8-dihydrodiol-9,10 epoxide, DBCDE-DBC-11,12-dihydrodiol-13,14 epoxide, AKR-aldo- keto reductase, ROS-reactive oxygen species, TPA-12-O-tetradecanoylphorbol-13-acetate, DRZ-diagonal radioactive zone, dG-N2-BPDE-10-(deoxyguanosin-N2-yl)-7,8,9-trihydroxy-7,8,9,10-tetrahydrobenzo[a]pyrene, Nqo1-NAD(P)H-quinone oxido reductase, Gst-glutathione-S-transferase, Gclc-gamma glutamylcysteine synthetase, CIS-carcinoma in situ, SCC-squamous cell carcinoma
Conflict of Interest Statement
None of the authors of this manuscript have any conflicts of interest associated with this work.
Publisher's Disclaimer: This is a PDF file of an unedited manuscript that has been accepted for publication. As a service to our customers we are providing this early version of the manuscript. The manuscript will undergo copyediting, typesetting, and review of the resulting proof before it is published in its final citable form. Please note that during the production process errors may be discovered which could affect the content, and all legal disclaimers that apply to the journal pertain.
References
- Allan SE, Smith BW, Anderson KA. Impact of the deepwater horizon oil spill on bioavailable polycyclic aromatic hydrocarbons in gulf of Mexico coastal waters. Environ Sci Technol. 2012;46:2033–2039. doi: 10.1021/es202942q. [DOI] [PMC free article] [PubMed] [Google Scholar]
- Andrysik Z, Vondracek J, Marvanova S, Ciganek M, Neca J, Pencikova K, Mahadevan B, Topinka J, Baird WM, Kozubik A, Machala M. Activation of the aryl hydrocarbon receptor is the major toxic mode of action of an organic extract of a reference urban dust particulate matter mixture: the role of polycyclic aromatic hydrocarbons. Mutat Res. 2011;714:53–62. doi: 10.1016/j.mrfmmm.2011.06.011. [DOI] [PubMed] [Google Scholar]
- Arif JM, Smith WA, Gupta RC. DNA adduct formation and persistence in rat tissues following exposure to the mammary carcinogen dibenzo[a,l]pyrene. Carcinogenesis. 1999;20:1147–1150. doi: 10.1093/carcin/20.6.1147. [DOI] [PubMed] [Google Scholar]
- Arlt VM, Stiborova M, Henderson CJ, Thiemann M, Frei E, Aimova D, Singh R, Gamboa da Costa G, Schmitz OJ, Farmer PB, Wolf CR, Phillips DH. Metabolic activation of benzo[a]pyrene in vitro by hepatic cytochrome P450 contrasts with detoxification in vivo: experiments with hepatic cytochrome P450 reductase null mice. Carcinogenesis. 2008;29:656–665. doi: 10.1093/carcin/bgn002. [DOI] [PubMed] [Google Scholar]
- ATSDR. Priority list of hazardous substances. 2011 http://www.atsdr.cdc.gov/SPL/resources/
- Baird WM, Hooven LA, Mahadevan B. Carcinogenic polycyclic aromatic hydrocarbon-DNA adducts and mechanism of action. Environ Mol Mutagen. 2005;45:106–114. doi: 10.1002/em.20095. [DOI] [PubMed] [Google Scholar]
- Baird WM, Mahadevan B. The uses of carcinogen-DNA adduct measurement in establishing mechanisms of mutagenesis and in chemoprevention. Mutat Res. 2004;547:1–4. doi: 10.1016/j.mrfmmm.2003.10.008. [DOI] [PubMed] [Google Scholar]
- Boffetta P, Jourenkova N, Gustavsson P. Cancer risk from occupational and environmental exposure to polycyclic aromatic hydrocarbons. Cancer Causes Control. 1997;8:444–472. doi: 10.1023/a:1018465507029. [DOI] [PubMed] [Google Scholar]
- Bolstad BM, Irizarry RA, Astrand M, Speed TP. A comparison of normalization methods for high density oligonucleotide array data based on variance and bias. Bioinformatics. 2003;19:185–193. doi: 10.1093/bioinformatics/19.2.185. [DOI] [PubMed] [Google Scholar]
- Braithwaite E, Wu X, Wang Z. Repair of DNA lesions: mechanisms and relative repair efficiencies. Mutat Res. 1999;424:207–219. doi: 10.1016/s0027-5107(99)00020-2. [DOI] [PubMed] [Google Scholar]
- Buters JTM, Mahadevan B, Quintanilla-Martinez L, Gonzalez FJ, Greim H, Baird WM, Luch A. Cytochrome P450 1B1 determines susceptibility to dibenzo[a,l]pyrene-induced tumor formation. Chem Res Toxicol. 2002;15:1127–1135. doi: 10.1021/tx020017q. [DOI] [PubMed] [Google Scholar]
- Castro DJ, Baird WM, Pereira CB, Giovanini J, Lohr CV, Fischer KA, Yu Z, Gonzalez FJ, Krueger SK, Williams DE. Fetal mouse Cyp1b1 and transplacental carcinogenesis from maternal exposure to dibenzo(a,l)pyrene. Cancer Prev Res. 2008a;1:128–134. doi: 10.1158/1940-6207.CAPR-07-0004. [DOI] [PMC free article] [PubMed] [Google Scholar]
- Castro DJ, Lohr CV, Fischer KA, Pereira CB, Williams DE. Lymphoma and lung cancer in offspring born to pregnant mice dosed with dibenzo[a,l]pyrene: the importance of in utero vs. lactational exposure. Toxicol Appl Pharmacol. 2008b;233:454–458. doi: 10.1016/j.taap.2008.09.009. [DOI] [PMC free article] [PubMed] [Google Scholar]
- Cavalieri EL, Higginbotham S, RamaKrishna NV, Devanesan PD, Todorovic R, Rogan EG, Salmasi S. Comparative dose-response tumorigenicity studies of dibenzo[alpha,l]pyrene versus 7,12-dimethylbenz[alpha]anthracene, benzo[alpha]pyrene and two dibenzo[alpha,l]pyrene dihydrodiols in mouse skin and rat mammary gland. Carcinogenesis. 1991;12:1939–1944. doi: 10.1093/carcin/12.10.1939. [DOI] [PubMed] [Google Scholar]
- Cavalieri EL, Rogan EG. The approach to understanding aromatic hydrocarbon carcinogenesis. The central role of radical cations in metabolic activation. Pharmacol Ther. 1992;55:183–194. doi: 10.1016/0163-7258(92)90015-r. [DOI] [PubMed] [Google Scholar]
- Cavelieri EL, Rogan EG. Central role of radical cations in metabolic activation of polycyclic aromatic hydrocarbons. Xenobiotica. 1995;25:677–688. doi: 10.3109/00498259509061885. [DOI] [PubMed] [Google Scholar]
- Chen KM, Zhang SM, Aliaga C, Sun YW, Cooper T, Gowdahalli K, Zhu J, Amin S, El-Bayoumy K. Induction of ovarian cancer and DNA adducts by dibenzo[a,l]pyrene in the mouse. Chem Res Toxicol. 2012;25:374–380. doi: 10.1021/tx2004322. [DOI] [PMC free article] [PubMed] [Google Scholar]
- Cogliano VJ, Baan R, Straif K, Grosse Y, Lauby-Secretan B, El Ghissassi F, Bouvard V, Benbrahim-Tallaa L, Guha N, Freeman C, Galichet L, Wild CP. Preventable exposures associated with human cancers. J Natl Cancer Inst. 2011;103:1827–1839. doi: 10.1093/jnci/djr483. [DOI] [PMC free article] [PubMed] [Google Scholar]
- Courter LA, Musafia-Jeknic T, Fisher K, Bildfell R, Giovanini J, Pereira C, Baird W. Urban dust particulate matter alters PAH-induced carcinogenesis by inhibition of CYP1A1 and CYP1B1. Tox Sci. 2006;95:63–73. doi: 10.1093/toxsci/kfl137. [DOI] [PubMed] [Google Scholar]
- Courter LA, Luch A, Musafia-Jeknic T, Arlt VM, Fischer K, Bildfell R, Pereira C, Phillips DH, Poirier MC, Baird WM. The influence of diesel exhaust on polycyclic aromatic hydrocarbon-induced DNA damage, gene expression, and tumor initiation in Sencar mice in vivo. Cancer Lett. 2008;265:135–147. doi: 10.1016/j.canlet.2008.02.017. [DOI] [PMC free article] [PubMed] [Google Scholar]
- Darwiche N, Ryscavage A, Perez-Lorenzo R, Wright L, Bae DS, Hennings H, Yuspa SH, Glick AB. Expression profile of skin papillomas with high cancer risk displays a unique genetic signature that clusters with squamous cell carcinomas and predicts risk for malignant conversion. Oncogene. 2007;26:6885–6895. doi: 10.1038/sj.onc.1210491. [DOI] [PubMed] [Google Scholar]
- Ding J, Zhong J, Yang Y, Li B, Shen G, Su Y, Wang C, Li W, Shen H, Wang B, Wang R, Huang Y, Zhang Y, Cao H, Zhu Y, Simonich SL, Tao S. Occurrence and exposure to polycyclic aromatic hydrocarbons and their derivatives in a rural Chinese home through biomass fuelled cooking. Environ Pollut. 2011 doi: 10.1016/j.envpol.2011.10.008. Epub. [DOI] [PMC free article] [PubMed] [Google Scholar]
- Dreij K, Seidel A, Jernström B. Differential removal of DNA adducts derived from anti-diol epoxides of dibenzo[a,l]pyrene and benzo[a]pyrene in human cells. Chem Res Toxicol. 2005;18:655–664. doi: 10.1021/tx0497090. [DOI] [PubMed] [Google Scholar]
- Geacintov NE, Broyde S, Buterin T, Naegeli H, Wu M, Yan S, Patel DJ. Thermodynamic and structural factors in the removal of bulky DNA adducts by the nucleotide excision repair machinery. Biopolymers. 2002;65:202–210. doi: 10.1002/bip.10239. [DOI] [PubMed] [Google Scholar]
- Gies A, Neumeier G, Rappolder M, Konietzka R. Risk assessment of dioxins and dioxin-like PCBs in food--comments by the German Federal Environmental Agency. Chemosphere. 2007;67:344–349. doi: 10.1016/j.chemosphere.2006.05.128. [DOI] [PubMed] [Google Scholar]
- Glick A, Ryscavage A, Perez-Lorenzo R, Hennings H, Yuspa S, Darwiche N. The high-risk benign tumor: evidence from the two-stage skin cancer model and relevance for human cancer. Mol Carcinog. 2007;46:605–610. doi: 10.1002/mc.20345. [DOI] [PubMed] [Google Scholar]
- Guttenplan JB, Kosinska W, Zhao ZL, Chen KM, Aliaga C, Deltondo J, Cooper T, Sun YW, Zhang SM, Jiang K, Bruggeman R, Sharma AK, Amin S, Ahn K, El-Bayoumy K. Mutagenesis and carcinogenesis induced by dibenzo[a,l]pyrene in the mouse oral cavity: a potential new model for oral cancer. Int J Cancer. 2011;130:2783–2790. doi: 10.1002/ijc.26344. [DOI] [PMC free article] [PubMed] [Google Scholar]
- Hennings H, Glick AB, Lowry DT, Krsmanovic LS, Sly LM, Yuspa SH. FVB/N mice: an inbred strain sensitive to the chemical induction of squamous cell carcinomas in the skin. Carcinogenesis. 1993;14:2353–2358. doi: 10.1093/carcin/14.11.2353. [DOI] [PubMed] [Google Scholar]
- Higginbotham S, RamaKrishna NV, Johansson SL, Rogan EG, Cavalieri EL. Tumor-initiating activity and carcinogenicity of dibenzo[a,l]pyrene versus 7,12-dimethylbenz[a]anthracene and benzo[a]pyrene at low doses in mouse skin. Carcinogenesis. 1993;14:875–878. doi: 10.1093/carcin/14.5.875. [DOI] [PubMed] [Google Scholar]
- Huang da W, Sherman BT, Lempicki RA. Systematic and integrative analysis of large gene lists using DAVID bioinformatics resources. Nat Protoc. 2009;4:44–57. doi: 10.1038/nprot.2008.211. [DOI] [PubMed] [Google Scholar]
- IARC. Some non-heterocyclic polycyclicaromatic hydrocarbons and some related exposures. Monographs on the evaluation of carcinogenic risks to humans. Lyon, France: 2010. http://monographs.iarc.fr/ENG/Monographs/vol92/mono92.pdf. [PMC free article] [PubMed] [Google Scholar]
- Kumar M, Sharma VL, Sehgal A, Jain M. Protective effects of green and white tea against benzo(a)pyrene induced oxidative stress and DNA damage in murine model. Nutr Cancer. 2012;64:300–306. doi: 10.1080/01635581.2012.648300. [DOI] [PubMed] [Google Scholar]
- Lagerqvist A, Håkansson D, Lundin C, Prochazka G, Dreij K, Segerbäck D, Jerström B, Törnqvist M, Frank H, Seidel A, Erixon K, Jenssen D. DNA repair and replication influence the number of mutations per adduct of polycyclic aromatic hydrocarbons in mammalian cells. DNA Repair. 2011;10:877–886. doi: 10.1016/j.dnarep.2011.06.002. [DOI] [PubMed] [Google Scholar]
- LaVoie EJ, He ZM, Meegalla RL, Weyand EH. Exceptional tumor-initiating activity of 4-fluorobenzo[j]-fluoranthene on mouse skin: comparison with benzo[j]-fluoranthene, 10-fluorobenzo[j]fluoranthene, benzo[a]pyrene, dibenzo[a,l]pyrene and 7,12-dimethylbenz[a]anthracene. Cancer Lett. 1993;70:7–14. doi: 10.1016/0304-3835(93)90068-k. [DOI] [PubMed] [Google Scholar]
- Lewtas J. Air pollution combustion emissions: characterization of causative agents and mechanisms associated with cancer, reproductive, and cardiovascular effects. Mutat Res. 2007;636:95–133. doi: 10.1016/j.mrrev.2007.08.003. [DOI] [PubMed] [Google Scholar]
- Lijinsky W. The formation and occurrence of polynuclear aromatic hydrocarbons associated with food. Mutat Res. 1991;259:251–261. doi: 10.1016/0165-1218(91)90121-2. [DOI] [PubMed] [Google Scholar]
- Lomas A, Leonardi-Bee J, Bath-Hextall F. A systematic review of worldwide incidence of non-melanoma skin cancer. Br J Dermatol. 2012;166:1069–1080. doi: 10.1111/j.1365-2133.2012.10830.x. [DOI] [PubMed] [Google Scholar]
- Mahadevan B, Luch A, Atkin J, Haynes M, Nguyen T, Baird WM. Inhibition of human cytochrome p450 1b1 further clarifies its role in the activation of dibenzo[a,l]pyrene in cells in culture. J Biochem Mol Toxicol. 2007a;21:101–109. doi: 10.1002/jbt.20168. [DOI] [PubMed] [Google Scholar]
- Mahadevan B, Marston CP, Dashwood WM, Li Y, Pereira C, Baird WM. Effect of a standardized complex mixture derived from coal tar on the metabolic activation of carcinogenic polycyclic aromatic hydrocarbons in human cells in culture. Chem Res Toxicol. 2005;18:224–231. doi: 10.1021/tx0497604. [DOI] [PubMed] [Google Scholar]
- Mahadevan B, Marston CP, Luch A, Dashwood WM, Brooks E, Pereira C, Doehmer J, Baird WM. Competitive inhibition of carcinogen-activating CYP1A1 and CYP1B1 enzymes by a standardized complex mixture of PAH extracted from coal tar. Int J Cancer. 2007b;120:1161–1168. doi: 10.1002/ijc.22466. [DOI] [PubMed] [Google Scholar]
- Mao IF, Chen C-N, Lin Y-C, Chen M-L. Airborne particle PM2.5/PM10 mass distribution and particle-bound PAH concentrations near a medical waste incinerator. Atmos Environ. 2007;41:2467–2475. [Google Scholar]
- Marczynski B, Pesch B, Wilhelm M, Rossbach B, Preuss R, Hahn JU, Rabstein S, Raulf-Heimsoth M, Seidel A, Rihs HP, Adams A, Scherenberg M, Erkes A, Engelhardt B, Straif K, Kafferlein HU, Angerer J, Bruning T. Occupational exposure to polycyclic aromatic hydrocarbons and DNA damage by industry: a nationwide study in Germany. Arch Toxicol. 2009;83:947–957. doi: 10.1007/s00204-009-0444-9. [DOI] [PubMed] [Google Scholar]
- Marston CP, Pereira C, Ferguson J, Fischer K, Hedstrom O, Dashwood WM, Baird WM. Effect of a complex environmental mixture from coal tar containing polycyclic aromatic hydrocarbons (PAH) on the tumor initiation, PAH-DNA binding and metabolic activation of carcinogenic PAH in mouse epidermis. Carcinogenesis. 2001;22:1077–1086. doi: 10.1093/carcin/22.7.1077. [DOI] [PubMed] [Google Scholar]
- Nesnow S, Mass MJ, Ross JA, Galati AJ, Lambert GR, Gennings C, Carter WH, Jr, Stoner GD. Lung tumorigenic interactions in strain A/J mice of five environmental polycyclic aromatic hydrocarbons. Environ Health Perspect. 1998;106(Suppl 6):1337–1346. doi: 10.1289/ehp.98106s61337. [DOI] [PMC free article] [PubMed] [Google Scholar]
- Niestroy J, Barbara A, Herbst K, Rode S, van Liempt M, Roos PH. Single and concerted effects of benzo[a]pyrene and flavonoids on the AhR and Nrf2-pathway in the human colon carcinoma cell line Caco-2. Toxicol In Vitro. 2011;25:671–683. doi: 10.1016/j.tiv.2011.01.008. [DOI] [PubMed] [Google Scholar]
- Palackal NT, Burczynski ME, Harvey RG, Penning TM. The ubiquitous aldehyde reductase (AKR1A1) oxidizes proximate carcinogen trans-dihydrodiols to o-quinones: potential role in polycyclic aromatic hydrocarbon activation. Biochemistry. 2001;40:10901–10910. doi: 10.1021/bi010872t. [DOI] [PubMed] [Google Scholar]
- Palackal NT, Lee SH, Harvey RG, Blair IA, Penning TM. Activation of polycyclic aromatic hydrocarbon trans-dihydrodiol proximate carcinogens by human aldo-keto reductase (AKR1C) enzymes and their functional overexpression in human lung carcinoma (A549) cells. J Biol Chem. 2002;277:24799–24808. doi: 10.1074/jbc.M112424200. [DOI] [PubMed] [Google Scholar]
- Penning TM, Ohnishi ST, Ohnishi T, Harvey RG. Generation of reactive oxygen species during the enzymatic oxidation of polycyclic aromatic hydrocarbon trans-dihydrodiols catalyzed by dihydrodiol dehydrogenase. Chem Res Toxicol. 1996;9:84–92. doi: 10.1021/tx950055s. [DOI] [PubMed] [Google Scholar]
- Phillips DH, Arlt VM. The 32P-postlabeling assay for DNA adducts. Nat Protoc. 2007;2:2772–2781. doi: 10.1038/nprot.2007.394. [DOI] [PubMed] [Google Scholar]
- Phillips DH, Castegnaro M. Standardization and validation of DNA adduct postlabelling methods: report of interlaboratory trials and production of recommended protocols. Mutagenesis. 1999;14:301–315. doi: 10.1093/mutage/14.3.301. [DOI] [PubMed] [Google Scholar]
- Poster DL, Alda MJLD, Wise SA, Chuang JC, Mumford JL. Determination of PAHs in combustion-related samples and in SRM 1597, complex mixture of PAHs from coal tar. Polycycl Aromat Compd. 2000;20:79–95. [Google Scholar]
- Shah AR, Singhal M, Klicker KR, Stephan EG, Wiley HS, Waters KM. Enabling high-throughput data management for systems biology: the Bioinformatics Resource Manager. Bioinformatics. 2007;23:906–909. doi: 10.1093/bioinformatics/btm031. [DOI] [PubMed] [Google Scholar]
- Shimada T. Xenobiotic-metabolizing enzymes involved in activation and detoxification of carcinogenic polycyclic aromatic hydrocarbons. Drug Metab Pharmacokinet. 2006;21:257–276. doi: 10.2133/dmpk.21.257. [DOI] [PubMed] [Google Scholar]
- Shorey LE, Castro DJ, Baird WM, Siddens LK, Lohr CV, Matzke MM, Waters KM, Corley RA, Williams DE. Transplacental carcinogenesis with dibenzo[def,p]chrysene (DBC): timing of maternal exposures determines target tissue response in offspring. Cancer Lett. 2012;317:49–55. doi: 10.1016/j.canlet.2011.11.010. [DOI] [PMC free article] [PubMed] [Google Scholar]
- Shou M, Krausz KW, Gonzalez FJ, Gelboin HV. Metabolic activation of the potent carcinogen dibenzo[a,l]pyrene by human recombinant cytochromes P450, lung and liver microsomes. Carcinogenesis. 1996;17:2429–2433. doi: 10.1093/carcin/17.11.2429. [DOI] [PubMed] [Google Scholar]
- Slaga TJ, Das SB, Rice JM, Thompson S. Fractionation of mouse epidermal chromatin components. J Invest Dermatol. 1974;63:343–349. doi: 10.1111/1523-1747.ep12680807. [DOI] [PubMed] [Google Scholar]
- Tang D, Phillips DH, Stampfer M, Mooney LA, Hsu Y, Cho S, Tsai WY, Ma J, Cole KJ, She MN, Perera FP. Association between carcinogen-DNA adducts in white blood cells and lung cancer risk in the physicians health study. Cancer Res. 2001;61:6708–6712. [PubMed] [Google Scholar]
- U.S. EPA. Development of a Relative Potency Factor (RPF) Approach for Polycyclic Aromatic Hydrocarbon (PAH) Mixtures (External Review Draft) U.S. EPA; Washington, DC: 2010. EPA/635/R-08/012A. [Google Scholar]
- Uno S, Dalton TP, Dragin N, Curran CP, Derkenne S, Miller ML, Shertzer HG, Gonzalez FJ, Nebert DW. Oral benzo[a]pyrene in Cyp1 knockout mouse lines: CYP1A1 important in detoxication, CYP1B1 metabolism required for immune damage independent of total-body burden and clearance rate. Mol Pharmacol. 2006;69:1103–1114. doi: 10.1124/mol.105.021501. [DOI] [PubMed] [Google Scholar]
- Weissenfels WD, Klewer HJ, Langhoff J. Adsorption of polycyclic aromatic hydrocarbons (PAHs) by soil particles: influence on biodegradability and biotoxicity. Appl Microbiol Biotechnol. 1992;36:689–696. doi: 10.1007/BF00183251. [DOI] [PubMed] [Google Scholar]
- Wester PW, Muller JJ, Slob W, Mohn GR, Dortant PM, Kroese ED. Carcinogenic activity of benzo[a]pyrene in a 2 year oral study in Wistar rats. Food Chem Toxicol. 2011;50:927–935. doi: 10.1016/j.fct.2011.12.003. [DOI] [PubMed] [Google Scholar]
- Wickramasinghe AP, Karunaratne DG, Sivakanesan R. PM(10)-bound polycyclic aromatic hydrocarbons: Biological indicators, lung cancer risk of realistic receptors and ‘source-exposure-effect relationship’ under different source scenarios. Chemosphere. 2012;87:1381–1387. doi: 10.1016/j.chemosphere.2012.02.044. [DOI] [PubMed] [Google Scholar]
- Wu M, Yan S, Patel DJ, Geacintov NE, Broyde S. Relating repair susceptibility of carcinogen-damaged DNA with structural distortion and thermodynamic stability. Nucleic Acids Res. 2002;30:3422–3432. doi: 10.1093/nar/gkf427. [DOI] [PMC free article] [PubMed] [Google Scholar]
- Xue W, Warshawsky D. Metabolic activation of polycyclic and heterocyclic aromatic hydrocarbons and DNA damage: a review. Toxicol Appl Pharmacol. 2005;206:73–93. doi: 10.1016/j.taap.2004.11.006. [DOI] [PubMed] [Google Scholar]
- Yu Z, Loehr C, Fischer KA, Louderback M, Krueger SK, Dashwood RH, Kerkvliet NI, Pereira CB, Jennings-Gee J, Dance ST, Miller MS, Bailey GS, Williams DE. In utero exposure of mice to dibenzo[a,l]pyrene produces lymphoma in the offspring: role of the aryl hydrocarbon receptor. Cancer Res. 2006;66:755–762. doi: 10.1158/0008-5472.CAN-05-3390. [DOI] [PubMed] [Google Scholar]
- Yu Z, Mahadevan B, Lohr CV, Fischer KA, Louderback MA, Krueger SK, Pereira CB, Albershardt DJ, Baird WM, Bailey GS, Williams DE. Indole-3-carbinol in the maternal diet provides chemoprotection for the fetus against transplacental carcinogenesis by the polycyclic aromatic hydrocarbon dibenzo[a,l]pyrene. Carcinogenesis. 2006;27:2116–2123. doi: 10.1093/carcin/bgl072. [DOI] [PubMed] [Google Scholar]