

Abstract
A-type voltage-gated K+ (Kv) channels self-regulate their activity by inactivating directly from the open state (open-state inactivation [OSI]) or by inactivating before they open (closed-state inactivation [CSI]). To determine the inactivation pathways, it is often necessary to apply several pulse protocols, pore blockers, single-channel recording, and kinetic modeling. However, intrinsic hurdles may preclude the standardized application of these methods. Here, we implemented a simple method inspired by earlier studies of Na+ channels to analyze macroscopic inactivation and conclusively deduce the pathways of inactivation of recombinant and native A-type Kv channels. We investigated two distinct A-type Kv channels expressed heterologously (Kv3.4 and Kv4.2 with accessory subunits) and their native counterparts in dorsal root ganglion and cerebellar granule neurons. This approach applies two conventional pulse protocols to examine inactivation induced by (a) a simple step (single-pulse inactivation) and (b) a conditioning step (double-pulse inactivation). Consistent with OSI, the rate of Kv3.4 inactivation (i.e., the negative first derivative of double-pulse inactivation) precisely superimposes on the profile of the Kv3.4 current evoked by a single pulse because the channels must open to inactivate. In contrast, the rate of Kv4.2 inactivation is asynchronous, already changing at earlier times relative to the profile of the Kv4.2 current evoked by a single pulse. Thus, Kv4.2 inactivation occurs uncoupled from channel opening, indicating CSI. Furthermore, the inactivation time constant versus voltage relation of Kv3.4 decreases monotonically with depolarization and levels off, whereas that of Kv4.2 exhibits a J-shape profile. We also manipulated the inactivation phenotype by changing the subunit composition and show how CSI and CSI combined with OSI might affect spiking properties in a full computational model of the hippocampal CA1 neuron. This work unambiguously elucidates contrasting inactivation pathways in neuronal A-type Kv channels and demonstrates how distinct pathways might impact neurophysiological activity.
INTRODUCTION
Inactivation of voltage-gated K+ (Kv) channels in excitable tissues allows self-regulation of their activity in response to a persistent or repetitive depolarization of the membrane potential. The electrophysiological impact of Kv channels is thus intimately tied to their inactivation properties (Hille, 2001). Independently of the underlying molecular mechanisms, there are two generally accepted pathways of inactivation (Fig. 1). Either the Kv channel must open to inactivate (open-state inactivation [OSI]), or it may inactivate from closed states that precede pore opening (closed-state inactivation [CSI]; Bähring and Covarrubias, 2011). Also, Kv channels may exhibit both OSI and CSI. However, whether a Kv channel is tailored to preferentially use OSI or CSI may depend on its native function. If it were necessary to quickly shut down a Kv channel whose main function is to shape the early repolarization phase of an action potential (AP), then OSI would be the preferred inactivation pathway. Alternatively, if it were necessary to quickly and reversibly regulate the availability of a Kv channel whose main function is to dampen sub- and supra-threshold depolarization and, to some extent, repolarize APs, then CSI would be the preferred inactivation pathway. Although one can generally assume that high and low voltage–activated A-type Kv channels preferentially use OSI and CSI, respectively, voltage dependence alone only provides a correlational argument with no significant mechanistic insights. How can we determine whether a Kv channel, and conceivably any other voltage-gated ion channel, undergoes preferential OSI or preferential CSI? Answering this question becomes especially important if the inactivation pathway depends on subunit composition and posttranslational modifications (Roeper et al., 1997; Kerschensteiner and Stocker, 1999; Ottschytsch et al., 2002; Kerschensteiner et al., 2003; Amarillo et al., 2008; Desai et al., 2008; Ritter et al., 2012), which then dictates the function of the Kv channel. A myriad of reports published in the last two decades have returned answers to this question and shed light on specific molecular mechanisms (Kurata and Fedida, 2006; Bähring and Covarrubias, 2011). These studies, however, have relied on diverse and often complex approaches that include various voltage protocols, single-channel recording, mutagenesis, kinetic modeling, fluorometry, crystallography, etc. (Horn et al., 1981; Aldrich and Stevens, 1983; Hoshi et al., 1990, 1991; Solc and Aldrich, 1990; Olcese et al., 1997, 2001; Roux et al., 1998; Bähring et al., 2001; Claydon and Fedida, 2007; Dougherty et al., 2008; Kaulin et al., 2008; Cuello et al., 2010a,b). Unfortunately, as we begin to explore the functions of diverse A-type Kv channels in their native environments and how subunit composition and posttranslational modification affect function (Beck et al., 2002; Amarillo et al., 2008; Kaulin et al., 2009; Sun et al., 2011; Ritter et al., 2012), it is not practical to use these approaches to establish the inactivation pathways.
Figure 1.

Inactivation pathways of voltage-gated ion channels. Inactivation may occur strictly from the open state (OSI) or pre-open closed states (CSI). A hybrid scenario allowing inactivation from both open and closed states is also likely (OSI + CSI). Gray arrows indicate a subset of this scheme in which interconversion between closed-inactivated and open-inactivated is allowed. For proof-of-principle simulations, the detailed versions of these schemes are shown in Fig. S1.
To implement a modeling-independent practical solution, we revisited classical studies by Bean (1981), Horn et al. (1981), Aldrich and Stevens (1983), and Armstrong (2006) on the mechanisms of inactivation of voltage-gated Na+ (Nav) channels. The study by Bean (1981) provided the simplest framework readily applicable to elucidate the inactivation pathways of A-type Kv channels. Basically, two conventional pulse protocols were used to examine the macroscopic kinetics of Na+ channel inactivation: (1) a single depolarizing step (single-pulse inactivation protocol), and (2) the combination of a depolarizing prepulse (conditioning pulse) and a test pulse separated by a resetting interval (two-pulse inactivation protocol). The single-pulse inactivation protocol yielded the current profile, directly reflecting the time-dependent change in open probability at the voltage of the depolarizing step. The double-pulse inactivation protocol, on the other hand, yielded the time course of inactivation at the corresponding voltage. Then, the author made a straightforward prediction: if the channel must open to inactivate (OSI), the time-dependent profile of the open probability (from the single-pulse inactivation protocol) and the corresponding rate of inactivation (first derivative of the development of inactivation resulting from the double-pulse inactivation protocol) must exactly agree. This outcome could, in fact, be predicted qualitatively if the development of inactivation exhibits a significant lag, suggesting that inactivation gradually accelerates as the open probability rises to its peak. On the contrary, if the rate of inactivation is left-shifted in relation to the time-dependent profile of the open probability and there is little or no lag in the development of inactivation, the channels need not open to inactivate. This argument led Bean (1981) to conclude that the crayfish Nav channel undergoes CSI and, using other approaches, others reached the same conclusion for muscle and neuronal Nav channels (Horn et al., 1981; Aldrich and Stevens, 1983; Armstrong, 2006). Here, we show that the combination of the single-pulse and double-pulse inactivation protocols conclusively discriminates between OSI and CSI in recombinant and native Kv channels. First, assuming either OSI or CSI, we demonstrate the principle of the approach using simulated currents. Second, we applied the method to the high voltage–activated Kv3.4 channel (recombinant and natively expressed in dorsal root ganglion [DRG] neurons) and to low voltage–activated Kv4.2 channels (recombinant and natively expressed in cerebellar granule neurons [CGNs]). The investigation of Kv4.2 channels included various subunit compositions that manipulate CSI and OSI. Third, we discuss a previously reported computational model of the hippocampal CA1 neuron to demonstrate the physiological impact of CSI.
MATERIALS AND METHODS
Animals and reagents
All animals were treated as approved by the Thomas Jefferson University Institutional Animal Care and Use Committee and were maintained in the Thomas Jefferson University Animal Facility. Pregnant rats were received and held for 1 wk before birth. Chemicals and reagents were purchased from Thermo Fisher Scientific or Sigma-Aldrich unless otherwise noted. cDNAs were obtained from the following sources: rKv4.2 cDNA, M. Sheng (Massachusetts Institute of Technology, Cambridge, MA); rDPP6-S, B. Rudy (New York University, New York, NY); rKChIP-1, P.J. Pfaffinger (Baylor College of Medicine, Houston, TX); rDPP10a, H. Jerng (Baylor College of Medicine, Houston, TX); rKv3.4, O. Pongs (University of Hamburg-Eppendorf, Hamburg, Germany).
Heterologous expression
As described previously (O’Leary and Horn, 1994), the calcium phosphate method (Invitrogen) was used to cotransfect tsA-201 cells with plasmids containing cDNAs encoding each subunit (Kv4.2, DPP6-S or DPP10a, KChIP-1). To express the Kv4.2 ternary complex, cells were cotransfected with Kv4.2, DPP6-S and KChIP1 plasmid DNAs at a 1:1:1 mass ratio. Additionally, a plasmid containing the CD8 gene (5 mg) was included for identification of transfected cells upon binding of the anti-CD8 antibody-bearing beads (Invitrogen). For expression in Xenopus laevis oocytes, Kv3.4 mRNA was produced by in vitro transcription using the mMessage mMachine kit driven by T7 RNA polymerase (Ambion). The Kv3.4 mRNA was microinjected into defolliculated Xenopus oocytes (50 ng/cell) with a microinjector (Nanoject; Drummond) 1–2 d before electrophysiological recording.
Isolation of DRG neurons
Male Sprague-Dawley rats (200–215 g) were anaesthetized with 3% isoflurane and decapitated. DRG were selected from all vertebral levels and placed in HBSS with 10 mM HEPES. Ganglia were enzymatically treated with sequential 30-min incubations of 1.5 mg/ml collagenase and 1 mg/ml trypsin in HBSS/HEPES solution at 37°C. Neurons were then placed in L-15 Leibovitz medium containing 10% fetal bovine serum, 2 mM l-glutamine, 24 mM NaHCO3, 38 mM glucose, 2% penicillin–streptomycin, and 50 ng/ml nerve growth factor, and a fire-polished Pasteur pipette was used to mechanically dissociate the neurons. DRG neurons were plated onto poly-l-ornithine–coated coverslips, kept at 37°C, and recorded 2–24 h after dissociation.
Isolation of CGNs
The isolation of CGNs was performed as described previously (Kaulin et al., 2009). In brief, 7–8-d-old rat pups were anaesthetized with isoflurane and decapitated. The brain was removed, cerebellum was separated, and meninges were detached. The cerebellum was minced, and the tissue was digested in HBSS including trypsin (0.125%) and DNase I (0.2%) at 37°C for 30 min. This tissue homogenate was suspended in complete DMEM and filtered through 100- and 40-µm nylon mesh, onto glass coverslips coated with poly-l-ornithine.
Electrophysiological recording of tsA-201 cells
Heterologously expressed Kv4.2 currents were recorded using the cell-attached configuration of the patch-clamp method as described previously (Kaulin et al., 2009). The pipette solution contained (mM): 130 NaCl, 2 KCl, 1.5 CaCl2, 1 MgCl2, 20 TEA-Cl, and 10 HEPES, pH 7.4, adjusted with NaOH. The bath solution contained (mM): 150 KCl, 1.5 CaCl2, 1 MgCl2, and 10 HEPES, pH 7.4, adjusted with KOH. This bath solution zeroed the resting membrane potential of the cell. Extracellular TEA in the recording pipette only was used to eliminate a small but significant endogenous delayed-rectifier K+ current. A p/−4 leak subtraction protocol was to subtract passive components of the total current. Currents were low-pass filtered at 2 kHz (Axopatch 200B internal four-pole Bessel filter) and sampled at 10 kHz using the Digidata 1322A and Clampex 9.2 (Molecular Devices). All patch-clamp recordings were conducted at room temperature (22–24°C).
Electrophysiological recording of Xenopus oocytes
Two-electrode voltage-clamping experiments of Kv3.4 channels heterologously expressed in Xenopus oocytes were performed as described previously (Kaulin et al., 2008). Passive components of the total current were subtracted on-line using a p/−6 subtraction protocol. Currents were low-pass filtered using the four-pole internal Bessel filter at 1 kHz in the Oocyte Clamp OC-725C (Warner Instruments) and digitized at 5 kHz using Digidata 1322A and Clampex 9.2 (Molecular Devices).
Electrophysiological recording of DRG neurons
Small-diameter (<25 µm) DRG neurons were used for cell-attached macropatch recordings at room temperature (22–24°C) as described previously (Ritter et al., 2012). Pipette and bath solutions for DRG experiments contained (mM): 130 choline-Cl, 5 KCl, 1 MgCl2, 2 CaCl2, 10 HEPES, and 50 mM sucrose, pH 7.4. Membrane potentials of the patch were determined assuming Vmembrane = Vcommand + Vrest, where the resting membrane potential is −60 ± 3.3 mV (n = 10 neurons). Currents were low-pass filtered at 2 kHz (Axon Multiclamp 700B internal four-pole Bessel filter) and sampled at 10 kHz using the Digidata 1440A and Clampex 10.2 (Molecular Devices).
Electrophysiological recording of CGNs
Electrophysiological recordings of native Kv4.2 ternary channels in CGNs were performed in the cell-attached configuration of the patch-clamp method as described above for the recordings in tsA-201 cells. The pipette solution contained (mM): 130 NaCl, 2 KCl, 1.5 CaCl2, 1 MgCl2, 20 TEA-Cl, and 10 HEPES, pH 7.4, adjusted with NaOH. The bath solution contained (mM): 150 KCl, 1.5 CaCl2, 1 MgCl2, and 10 HEPES, pH 7.4, adjusted with KOH. This bath solution zeroed the resting membrane potential of the cell. Extracellular TEA in the recording pipette only was used to eliminate endogenous delayed-rectifier K+ currents.
Data analysis
Graphical display and empirical curve fitting were conducted in Clampfit 10.2 (Molecular Devices) and OriginPro 8.0 (OriginLab Corp.). Specific empirical functions are indicated in the figure legends. All results are expressed as the mean ± SEM.
Kinetic modeling
Assuming OSI (Fig. 1 and Fig. S1), IChMASCOT was used to determine the best global fit to DRG Kv3.4 currents, steady-state inactivation, voltage dependence of the time constants (activation, deactivation, and inactivation), and recovery from inactivation. The best global fit parameters (Table S1) were then used to simulate OSI properties. To simulate CSI and investigate the neurophysiological impact of Kv4.2 inactivation pathways, a previously established CSI model for ternary Kv4 channels (Amarillo et al., 2008; Fig. S1) was globally fitted to theoretical currents generated by a conventional Hodgkin–Huxley model of the dendritic A-type K+ conductance in distal CA1 pyramidal neurons at animal temperature (34°C; Migliore et al., 1999). This approach allowed implementation of Markov chain models in a complete computational model of the CA1 neuron and testing the impact of distinct Kv4.2 inactivation pathways on neurophysiological properties at animal temperature. Using the parameter values listed in Table S1, the proof-of-principle simulations in Figs. 3 and 4 were produced using IonChannelLab (Santiago-Castillo et al., 2010). For the CSI + OSI model (Fig. S1), two sequential inactivation states were used as proposed previously (Dougherty et al., 2008), and Q10 = 5 for forward transitions and Q10 = 1 for reverse transitions were assumed according to previous work on N-type inactivation peptides (Murrell-Lagnado and Aldrich, 1993). Simulations of CA1 pyramidal neurons were implemented in the NEURON simulation environment (v7.1; Hines and Carnevale, 1997) using the Migliore et al. (1999) model. The CSI and CSI + OSI models were then used to replace the distal A-type K+ channels in the NEURON model, and conductance was increased to reproduce dampening of back-propagating APs (bAPs; threefold increase in conductance, KMULT = 0.144). This conductance was then used to replace all A-type K+ channels (distal and proximal, KMULT and KMULTP set to 0.144), and somatic current injections were used to investigate the differential impact of CSI and CSI + OSI on firing of AP trains. All files used in simulations are available on the ModelDB website under the accession number 145672 (http://senselab.med.yale.edu/modeldb/ShowModel.asp?model=145672).
Figure 3.

OSI simulation. (A) Family of outward currents evoked by a series of voltage steps (inset). (B) Normalized GP-V and steady-state inactivation curves. The simulation of steady-state inactivation assumed 10-s conditioning pulses and a test pulse of +70 mV. (C) Voltage dependence of the time constant of inactivation. Time constants were determined by fitting an exponential function to the decay phase of the simulated outward currents. For comparison, the red symbol indicates the time constant determined from the double-pulse protocol. (D) Outward currents evoked by a double-pulse protocol with a 5-ms resetting gap between the two pulses (inset). This gap eliminates a Cole–Moore effect on the test current and is not long enough to cause significant recovery from inactivation (the time constant of recovery at −100 mV is ∼2,000 ms). The conditioning pulse activated 19% of the peak conductance. (E) Kinetics of double-pulse inactivation. The simulated normalized peak current evoked by the test pulse of the protocol in D plotted against the duration of the conditioning pulse. (F) Overlay of the outward current (black) evoked by a single pulse (−100 to 0 mV) and the rate of inactivation (red) at 0 mV. The rate of inactivation is the scaled negative first derivative of the plot in E. The simulations were performed at 24°C, and the model parameters are given in Table S1.
Figure 4.

CSI simulation. Details of A–F are as described in the Fig. 3 legend. For comparison, the red symbol in C indicates the time constant determined from the double-pulse protocol. The conditioning pulse in D activated 14% of the peak conductance. Recovery from inactivation at −100 mV was significant within 5 ms and, therefore, we used no gap between the two pulses. These simulations were performed at 34°C to assess the predictions of the model on spiking properties at the temperature used to study the excitability of hippocampal neurons (Materials and methods; Fig. 11). Simulation parameters are given in Table S1. G and H are analogous to E and F, with simulation parameters as reported by Amarillo et al. (2008; Table S1), except the allosteric factor f = 0.45 (red symbols). The blue symbols demonstrate the result of further increasing the allosteric factor f to 0.67 and setting the allosteric factor g to 4.
Online supplemental material
Fig. S1 depicts kinetic schemes used in Figs. 2–4 and 11, and Fig. S2 shows the results of the two-pulse approach applied to the recombinant ShakerB channel expressed in tsA-201 cells. Additionally, Table S1 provides the specific parameter values used in the simulations. The online supplemental material is available at http://www.jgp.org/cgi/content/full/jgp.201210869/DC1.
Figure 2.
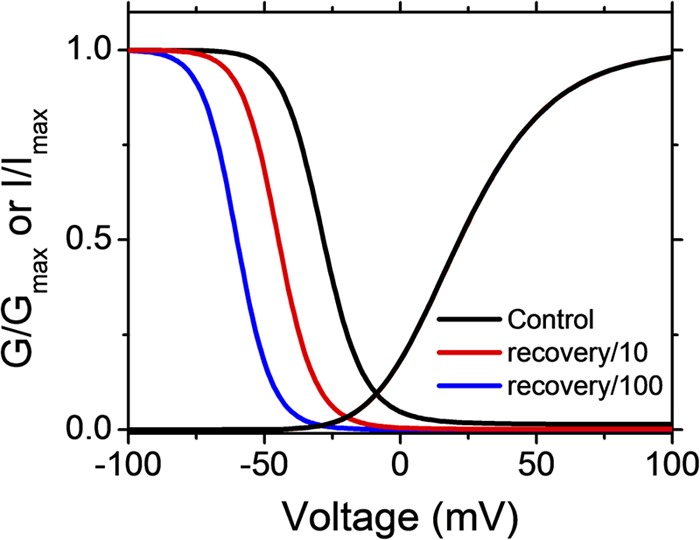
The effect of recovery from OSI on the simulated relationship between the GP-V and the steady-state inactivation curves. The GP-V and steady-state inactivation curves were simulated assuming OSI (Fig. S1 and Table S1) in three conditions that compare the effect of varying the rate constant of recovery from inactivation (λ1). Note that the steady-state inactivation curve shifts to the left as λ1 is slowed. In contrast, the GP-V curves superimpose exactly on each other.
Figure 11.

The pathways of Kv4 channel inactivation influence spiking properties in a computational model of the CA1 pyramidal neuron. (A) NEURON simulation of current families evoked by depolarizations from −60 to +80 mV (20-mV steps). Holding potential was −100 mV. (B) Gp-V and steady-state inactivation curves of CSI (black) and CSI + OSI (red). (C) Somatic (dim traces) and the corresponding dendritic (solid; 400 µm from the soma) APs from a 90-ms stimulation of 150 pA at the soma. (D) Latency to the first somatic spike with a 40-pA stimulation for 200 ms (rheobase for CSI model at 200 ms). (E) Simulated somatic AP trains assuming specific Markov schemes: CSI (black) and CSI + OSI (red). AP firing was elicited by injecting 250 pA over a period of 200 ms. (F) Overlay of the first (thick) and the last (thin) AP in the trains shown in A. (G) Summary of somatic AP properties. Each point corresponds to an AP, and the shape of the symbol denotes the pathway of inactivation (diamond, CSI; triangle, CSI + OSI). The color gradient represents the fraction of available Kv4.2 channels at the AHP before the spike (i.e., maximal availability preceding the spike).
RESULTS
Is the relationship between the activation and inactivation curves a good indicator of the preferred inactivation pathway?
Although diverse electrophysiological, computational, and structural methods have been used to deduce the pathways and mechanisms of inactivation in voltage-gated ion channels (Bean, 1981; Horn et al., 1981; Aldrich and Stevens, 1983; Ayer and Sigworth, 1997; Patil et al., 1998; Claydon and Fedida, 2007; Panyi and Deutsch, 2007; Dougherty et al., 2008; Kaulin et al., 2008; Cuello et al., 2010a,b), the relationship between the activation and steady-state inactivation curves is sometimes intuitively used as a preliminary indicator of how these ion channels may inactivate (Patil et al., 1998). This may, however, result in a misleading interpretation of the results. Assuming OSI (Fig. S1), we simulated the relationship between the peak chord conductance–voltage curve (GP-V relation) and the steady-state inactivation curve and only varied the backward rate constant of the inactivation equilibrium (Fig. 2). As this rate constant is decreased and the steady-state inactivation curve is shifted to the left, the crossover of the activation and inactivation curves becomes imperceptible (i.e., no observable window current). In an experimental situation, observing profound inactivation before detecting macroscopic activation may, at first glance, suggest the presence of CSI, when in fact the pathway is strict OSI. In light of this problem and the impractical general application of other commonly used methods to investigate inactivation pathways and mechanisms in voltage-gated ion channels, we set out to implement a simple modeling-independent general procedure to unambiguously determine the pathways of inactivation. Ultimately, this method should be applicable to both recombinant ion channels expressed heterologously and native ion channels in excitable tissues.
Simulating the predictions of OSI and CSI
A combination of single- and double-pulse inactivation protocols might be generally sufficient to evaluate inactivation and diagnose unambiguously the inactivation pathways of voltage-gated ion channels (Introduction). To illustrate accordingly the predictions of strict OSI and CSI, we assumed Schemes I and II (Fig. S1) and simulated the A-type outward currents evoked by these protocols (Materials and methods). Table S1 lists the parameter values used in these simulations. Specifically, we determined the following properties: (a) the development of inactivation induced by a single-pulse protocol and the voltage dependence of the time constant of inactivation; (b) the development of inactivation induced by the double-pulse protocol; and (c) the temporal relation between the rate of double-pulse inactivation and the profile of the current elicited by the single-pulse protocol. The two protocols evaluate inactivation at an identical voltage. This voltage was chosen to observe relatively slow activation and slow but profound inactivation, which under experimental conditions would allow accurate resolution of the current profile.
The strict OSI simulation (Fig. S1, Scheme I) reveals the key features of this pathway (Fig. 3). First, because inactivation is strictly coupled to activation, macroscopic inactivation accelerates indirectly with depolarization of the membrane potential (i.e., time constant decreases) and approaches a plateau level as voltage-dependent activation reaches its maximum (Fig. 3 C). The plateau level thus corresponds to the intrinsically voltage-independent time constant of inactivation. Second and most critical, the rate of double-pulse inactivation (negative first derivative of the double-pulse inactivation profile in Fig. 3 E) precisely superimposes on the trajectory of the current evoked by a single pulse (Fig. 3 F). The latter directly reflects the time dependence of the open probability and, therefore, the precise overlay conclusively shows that inactivation is directly proportional to pore opening (i.e., strict OSI).
Similarly, the simulation of strict CSI (Fig. S1, Scheme II) reveals contrasting features (Fig. 4). The time constant of inactivation does not decrease monotonically to a plateau level with depolarization of the membrane potential. Instead, first it decreases to a minimum at negative voltages and, as the membrane potential becomes more positive, the time constant increases gradually (Fig. 4 C). This behavior produces a J-shape plot typically associated with preferential CSI (Klemic et al., 2001; Patil et al., 1998; Amarillo et al., 2008; Kaulin et al., 2008). Moreover, the rate of inactivation does not follow the trajectory of the current (Fig. 4 F). The degree to which the trajectory of the rate of inactivation is left shifted with respect to the trajectory of the current depends on the rate constants governing pre-open CSI and the allosteric coupling between voltage-dependent activation and CSI. These properties depend on the allosteric factors f and g in Scheme II (Fig. S1 and Fig. 4, G–H). These results demonstrate that the time-dependent open probability does not dictate the rate of inactivation because channels are not directly inactivating from the open state.
Recombinant and native high voltage–activated A-type Kv channels undergo preferential OSI
Armed with the theoretical proof-of-principle predictions described above, we probed the pathway of inactivation of recombinant and native Kv3.4 channels. These A-type Kv channels are high voltage activated and exhibit classical N-type inactivation (Rettig et al., 1992). Based on the latter, we hypothesized that Kv3.4 channels exhibit OSI. To test this prediction, we applied the two inactivation protocols described above to recombinant and native Kv3.4 channels. First, we investigated recombinant Kv3.4 channels expressed in Xenopus oocytes (Fig. 5). The relationship between the steady-state inactivation curve and the GP-V relation indicates 50% inactivation at −30 mV, a voltage at which there is no perceptible voltage-dependent increase in peak conductance (Fig. 5 B). As demonstrated above (Fig. 2), however, this observation alone does not speak against OSI. At a very low open probability, OSI might take place when inactivation rate constants strongly favor OSI. Confirming OSI in Kv3.4 channels, the proposed approach yielded two key observations. First, the time constant of macroscopic current inactivation decreases monotonically to a plateau level as the membrane potential becomes increasingly more depolarized (Fig. 5 C). Then, we determined the time course of inactivation using the double-pulse inactivation protocol and computed the rate of inactivation. Indicating that the single- and double-pulse inactivation protocols monitor the same process, the time constants of inactivation separately determined from these measurements are very similar (Fig. 5 C and Table 1). Critically, as predicted by strict OSI, the rate of inactivation closely follows the profile of the current at identical voltages. Therefore, the rate of inactivation is directly dictated by the time-dependent change in open probability.
Figure 5.

The recombinant Kv3.4 channel expressed in Xenopus oocytes undergoes strict OSI. (A) Family of whole oocyte outward currents evoked by a series of voltage steps (inset). (B) Normalized GP-V and steady-state inactivation curves (closed and open circles, respectively). The steady-state inactivation protocol used 10-s conditioning pulses and a test pulse to +70 mV. Red solid lines are the best-fit fourth-order Boltzmann (GP-V curve) and a Boltzmann (steady-state inactivation) function (best-fit parameters and descriptive statistics are summarized in Table 1). (C) Voltage dependence of the time constant of inactivation. Time constants or weighted time constants were determined from the best-fit exponential or sum of two exponentials that describes the decay phase of the currents, respectively. For comparison, the red symbol in C indicates the time constant determined from the double-pulse protocol. (D) Outward currents evoked by a double-pulse protocol with a 5-ms resetting gap between the two pulses (inset). The conditioning pulse activated 12% of the peak conductance. (E) Kinetics of double-pulse inactivation. The normalized peak current evoked by the test pulse of the protocol in D plotted against the duration of the conditioning pulse (closed circles). The solid red line represents the following empirical best-fit sum of exponential terms: I/I0 (t) = 0.52 − 0.38(1 − e−t/88)1.3 + 0.48e−t/280. (F) Overlay of the average outward current (mean ± SEM; black and gray, respectively) evoked by a single pulse (−100 to 0 mV) and the rate of inactivation (red) at 0 mV. The rate of inactivation is the scaled negative first derivative of the red solid line in E. The blue solid line is the exponential function that best describes the decay phase of the current trace (black). The scaled negative first derivative of the observed time course of double-pulse inactivation is also plotted (open black circles) for comparison.
Table 1.
Gating properties of simulated, recombinant, and native A-type Kv channels
| Parameter | V1/2,act | kact | V1/2,inact | kinact | τinact,SP | τinact,DP | VSP/DPa |
| mV | mV | mV | mV | ms | ms | mV | |
| Simulated OSI | 20 | 20.6 | −28.5 | 7.5 | 87.4 | 90.2 | 0 |
| Recombinant Kv3.4 | 28.5 ± 2 (n = 11) | 19.5 ± 0.9 (n = 11) | −36.8 ± 5.3 (n = 5) | 9.9 ± 2.9 (n = 5) | 144 ± 24 (n = 11) | 148 (n = 9) | 0 |
| Native Kv3.4 | 28.4 ± 6 (n = 5) | 25.3 ± 1.2 (n = 5) | −29 ± 2.5 (n = 8) | 8 ± 1.8 (n = 8) | 42.2 ± 5.7 (n = 10) | 33.6 (n = 4) | −10 |
| Simulated CSI | −30 | 27.45 | −108.74 | 4.04 | 11.05 | 10.4 | −20 |
| Recombinant Kv4.2 + DPP6-S + KChIP-1 | −7.3 ± 5.1 (n = 9) | 32.7 ± 1.7 (n = 9) | −89.3 ± 3.6 (n = 5) | 7 ± 0.8 (n = 5) | 18.7 ± 1.3 (n = 9) | 20 (n = 9) | −45 |
| Native Kv4.2 + DPP6-S + KChIP-1 | −8.5 ± 9.6 (n = 5) | 31 ± 3 (n = 5) | −77.5 ± 0.9 (n = 5) | 11.8 ± 0.8 (n = 5) | 30 ± 5.5 (n = 5) | 28.08 (n = 5) | −45 |
| Recombinant Kv4.2 + DPP6-S | −28.2 ± 3.7 (n = 6) | 27.2 ± 1.4 (n = 6) | −87.5 ± 4.4 (n = 5) | 4.9 ± 0.5 (n = 5) | 31.9 ± 4.3 (n = 6) | 34.9 (n = 6) | −65 |
| Recombinant Kv4.2 + DPP10a + KChIP-1 | 9.4 ± 5.2 (n = 7) | 40.4 ± 5.1 (n = 7) | −71.1 ± 3.3 (n = 7) | 5.6 ± 0.7 (n = 7) | 50.9 ± 8.6 (n = 7) | 51 (n = 7) | −35 |
The voltage at which the single-pulse (SP) and double-pulse (DP) inactivation time constants were measured.
To further test the hypothesis on the native Kv3.4 channel, we investigated the high voltage–activated K+ current (IHVA) expressed in small-diameter DRG neurons (Fig. 6). Previous work confirmed that the Kv3.4 channel underlies this neuronal current (Ritter et al., 2012). As with the recombinant counterpart expressed heterologously, two critical biophysical features strongly favor strict OSI in native Kv3.4 channels: (1) the time constant of inactivation decreases with voltage and approaches a plateau level (Fig. 6 C); and (2) at identical voltages, the rate of inactivation and the current profile closely superimpose (Fig. 6 F). We obtained qualitatively identical results with recombinant ShakerB Kv channels expressed heterologously (Fig. S2), which are known to undergo strict OSI (Hoshi et al., 1990).
Figure 6.

The native Kv3.4 channel expressed in DRG neurons undergoes strict OSI. Currents were recorded under cell-attached patch-clamping conditions (Materials and methods). Details of A–F are as described in the Fig. 5 legend. For comparison, the red symbol in C indicates the time constant determined from the double-pulse protocol. The conditioning pulse in D activated 16% of the peak conductance. The complex steady-state inactivation curve reflects the complexity of the native system including a dominant Kv3.4 component and two minor components corresponding to a low voltage–activated A-type K+ current described previously and a sustained outward current (Ritter et al., 2012). The best-fit parameters describing the small voltage-dependent component of the double Boltzmann were V1/2 = −98 mV and k = 3 mV. The solid red line in E represents the following empirical best-fit sum of exponential terms: I/I0 (t) = 0.79 − 0.16(1 − e−t/16)3 + 0.2e−t/177.
Recombinant and native low voltage–activated A-type Kv channels undergo CSI
Previously, multiple approaches have strongly suggested that recombinant Kv4.x channels undergo CSI (Bähring and Covarrubias, 2011). Furthermore, preferential CSI is thought to be the inactivation pathway of Kv4.x ternary channels, including two distinct accessory subunits, KChIPs and DPPs (Amarillo et al., 2008; Maffie and Rudy, 2008). These channel complexes are generally thought to underlie neuronal low voltage–activated A-type K+ currents (Hoffman et al., 1997; Shibata et al., 2000; Jerng et al., 2004; Hu et al., 2006; Kim et al., 2007; Maffie and Rudy, 2008). To test the preferential CSI hypothesis of the recombinant Kv4.2 ternary complex expressed heterologously (Materials and methods), we used the single- and double-pulse inactivation protocols (Fig. 7). First, we noticed that the time constant of current decay first decreases modestly at negative membrane potentials, reaches a minimum, and then increases gradually as the voltage step is progressively more positive (Fig. 7 C). This J-shape profile is predicted by CSI (Fig. 4 C). Furthermore, confirming CSI, the rate of inactivation falls sharply before the current profile reaches its peak (Fig. 7 F). That is, the time-dependent increase in open probability and the rate of inactivation at identical voltages are not synchronized because inactivation is already developing before the channel opens. Finally, the time constants of single- and double-pulse inactivation closely agree, confirming that both pulse protocols monitor the same process (Fig. 7 C and Table 1).
Figure 7.

The recombinant Kv4.2 ternary channel complex expressed in tsA-201 cells undergoes preferential CSI. Currents were recorded under cell-attached patch-clamping conditions (Materials and methods). Details of A–F are as described in the Fig. 5 legend. For comparison, the red symbol in C indicates the time constant determined from the double-pulse protocol. The conditioning pulse in D activated 15% of the peak conductance. The solid red line in E represents the following empirical best-fit sum of exponential terms: I/I0 (t) = 0.36e−t/6.5 + 0.54e−t/34 − 0.11. The negative first derivative of the observed time course of double-pulse inactivation is also plotted (open black circles) for comparison.
We have also previously hypothesized that preferential CSI is the pathway of inactivation of native low voltage–activated A-type K+ currents (ILVA) expressed in CGNs (Amarillo et al., 2008). These channels are composed of Kv4.2 or Kv4.3 and two accessory subunits, KChIP1/3 and DPP6-S (Maffie and Rudy, 2008). As with the recombinant Kv4.2 ternary channel complex, by combining single- and double-pulse inactivation protocols, we can show that the native counterpart in CGNs also undergoes CSI (Fig. 8). The voltage dependence of the time constant of inactivation exhibits a J-shape (Fig. 8 C) and, moreover, the rate of inactivation and the profile of the current at identical voltages do not superimpose (Fig. 8 F), just as expected for CSI.
Figure 8.

The native Kv4.2 ternary channel complex expressed in CGNs exhibits preferential CSI. Currents were recorded under cell-attached patch-clamping conditions (Materials and methods). Details of A–F are as described in the Fig. 5 legend. For comparison, the red symbol in C indicates the time constant determined from the double-pulse protocol. The conditioning pulse in D activated 14% of the peak conductance. The solid red line in E represents the following empirical best-fit sum of exponential terms: I/I0 (t) = 0.38e−t/6.6 + 0.38e−t/76 + 0.23.
The subunit composition of Kv4.2 channel complexes determines the pathway of inactivation
Accessory subunits may shape the pathways of inactivation in A-type Kv channels (Bähring et al., 2001; Beck et al., 2002; Amarillo et al., 2008; Barghaan et al., 2008). For instance, KChIP1 constitutively sequesters the Kv4.x inactivation domain and, thereby, eliminates the N-type–like OSI mechanism in Kv4.x channels (Beck et al., 2002). In contrast, a five-residue N-terminal sequence in DPP10a and DPP6a confers N-type–like OSI to Kv4.2 channels in the presence of KChIP1 or KChIP3 (Jerng et al., 2009). Therefore, we hypothesized that a binary channel complex including Kv4.2 and DPP6-S (no KChIP1) and the ternary Kv4.2 channel complex including KChIP1 and DPP10a may exhibit preferential OSI as observed with Kv3.4 channels. Supporting constitutive CSI in Kv4 channels, however, these complexes display hybrid inactivation phenotypes when applying the single- and double-pulse inactivation protocols. As with Kv3.4 channels, the time constant of inactivation decreases as the voltage becomes more positive and approaches a plateau level (Figs. 9 C and 10 C). The absence of KChIP1 or presence of DPP10a essentially eliminates the J-shape profile as OSI is enabled. At the same time, as with the recombinant and native Kv4.2 ternary channel complexes, the rates of inactivation and current profiles do not superimpose when KChIP1 is absent or DPP10a is replaced for DPP6-S (Figs. 9 F and 10 F). Under these conditions, Kv4.2 channel CSI appears to be intact. Scheme III with or without connection between I5 and IO1 (Fig. S1, OSI + CSI) was sufficient to readily simulate the hybrid inactivation features (not depicted).
Figure 9.

The recombinant Kv4.2–DPP6-S binary channel complex expressed in tsA-201 cells exhibits a hybrid inactivation phenotype. Currents were recorded under cell-attached patch-clamping conditions (Materials and methods). Details of A–F are as described in the Fig. 5 legend. For comparison, the red symbol in C indicates the time constant determined from the double-pulse protocol. The conditioning pulse in D activated 11% of the peak conductance. The solid red line in E represents the following empirical best-fit sum of exponential terms: I/I0 (t) = 0.42e−t/65 + 0.58e−t/12.28 − 0.01.
Figure 10.

The recombinant Kv4.2–KChIP1-DPP10a ternary channel complex expressed in tsA-201 cells exhibits a hybrid inactivation phenotype. Currents were recorded under cell-attached patch-clamping conditions (Materials and methods). Details of A–F are as described in the Fig. 5 legend. For comparison, the red symbol in C indicates the time constant determined from the double-pulse protocol. The conditioning pulse in D activated 15% of the peak conductance. The solid red line in E represents the following empirical best-fit sum of exponential terms: I/I0 = .5 − .52(1 − exp(−t/10))^1.4 + .5*exp(−t/120).
DISCUSSION
We have shown how the combination of two simple pulse protocols applied to macroscopic currents helps determine unambiguously the pathways of inactivation in A-type Kv channels. This method essentially asks whether or not the open probability quantitatively dictates the rate of inactivation and, therefore, determines whether or not a Kv channel must open before inactivating. Originally, Bean (1981) developed this method to show conclusively that crayfish Nav channels need not open before they inactivate; that is, these channels undergo CSI. Quantitative analyses have confirmed this conclusion in studies of mammalian and squid Nav channels (Horn et al., 1981; Aldrich and Stevens, 1983; Armstrong, 2006). In addition, we showed that the voltage dependence of the time constant of macroscopic inactivation can also help determine the presence of preferential CSI. Demonstrating how this method can generally discern inactivation pathways in different relevant scenarios, the data conclusively establish that: (a) OSI is the preferential pathway of inactivation in both recombinant and native (neuronal) Kv3.4 channels; (b) CSI is the preferential pathway of inactivation in recombinant Kv4.2 ternary complexes and the native (neuronal) counterpart; and (c) the ternary Kv4.2 complex including DPP10a instead of DPP6-S and the binary Kv4.2 complex excluding KChIP-1 but keeping DPP6-S undergo both CSI and OSI.
Finding CSI in all cases concerning the Kv4.2 channel is consistent with previous studies suggesting that this pathway of inactivation is constitutively conferred by Kv4.x pore-forming subunits (Bähring and Covarrubias, 2011). For instance, the N-terminal–deleted Kv4.3 channel expressed alone exhibits a J-shape profile in the voltage dependence of the time constant of inactivation (Kaulin et al., 2008). This profile is similarly observed when KChIP1 sequesters the N-terminal inactivation domain (NTID) of Kv4.2 or Kv4.3 in the absence of DPP6-S (Amarillo et al., 2008; Kaulin et al., 2008). Also, profound gating charge immobilization with voltage and time dependence indistinguishable from inactivation occurs in Kv4.2 channels at hyperpolarized voltages before the channel opens (Dougherty et al., 2008). The role of accessory subunits is to directly determine whether Kv4.x channels undergo OSI or not, that is, either by sequestering the intrinsic NTID (KChIPs) or adding an accessory NTID (e.g., DPP10a). Although studies suggest that accessory subunits can also affect CSI (Beck et al., 2002; Jerng et al., 2005; Amarillo et al., 2008; Barghaan and Bähring, 2009), this change might be an indirect consequence of removing/adding OSI and promoting voltage-dependent gating (Dougherty and Covarrubias, 2006). Constitutive CSI in Kv4.2 channels parsimoniously explains why there is a hybrid inactivation phenotype when KChIP1 and DPP10a are present (Fig. 10) and when DPP6-S is present but KChIP1 is absent (Fig. 9). In both cases, the rate of inactivation is not dictated by open probability (i.e., CSI), but the voltage dependence of the time constant of inactivation exhibits a monotonic profile because the free NTIDs of the channel or DPP10a confer OSI while leaving CSI constitutively conferred by the Kv4.x pore-forming subunits relatively intact.
Practical considerations of the two-protocol method
Using two conventional pulse protocols, we have shown clear-cut elucidation of the pathways of inactivation in seven different instances, including two native systems (Figs. 5–10 and Fig. S2). To evaluate the general application of this method, a few key issues need special attention. First, electrophysiological and/or pharmacological strategies must be used to ensure isolation of the currents under investigation. For native systems (DRG and CGNs), we used a specific conditioning pulse and a pore blocker (TEA) to isolate the Kv3.4 and Kv4.2 currents, respectively (Materials and methods). Indicating proper isolation and homogeneity, these native currents display biophysical properties that are similar to those observed in heterologous expression systems (Amarillo et al., 2008; Ritter et al., 2012) (Figs. 6 and 8). Also, the time constants of inactivation measured from the decay of the current and double-pulse inactivation are indistinguishable (Figs. 5–10 and Table 1). Functional homogeneity is critical when investigating Kv channel complexes, including accessory subunits that affect inactivation gating, because a variable subunit composition may produce confounding results. Second, when recording native cell–attached patches under physiological ionic conditions, the resting membrane potential of the cell must remain constant to ensure that the single- and double-pulse measurements are obtained at exactly the same voltage. Otherwise, voltage errors will confound the relationship between the current profile and the rate of inactivation. Third, fitting an empirical sum of exponentials to the development of double-pulse inactivation is also a critical step because the negative first derivative of this empirical function measures the rate of inactivation. Thus, detecting a significant lag in the decay of this curve when expecting OSI depends on two key factors: (1) the use of very brief Δt intervals in the conditioning pulse to allow monitoring of the early phase of the inactivation process; and (2) accurate description of this phase by the empirical function. In the instances described here (e.g., Figs. 5 and 6), rapid sampling and visual inspection of the fit provided the most reliable description of an apparent lag. In addition, we computed the negative first derivative of the experimental data points (open circles in Figs. 5 F and 7 F). To compare against the current profile, this calculation may in some cases be sufficient to determine the rate of inactivation in a manner that is curve fitting independent. In this case, however, low variance in the early phase of the double-pulse inactivation profile is critical. Otherwise, false rate changes occur as the discrete first derivative fluctuates randomly between data points. Nevertheless, high variability and lack of a decreasing trend in the resulting discrete derivative of the early phase served as an independent qualitative indicator of a significant lag in the development of double-pulse inactivation.
There would be special cases where this method may not be sufficient to unambiguously elucidate the pathways of inactivation. For instance, if the open probability is relatively high at low voltages and both inactivation pathways exist but OSI is fast and nearly absorbing (preferential OSI), CSI might not be detected (i.e., no appreciable leftward shift of the rate of inactivation relative to the current profile). Presumably, as the simulations suggest, CSI is clearly apparent in the instance that includes DPP10a or in the absence of KChIP1 (Figs. 9 and 10) because the open probability is relatively low and OSI is relatively unstable (Scheme III in Fig. S1 and Table S1).
The neurophysiological implications of inactivation pathways in A-type Kv channels
How do the pathways of inactivation influence the physiological activity of neuronal A-type K+ channels? Neuronal Kv3.4 channels are high voltage activated and actively shape the repolarization of the AP in DRG neurons (Ritter et al., 2012). Thus, fast preferential OSI (Figs. 5 and 6) would be an effective way to tightly regulate the channel’s physiological role. Moreover, the functional impact of Kv3.4 channels is enhanced upon slowing of OSI (Ritter et al., 2012). The spectrum of effects of Kv4.2 activity on spiking is broader because the neuronal Kv4.2 ternary complexes including KChIPs and DPPs are capable of influencing both sub- and supra-threshold activities. CSI regulates the channel’s availability at sub-threshold membrane potentials, which could then influence the latency to the first spike, interspike interval (ISI), and bAPs. Given the J-shape voltage dependence of inactivation kinetics, however, the channels that survive CSI could impact supra-threshold properties (e.g., spike width) in an activity-dependent manner. The supra-threshold activity of Kv4.x complexes including OSI-conferring accessory subunits DPP10a or DPP6a would be under tighter regulation because of the presence of OSI. These roles would not be limited to Kv4.x channels; neuronal Kv1.x channels are also capable of regulating sub- and supra-threshold properties (Johnston et al., 2010) and, therefore, are also expected to combine CSI and OSI to regulate their activity.
To formulate a working hypothesis that explains how different pathways of Kv4.2 inactivation may differentially shape neurophysiological activity, we chose the hippocampal CA1 neuron as a working model. The somatodendritic Kv4.2 A-type K+ current in these neurons is well characterized and plays major roles regulating spiking and spike properties (Hoffman et al., 1997; Kim et al., 2005, 2007). Concretely, we exploited a previously reported computational model of the hippocampal CA1 neuron (Migliore et al., 1999) by substituting a conventional Hodgkin–Huxley model of the A-type K+ conductance with Markov kinetic schemes that specifically assume either preferential CSI or CSI + OSI (Fig. S1; Materials and methods). OSI alone is not considered here because, as discussed above, CSI is a constitutive property of Kv4.2 channels. In contrast, OSI in these channels depends on the presence of specific auxiliary subunits. The simulation parameters in these schemes are identical, except that the CSI + OSI scheme additionally includes two sequential inactivation steps originating from the open state (Fig. S1 and Table S1). The latter is based on previous studies of Kv4.x inactivation gating in the absence of accessory subunits (Bähring et al., 2001; Beck and Covarrubias, 2001; Dougherty et al., 2008). Note that although the CSI and CSI + OSI models predict similar peak conductance and steady-state inactivation curves, the currents evoked by step depolarizations exhibit distinct profiles (Fig. 11, A and B). Whereas CSI generates slowly inactivating currents at positive voltages (resembling the behavior of ternary Kv4.2 channels), CSI + OSI generates rapidly inactivating currents at positive voltages (resembling the behavior of ternary Kv4.2 channels including DPP10a instead of DPP6-S). Then, we examined the properties of the somatic and dendritic spikes. Distinct time-dependent properties of the A-type K+ conductances predict substantial differences in the properties of individual spikes and spike trains. First, bAPs in distal regions of the apical dendrite (400 µm from soma) undergo substantial attenuation when preferential CSI is assumed. By comparison, this attenuation is still substantial but smaller when assuming CSI + OSI (Table 2 and Fig. 11 C). Second, upon injection of identical current, the latency to the first somatic spike is shorter when assuming CSI + OSI (Table 2 and Fig. 11 D). Third, during a somatic AP train, there is activity-dependent spike broadening, modest attenuation of peak AP amplitude and afterhyperpolarization (AHP), and shortening of the ISI when assuming CSI (Table 2 and Fig. 11, E–G). If CSI + OSI is assumed, peak AP amplitude undergoes more severe attenuation, AHP is depolarized, and the ISI is shortened to a lesser degree (Table 2 and Fig. 11, E–G). Qualitatively, the spiking properties conferred by preferential CSI are in agreement with experimental observations (Hoffman et al., 1997; Migliore et al., 1999; Kim et al., 2005). These simulations thus demonstrate how the pathways of inactivation can broadly determine the physiological activity of Kv4.2 channels in the sub- and supra-threshold range of membrane potentials. Furthermore, they predict that OSI conferred by DPP10a, as seen in cortical neurons (Jerng et al., 2007), may further reduce the availability of Kv4.2 channels with two separate consequences: (1) tone down the impact of the A-type K+ current on bAPs and the latency to the first spike; and (2) remodel the spiking properties of somatic AP trains. Follow-up studies focusing on manipulating the subunit composition of Kv4.2 channels will help directly test how distinct pathways of inactivation actually regulate the spiking properties of neurons. The modeling-independent analysis reported here would help elucidate the pathways of inactivation in these experiments.
Table 2.
Properties of simulated APs in a model of the hippocampal CA1 neuron
| AP Property | CSI | CSI + OSI |
| bAP peak (mV) | −47 | −33 |
| Latencya (ms) | 173 | 143 |
| Kv4.2 availability (first/last AP)b | 0.87/0.21 (0.25) | 0.87/0.10 (0.11) |
| Peak (mV) | 16.2/12.3 | 16.6/1.4 |
| (0.76) | (0.09) | |
| AHP (mV) | −64.0/−56.7 | −59.5/−50.3 |
| (0.88) | (0.85) | |
| ISI (ms) | 11.3/10.5 | 11.4/11.3c |
| (0.95) | (0.99) | |
| Width50 (ms) | 0.56/0.79 | 0.53/1.22 |
| (1.42) | (2.30) |
In response to a 40-pA current injection.
Comparing the channel availability corresponding to the first and last AP (first/last). For all properties, the number in parenthesis is the fold change between the first and last AP.
Although the ISI ratio indicates no change between the first and the last interval, the time course shows slight rising and falling of the ISI during the AP train.
Supplementary Material
Acknowledgments
We thank the Covarrubias Laboratory, members of JDF thesis committee (Drs. Thomas Butler, Brad Rothberg, and Ji-fang Zhang), Dr. Richard Horn, and Dr. Marion Siegman for helpful feedback. We also thank Drs. Jose de Santiago-Castillo and Kelly Dougherty for their comments and advice on modeling.
This work was supported in part by National Institutes of Health grant R01-NS032337. This manuscript fulfills part of the requirements toward a doctoral degree in Physiology and Biophysics from Thomas Jefferson University for J.D. Fineberg.
Kenton J. Swartz served as editor.
Footnotes
Abbreviations used in this paper:
- AHP
- afterhyperpolarization
- AP
- action potential
- bAP
- back-propagating AP
- CGN
- cerebellar granule neuron
- CSI
- closed-state inactivation
- DRG
- dorsal root ganglion/ganglia
- ISI
- interspike interval
- Kv
- voltage-gated K+
- Nav
- voltage-gated Na+
- NTID
- N-terminal inactivation domain
- OSI
- open-state inactivation
References
- Aldrich R.W., Stevens C.F. 1983. Inactivation of open and closed sodium channels determined separately. Cold Spring Harb. Symp. Quant. Biol. 48:147–153 10.1101/SQB.1983.048.01.017 [DOI] [PubMed] [Google Scholar]
- Amarillo Y., De Santiago-Castillo J.A., Dougherty K., Maffie J., Kwon E., Covarrubias M., Rudy B. 2008. Ternary Kv4.2 channels recapitulate voltage-dependent inactivation kinetics of A-type K+ channels in cerebellar granule neurons. J. Physiol. 586:2093–2106 10.1113/jphysiol.2007.150540 [DOI] [PMC free article] [PubMed] [Google Scholar]
- Armstrong C.M. 2006. Na channel inactivation from open and closed states. Proc. Natl. Acad. Sci. USA. 103:17991–17996 10.1073/pnas.0607603103 [DOI] [PMC free article] [PubMed] [Google Scholar]
- Ayer R.K., Jr, Sigworth F.J. 1997. Enhanced closed-state inactivation in a mutant Shaker K+ channel. J. Membr. Biol. 157:215–230 10.1007/s002329900230 [DOI] [PubMed] [Google Scholar]
- Bähring R., Covarrubias M. 2011. Mechanisms of closed-state inactivation in voltage-gated ion channels. J. Physiol. 589:461–479 10.1113/jphysiol.2010.191965 [DOI] [PMC free article] [PubMed] [Google Scholar]
- Bähring R., Boland L.M., Varghese A., Gebauer M., Pongs O. 2001. Kinetic analysis of open- and closed-state inactivation transitions in human Kv4.2 A-type potassium channels. J. Physiol. 535:65–81 10.1111/j.1469-7793.2001.00065.x [DOI] [PMC free article] [PubMed] [Google Scholar]
- Barghaan J., Bähring R. 2009. Dynamic coupling of voltage sensor and gate involved in closed-state inactivation of Kv4.2 channels. J. Gen. Physiol. 133:205–224 10.1085/jgp.200810073 [DOI] [PMC free article] [PubMed] [Google Scholar]
- Barghaan J., Tozakidou M., Ehmke H., Bähring R. 2008. Role of N-terminal domain and accessory subunits in controlling deactivation-inactivation coupling of Kv4.2 channels. Biophys. J. 94:1276–1294 10.1529/biophysj.107.111344 [DOI] [PMC free article] [PubMed] [Google Scholar]
- Bean B.P. 1981. Sodium channel inactivation in the crayfish giant axon. Must channels open before inactivating? Biophys. J. 35:595–614 10.1016/S0006-3495(81)84815-1 [DOI] [PMC free article] [PubMed] [Google Scholar]
- Beck E.J., Covarrubias M. 2001. Kv4 channels exhibit modulation of closed-state inactivation in inside-out patches. Biophys. J. 81:867–883 10.1016/S0006-3495(01)75747-5 [DOI] [PMC free article] [PubMed] [Google Scholar]
- Beck E.J., Bowlby M., An W.F., Rhodes K.J., Covarrubias M. 2002. Remodelling inactivation gating of Kv4 channels by KChIP1, a small-molecular-weight calcium-binding protein. J. Physiol. 538:691–706 10.1113/jphysiol.2001.013127 [DOI] [PMC free article] [PubMed] [Google Scholar]
- Claydon T.W., Fedida D. 2007. Voltage clamp fluorimetry studies of mammalian voltage-gated K+ channel gating. Biochem. Soc. Trans. 35:1080–1082 10.1042/BST0351080 [DOI] [PubMed] [Google Scholar]
- Cuello L.G., Jogini V., Cortes D.M., Pan A.C., Gagnon D.G., Dalmas O., Cordero-Morales J.F., Chakrapani S., Roux B., Perozo E. 2010a. Structural basis for the coupling between activation and inactivation gates in K+ channels. Nature. 466:272–275 10.1038/nature09136 [DOI] [PMC free article] [PubMed] [Google Scholar]
- Cuello L.G., Jogini V., Cortes D.M., Perozo E. 2010b. Structural mechanism of C-type inactivation in K+ channels. Nature. 466:203–208 10.1038/nature09153 [DOI] [PMC free article] [PubMed] [Google Scholar]
- Desai R., Kronengold J., Mei J., Forman S.A., Kaczmarek L.K. 2008. Protein kinase C modulates inactivation of Kv3.3 channels. J. Biol. Chem. 283:22283–22294 10.1074/jbc.M801663200 [DOI] [PMC free article] [PubMed] [Google Scholar]
- Dougherty K., Covarrubias M. 2006. A dipeptidyl aminopeptidase–like protein remodels gating charge dynamics in Kv4.2 channels. J. Gen. Physiol. 128:745–753 10.1085/jgp.200609668 [DOI] [PMC free article] [PubMed] [Google Scholar]
- Dougherty K., De Santiago-Castillo J.A., Covarrubias M. 2008. Gating charge immobilization in Kv4.2 channels: the basis of closed-state inactivation. J. Gen. Physiol. 131:257–273 10.1085/jgp.200709938 [DOI] [PMC free article] [PubMed] [Google Scholar]
- Hille B. 2001. Ion Channels of Excitable Membranes. Third Edition. Sinauer Associates, Inc., Sunderland, MA: 814 pp [Google Scholar]
- Hines M.L., Carnevale N.T. 1997. The NEURON simulation environment. Neural Comput. 9:1179–1209 10.1162/neco.1997.9.6.1179 [DOI] [PubMed] [Google Scholar]
- Hoffman D.A., Magee J.C., Colbert C.M., Johnston D. 1997. K+ channel regulation of signal propagation in dendrites of hippocampal pyramidal neurons. Nature. 387:869–875 [DOI] [PubMed] [Google Scholar]
- Horn R., Patlak J., Stevens C.F. 1981. Sodium channels need not open before they inactivate. Nature. 291:426–427 10.1038/291426a0 [DOI] [PubMed] [Google Scholar]
- Hoshi T., Zagotta W.N., Aldrich R.W. 1990. Biophysical and molecular mechanisms of Shaker potassium channel inactivation. Science. 250:533–538 10.1126/science.2122519 [DOI] [PubMed] [Google Scholar]
- Hoshi T., Zagotta W.N., Aldrich R.W. 1991. Two types of inactivation in Shaker K+ channels: effects of alterations in the carboxy-terminal region. Neuron. 7:547–556 10.1016/0896-6273(91)90367-9 [DOI] [PubMed] [Google Scholar]
- Hu H.-J., Carrasquillo Y., Karim F., Jung W.E., Nerbonne J.M., Schwarz T.L., Gereau R.W., IV 2006. The Kv4.2 potassium channel subunit is required for pain plasticity. Neuron. 50:89–100 10.1016/j.neuron.2006.03.010 [DOI] [PubMed] [Google Scholar]
- Jerng H.H., Pfaffinger P.J., Covarrubias M. 2004. Molecular physiology and modulation of somatodendritic A-type potassium channels. Mol. Cell. Neurosci. 27:343–369 10.1016/j.mcn.2004.06.011 [DOI] [PubMed] [Google Scholar]
- Jerng H.H., Kunjilwar K., Pfaffinger P.J. 2005. Multiprotein assembly of Kv4.2, KChIP3 and DPP10 produces ternary channel complexes with ISA-like properties. J. Physiol. 568:767–788 10.1113/jphysiol.2005.087858 [DOI] [PMC free article] [PubMed] [Google Scholar]
- Jerng H.H., Lauver A.D., Pfaffinger P.J. 2007. DPP10 splice variants are localized in distinct neuronal populations and act to differentially regulate the inactivation properties of Kv4-based ion channels. Mol. Cell. Neurosci. 35:604–624 10.1016/j.mcn.2007.03.008 [DOI] [PMC free article] [PubMed] [Google Scholar]
- Jerng H.H., Dougherty K., Covarrubias M., Pfaffinger P.J. 2009. A novel N-terminal motif of dipeptidyl peptidase-like proteins produces rapid inactivation of Kv4.2 channels by a pore-blocking mechanism. Channels (Austin). 3:448–461 10.4161/chan.3.6.10216 [DOI] [PMC free article] [PubMed] [Google Scholar]
- Johnston J., Forsythe I.D., Kopp-Scheinpflug C. 2010. Going native: voltage-gated potassium channels controlling neuronal excitability. J. Physiol. 588:3187–3200 10.1113/jphysiol.2010.191973 [DOI] [PMC free article] [PubMed] [Google Scholar]
- Kaulin Y.A., De Santiago-Castillo J.A., Rocha C.A., Covarrubias M. 2008. Mechanism of the modulation of Kv4:KChIP-1 channels by external K+. Biophys. J. 94:1241–1251 10.1529/biophysj.107.117796 [DOI] [PMC free article] [PubMed] [Google Scholar]
- Kaulin Y.A., De Santiago-Castillo J.A., Rocha C.A., Nadal M.S., Rudy B., Covarrubias M. 2009. The dipeptidyl-peptidase-like protein DPP6 determines the unitary conductance of neuronal Kv4.2 channels. J. Neurosci. 29:3242–3251 10.1523/JNEUROSCI.4767-08.2009 [DOI] [PMC free article] [PubMed] [Google Scholar]
- Kerschensteiner D., Stocker M. 1999. Heteromeric assembly of Kv2.1 with Kv9.3: effect on the state dependence of inactivation. Biophys. J. 77:248–257 10.1016/S0006-3495(99)76886-4 [DOI] [PMC free article] [PubMed] [Google Scholar]
- Kerschensteiner D., Monje F., Stocker M. 2003. Structural determinants of the regulation of the voltage-gated potassium channel Kv2.1 by the modulatory α-subunit Kv9.3. J. Biol. Chem. 278:18154–18161 10.1074/jbc.M213117200 [DOI] [PubMed] [Google Scholar]
- Kim J., Wei D.S., Hoffman D.A. 2005. Kv4 potassium channel subunits control action potential repolarization and frequency-dependent broadening in rat hippocampal CA1 pyramidal neurones. J. Physiol. 569:41–57 10.1113/jphysiol.2005.095042 [DOI] [PMC free article] [PubMed] [Google Scholar]
- Kim J., Jung S.C., Clemens A.M., Petralia R.S., Hoffman D.A. 2007. Regulation of dendritic excitability by activity-dependent trafficking of the A-type K+ channel subunit Kv4.2 in hippocampal neurons. Neuron. 54:933–947 10.1016/j.neuron.2007.05.026 [DOI] [PMC free article] [PubMed] [Google Scholar]
- Klemic K.G., Kirsch G.E., Jones S.W. 2001. U-type inactivation of Kv3.1 and Shaker potassium channels. Biophys. J. 81:814–826 10.1016/S0006-3495(01)75743-8 [DOI] [PMC free article] [PubMed] [Google Scholar]
- Kurata H.T., Fedida D. 2006. A structural interpretation of voltage-gated potassium channel inactivation. Prog. Biophys. Mol. Biol. 92:185–208 10.1016/j.pbiomolbio.2005.10.001 [DOI] [PubMed] [Google Scholar]
- Maffie J., Rudy B. 2008. Weighing the evidence for a ternary protein complex mediating A-type K+ currents in neurons. J. Physiol. 586:5609–5623 10.1113/jphysiol.2008.161620 [DOI] [PMC free article] [PubMed] [Google Scholar]
- Migliore M., Hoffman D.A., Magee J.C., Johnston D. 1999. Role of an A-type K+ conductance in the back-propagation of action potentials in the dendrites of hippocampal pyramidal neurons. J. Comput. Neurosci. 7:5–15 10.1023/A:1008906225285 [DOI] [PubMed] [Google Scholar]
- Murrell-Lagnado R.D., Aldrich R.W. 1993. Energetics of Shaker K channels block by inactivation peptides. J. Gen. Physiol. 102:977–1003 10.1085/jgp.102.6.977 [DOI] [PMC free article] [PubMed] [Google Scholar]
- O’Leary M.E., Horn R. 1994. Internal block of human heart sodium channels by symmetrical tetra-alkylammoniums. J. Gen. Physiol. 104:507–522 10.1085/jgp.104.3.507 [DOI] [PMC free article] [PubMed] [Google Scholar]
- Olcese R., Latorre R., Toro L., Bezanilla F., Stefani E. 1997. Correlation between charge movement and ionic current during slow inactivation in Shaker K+ channels. J. Gen. Physiol. 110:579–589 10.1085/jgp.110.5.579 [DOI] [PMC free article] [PubMed] [Google Scholar]
- Olcese R., Sigg D., Latorre R., Bezanilla F., Stefani E. 2001. A conducting state with properties of a slow inactivated state in a Shaker K+ channel mutant. J. Gen. Physiol. 117:149–163 10.1085/jgp.117.2.149 [DOI] [PMC free article] [PubMed] [Google Scholar]
- Ottschytsch N., Raes A., Van Hoorick D., Snyders D.J. 2002. Obligatory heterotetramerization of three previously uncharacterized Kv channel alpha-subunits identified in the human genome. Proc. Natl. Acad. Sci. USA. 99:7986–7991 10.1073/pnas.122617999 [DOI] [PMC free article] [PubMed] [Google Scholar]
- Panyi G., Deutsch C. 2007. Probing the cavity of the slow inactivated conformation of Shaker potassium channels. J. Gen. Physiol. 129:403–418 10.1085/jgp.200709758 [DOI] [PMC free article] [PubMed] [Google Scholar]
- Patil P.G., Brody D.L., Yue D.T. 1998. Preferential closed-state inactivation of neuronal calcium channels. Neuron. 20:1027–1038 10.1016/S0896-6273(00)80483-3 [DOI] [PubMed] [Google Scholar]
- Rettig J., Wunder F., Stocker M., Lichtinghagen R., Mastiaux F., Beckh S., Kues W., Pedarzani P., Schröter K.H., Ruppersberg J.P., Veh R. 1992. Characterization of a Shaw-related potassium channel family in rat brain. EMBO J. 11:2473–2486 [DOI] [PMC free article] [PubMed] [Google Scholar]
- Ritter D.M., Ho C., O’Leary M.E., Covarrubias M. 2012. Modulation of Kv3.4 channel N-type inactivation by protein kinase C shapes the action potential in dorsal root ganglion neurons. J. Physiol. 590:145–161 [DOI] [PMC free article] [PubMed] [Google Scholar]
- Roeper J., Lorra C., Pongs O. 1997. Frequency-dependent inactivation of mammalian A-type K+ channel Kv1.4 regulated by Ca2+/calmodulin-dependent protein kinase. J. Neurosci. 17:3379–3391 [DOI] [PMC free article] [PubMed] [Google Scholar]
- Roux M.J., Olcese R., Toro L., Bezanilla F., Stefani E. 1998. Fast inactivation in Shaker K+ channels. Properties of ionic and gating currents. J. Gen. Physiol. 111:625–638 10.1085/jgp.111.5.625 [DOI] [PMC free article] [PubMed] [Google Scholar]
- Santiago-Castillo J.A., Covarrubias M., Sánchez-Rodríguez J.E., Perez-Cornejo P., Arreola J. 2010. Simulating complex ion channel kinetics with IonChannelLab. Channels (Austin). 4:422–428 [DOI] [PMC free article] [PubMed] [Google Scholar]
- Shibata R., Nakahira K., Shibasaki K., Wakazono Y., Imoto K., Ikenaka K. 2000. A-type K+ current mediated by the Kv4 channel regulates the generation of action potential in developing cerebellar granule cells. J. Neurosci. 20:4145–4155 [DOI] [PMC free article] [PubMed] [Google Scholar]
- Solc C.K., Aldrich R.W. 1990. Gating of single non-Shaker A-type potassium channels in larval Drosophila neurons. J. Gen. Physiol. 96:135–165 10.1085/jgp.96.1.135 [DOI] [PMC free article] [PubMed] [Google Scholar]
- Sun W., Maffie J.K., Lin L., Petralia R.S., Rudy B., Hoffman D.A. 2011. DPP6 establishes the A-type K+ current gradient critical for the regulation of dendritic excitability in CA1 hippocampal neurons. Neuron. 71:1102–1115 10.1016/j.neuron.2011.08.008 [DOI] [PMC free article] [PubMed] [Google Scholar]
Associated Data
This section collects any data citations, data availability statements, or supplementary materials included in this article.