

Abstract
Cryo-electron tomography (cryo-ET) has enabled high resolution three-dimensional (3D) structural analysis of virus and host cell interactions and many cell signaling events; these studies, however, have largely been limited to very thin, peripheral regions of eukaryotic cells or to small prokaryotic cells. Recent efforts to make thin, vitreous sections using cryo-ultramicrotomy have been successful, however, this method is technically very challenging and with many artifacts. Here, we report a simple and robust method for creating in situ, frozen-hydrated cell lamellas using a focused ion beam at cryogenic temperature (cryo-FIB), allowing access to any interior cellular regions of interest. We demonstrate the utility of cryo-FIB with high resolution 3D cellular structures from both bacterial cells and large mammalian cells. The method will not only facilitate high-throughput 3D structural analysis of biological specimens, but is also broadly applicable to sample preparation of thin films and surface materials without the need for FIB “lift-out”.
Keywords: Cryo-ET, Cryo-FIB, Lamella, HeLa cell, Mitochondria, E. coli, Membranes, Nuclear pore
INTRODUCTION
Cryo-electron tomography (cryo-ET) has become an increasingly powerful method for three-dimensional (3D) structural determination of “one-of-a-kind” objects, such as whole cells, sub-cellular organelles, and macromolecular assemblies, that are preserved in the frozen-hydrated state (Grunewald et al., 2003a; Kurner et al., 2005; Murphy et al., 2006). It has provided a wealth of ultrastructural information of cellular compartments in bacterial cells and eukaryotic cells (Cyrklaff et al., 2007; Maurer et al., 2008; Medalia et al., 2002; Patla et al., 2010; Zhang et al., 2007) and potentially allows visualization of the molecular and supramolecular architecture of cells and tissues in a close-to-native state (Baumeister, 2005; Leis et al., 2009). However, due to the requirement for thin specimen preparation (< 0.5 – 1 μm) for transmission electron microscopy (TEM), cryo-ET structural analysis has been confined to isolated viruses (Barcena et al., 2009; de Marco et al., 2010; Grunewald et al., 2003b; Liu et al., 2008), small bacterial cells (Briegel et al., 2009; Carlson et al., 2010; Khursigara et al., 2008; Kurner et al., 2005; Zhang et al., 2007), and very thin peripheral regions (the leading edge) or appendages of eukaryotic cells (Carlson et al., 2010; Koning et al., 2008; Medalia et al., 2002), where useful information can be recovered from cellular tomograms. To image and access interior structures of larger cells, in particular, mammalian cells (>5 um), and high-pressure frozen tissues, a method to thin frozen-hydrated specimens to a thickness less than half a micron is necessary.
Ultramicrotomy is the conventional method to produce thin sections of chemically fixed and resin embedded biological specimens that are suitable for TEM imaging (McEwen and Marko, 2001; McIntosh, 2001). Extension of this methodology to frozen-hydrated specimens requires sectioning under cryogenic temperature. The vitreous sectioning techniques pioneered by Dubochet (Al-Amoudi et al., 2003; Al-Amoudi et al., 2004) and Marko (Hsieh et al., 2002) have been used to produce thin specimens of vitrified cells and tissues for visualization by cryo-EM (Al-Amoudi et al., 2005; Al-Amoudi et al., 2007; Pierson et al., 2010; Zhang et al., 2004; Zuber et al., 2005) and cryo-ET (Bouchet-Marquis et al., 2006; Gruska et al., 2008; Hsieh et al., 2006; Masich et al., 2006). But the method itself is technically challenging and demanding, and the yield of quality sections suitable for high-resolution tomography is very low. Many factors affect successful acquisition of a tilt series from a vitreous section. First, sections are generally not flat and do not adhere well to the supporting substrate, which can lead to specimen charging, smoothing, and movement during data acquisition. Second, sections contain many mechanical cutting artifacts including crevasses, knife marks, and serious compression in the cutting direction (Al-Amoudi et al., 2005; Zhang et al., 2004). While the crevasses and knife marks can be superficial and do not affect the interior of the acquired tomogram, a high degree of compression is a significant problem for accurate 3D structural analysis. Furthermore, it is challenging to include fiducials on vitreous sections and to align the tomographic tilt series through a few, poorly placed fiducials, or through “patch-tracking” type algorithms such as Alignator (Castano-Diez et al., 2010).
To eliminate cutting artifacts and directly avoid the problems of poor section adhesion that are associated with mechanical sectioning by cryo-ultramicrotomy, an alternative approach is to use a focused ion beam (FIB) to reduce the thickness of the frozen-hydrated specimen. In the field of materials science, FIB milling is routinely used to prepare samples for high resolution TEM imaging or to pattern specimens for a variety of applications (MoberlyChan et al., 2007). Only very recently has this method been explored for preparing thin, frozen-hydrated biological specimens for cryo-EM studies (Hayles et al., 2010; Marko et al., 2006; Marko et al., 2007; Rigort et al., 2012; Rigort et al., 2010) and for ion-abrasion scanning electron microscopy (SEM) of fixed and resin embedded biological samples (Bennett et al., 2009; Bushby et al., 2011; Heymann et al., 2006; Heymann et al., 2009).
In FIB milling, material is removed from the specimen surface through a sputtering process by an incident ion beam. One concern when applying FIB milling to vitreous biological specimens is the damage potentially caused by direct ion interaction. The predicted extent of the ion interaction layer in a vitreous biological specimen is 5 - 20 nm into the FIB milling surface (Matteson et al., 2002; Ziegler et al., 1985). This damage layer could be reduced to 3 nm or less if a low-energy (5keV, 20pA) ion beam is used for milling (Yabuuchi et al., 2004). Such a thin layer is almost negligible in a vitreous specimen with a post-FIB milling thickness of 100 - 300 nm, and is much thinner than the crevasses found in vitreous sections. Another concern is the possible heat transfer from the ion interaction layer to the interior of the specimen, which may cause sample devitrification.
The feasibility of a cryo-FIB approach was first demonstrated by Marko and colleagues with vitrified ice and E. coli cells (Marko et al., 2006; Marko et al., 2007) and subsequently confirmed by Plitzko and colleagues with bacterial M. smegmatis cells (Rigort et al., 2010) and recently with Dictyostelium discoideum (Rigort et al., 2012). In these studies, cryo-FIB processing and subsequent cryo-ET analysis were performed on small bacterial cells such as E. coli and M. smegmatis with a thickness of ~1 μm or relatively small eukaryotic cells. Cryo-FIB thinning of large mammalian cells or tissues, to generate samples suitable for cryo-ET analysis, remains a challenge (Rigort et al., 2010). In addition, the cryo-FIB approaches used in these studies mainly produced the cell substratum interface, while the majority of the cellular volumes were still not accessible. Here, we report technical advances in cryo-FIB processing of large mammalian cells, creating samples suitable for 3D structural analysis. We designed and fabricated an integrated cryo-specimen shuttle, which streamlines cryo-FIB thinning and subsequent 3D tomographic analysis of processed samples, and made the system very efficient and robust. We developed FIB approaches to create thin, freely-suspended, cell lamellas directly from cells cultured on EM grids, without requiring the technically challenging cryo-FIB “lift-out” procedure to transfer lamellas. We demonstrate our approaches with high quality 3D cellular structures obtained from native bacterial cells and large mammalian cells.
MATERIAL and METHODS
Preparation of bacterial and mammalian cells for cryo-FIB milling
Wild-type K12 E. coli cells were grown in LB broth (10 % tryptone, 5 % yeast extract and 10 % NaCl). Starter cultures were grown overnight at 34°C with 280 rpm shaking to an approximate optical density of 2.0 at 600 nm. Overnight cultures were diluted 1/40 into the same media and allowed to grow to an optical density of 0.5-0.6 at 600 nm. E. coli cells (3-5 μl) were withdrawn directly from cultures, mixed with 15 nm gold beads (2 μl), and placed on R2/2 Quantifoil grids (Micro Tools GmbH, Germany). The grids were manually blotted from the back side of the grid with a filter paper and plunge-frozen in liquid ethane using a home-made manual gravity plunger. The frozen grids were loaded onto the modified Polara cartridges (FEI, Hillsboro, OR) with cell side facing up and stored in liquid nitrogen for future use.
HeLa cells were cultured at 37 °C with 5 % CO2 in DMEM containing 4.5 g/L L-glutamine and glucose (Lonza Group Ltd, Basel, Switzerland), 10% heat inactivated fetal calf serum, 100 units/ml penicillin, and 100 μg/ml streptomycin (Invitrogen Corporation, Carlsbad, CA). Cultures at ~ 80 % confluence were routinely split 1:5 in 60 mm culture dishes. Cells were centrifuged at 1000x g and plated onto the gold R2/2 Quantifoil finder EM grids (Quantifoil Micro Tools GmbH, Jena, Germany) at a density of 2 × 10⁴ cells/ml (total 2 ml culture) in glass-bottom culture dishes (MatTek Corporation, Ashland, MA). The gold EM grids were disinfected under UV light for 2 hours and coated with 50 μg/ml fibronectin (Sigma) before use. DIC images of cultured HeLa cells were recorded with an Olympus IX71 microscope using a 20x objective lens before plunge-freezing. 15 nm gold beads (4μl) were applied to the cell culture on EM grids, blotted with filter papers, and plunged into liquid ethane for rapid vitrification using an FEI Vitrobot (FEI, Hillsboro, OR). The frozen grids were loaded onto the modified Polara cartridges with cell side facing up and stored in liquid nitrogen for future use.
Cryo-FIB milling
For FIB milling of the cells, an FEI Quanta 200 3D DualBeam FIB/SEM (FEI Corp., OR.) equipped with a Quorum PolarPrep 2000T Cryo Transfer Station and a Quorum PP7465 dual slusher system (Quorum Technologies Ltd, East Sussex, UK) was used. A FIB/SEM system allows for parallel monitoring of the milling process, as used in “slice and view” applications (Heymann et al., 2006). For the processing of frozen-hydrated biological specimens on the Quorum PolarPrep cold stage, a specialized shuttle was designed by the University of Pittsburgh School of Medicine Machine Shop as shown in Figure 1 A-C. The new shuttle design accepts Polara TEM specimen cartridges directly, thus eliminating specimen grid transfer between the FIB and the TEM. The design of the shuttle also ensures the same grid orientation for both FIB milling and tilting directions during acquisition of a tomographic tilt series in TEM. The specimen protection shutter is kept closed all the time, except during FIB-milling and SEM imaging, to minimize frost contamination. The shutter is at ~ 30° with respect to the base surface when it is open (Figure 1B), allowing for easy closing of the shutter within the FIB chamber, by using a transfer rod.
Figure 1.

Construction of a cryo-FIB shuttle. (A) An overview of the cryo-FIB shuttle (red circle) mounted on an FEI Quanta 200 3D DualBeam FIB/SEM system with a Quorum cryo-stage. The FIB and SEM columns are labeled. (B) The cryo-FIB shuttle loaded with a specimen cartridge, with the specimen protection shutter open (left) or closed (right). The shutter cover (arrow) is at 30° relative to the base, when open, for easy shutter closing. (C) Autocad drawing of the cryo-FIB shuttle as viewed from top (left) and side (right). Dimensions are marked in inches. The block face where the cartridge sits is at 45°. The specimen shutter (closed) is depicted in pink in the side view. (D) Schematics of parallel or antiparallel FIB milling for producing vitrified cell lamella without ”lift-out” (1st cut shown by gray arrow and 2nd cut by yellow (parallel) or orange (antiparallel) arrow).
A specimen cartridge containing a frozen EM grid was loaded onto the cryo-shuttle while immersed in liquid nitrogen. The shuttle was then loaded onto a transfer rod in the Quorum PP7465 dual slusher system under liquid nitrogen and transferred to the PolarPrep 2000T Cryo Transfer Station in a small vacuum cell. The sample was pre-pumped in the transfer station before insertion into the DualBeam FIB/SEM sample chamber and transfer onto the FIB/SEM cryo-stage, which was kept at −180° C.
The dual beam instrument contains both FIB and SEM columns that are focused at the same point on the sample, but at 52°. When the sample is tilted to 17° with respect to the axis of the SEM column, the actual milling angle (angle between the FIB beam and the sample surface) is 10°. It was important to keep this angle as small as possible because the smaller the milling angle, the larger the available viewing area in the TEM. An accelerating voltage of 30 keV and milling currents of 10-30 pA were used, depending on the specimen thickness. The milling time was approximately 30 seconds to 1 minute with 10 pA current for E. coli cells. HeLa cells required more time, about 20-40 minutes per mill with a 30 pA current. A 5 × 1 μm box was typically set for milling, which gave enough space for focusing and tracking the position during cryo-ET data collection. The milling process was monitored using SEM. The SEM images were obtained with an accelerating voltage of 5 keV and a current of 0.67 nA for E coli cells and 10 keV, 0.45 nA for HeLa cells.
Cryo-FIB processing of cell lamella
The cell lamella specimens were prepared by multiple-cross-sectioning the sites of interest with a 10° milling angle. Two precuts (5 × 1 μm) were first made to create a thick lamella (~1μm) initially; this involved making two mills on both sides of the target location (Figure 1D). A low ion beam current (<30 pA) was used to reduce the surface roughness and beam damage. The size, distance, milling angle and beam current of these two precuts were important for the quality of the final TEM lamella and the milling time. It is usually not a problem for small cells such as E. coli (it only takes a few minutes), while it can take as much as an hour to make these two cuts through large mammalian cells like HeLa cells even though a small milling area (~5 × 1 μm) was chosen for both cuts. Fine mills with a smaller milling box (5 × 0.2 μm) were then performed on the precut lamella, which was gradually thinned, evenly from both sides, to a final thickness of 100-200 nm. The total approximate time is less than 5 minutes for the E. coli cell and ~ 1 hour for the HeLa cell. The milling process was monitored using SEM with a secondary electron imaging mode at an accelerating voltage of 5 keV and a current of 0.67 nA. Finally, a 1 pA beam with a very small milling area (5 μm × 5 nm) was chosen to clean and polish the lamella surfaces.
Cryo-EM and cryo-ET of FIB-milled cells
After cryo-FIB processing, EM cartridges were stored in liquid nitrogen before they were examined by cryo-EM with an FEI Polara G2 (FEI Corp., OR.) transmission electron microscope equipped with a field emission gun and a Gatan 4K × 4K CCD camera (Gatan, Inc., Warrendale, PA). The FIB-milled regions were first located in low magnification (170x) EM projection images. Low dose (20 e−/Å2) projection images of the identified regions of interest were recorded on a CCD camera at a nominal magnification of 50,000x and under-focus values ranging 2-4 μm. For cryo-ET, a series of low dose projection images of the milled regions were recorded using FEI Inspect 3D software (FEI Corp., OR.), at tilt angles ranging from −70° to 70° depending on the topography of the sample, at a nominal magnification of 39,000x (pixel size=0.31nm), with an under-focus value of 10 μm. The electron dose per frame was kept under 2 e−/Å2, with a total dose of about 110 e−/ Å2. Tilt series were aligned using 15 nm gold fiducial beads, which were located outside of the cells and refined to standard deviations below 0.8. A weighted back-projection algorithm, as implemented in the IMOD reconstruction package (Kremer et al., 1996), was used to convert the information present in the series of tilted projection images into 3D density maps (tomograms). Diffusion and low pass Fourier filters were also applied in the final reconstruction. The 3D tomographic volumes were visualized and segmented in the environment of the program Amira (TGS Inc., San Diego, Calif.).
RESULTS
Design and construction of the cryo-FIB shuttle
Our goal is to obtain detailed, internal, 3D architectures of native cells, large mammalian cells in particular, at molecular resolution, using cryo-ET. Cryo-ET requires the specimen thickness to be less than 300 - 500 nm, since the apparent specimen thickness increases considerably during the acquisition of a tilted projection series. Previous efforts to use cryo-FIB to reduce bacterial cell thickness to a degree suitable for cryo-ET demonstrated its feasibility (Marko et al., 2007; Rigort et al., 2010). To advance this technology for investigating the internal structure of larger cells and to improve the cryo-FIB process for efficient and easy use, we designed and constructed a cryo-FIB shuttle (Figure 1 A-C) that directly accepts a cryo-EM Polara specimen cartridge for subsequent 3D structural analysis without the need for transferring the EM grid, eliminating potential specimen deformation and damage during transfer. This integrated feature greatly enhances the performance of cryo-ET, since successful cryo-ET data acquisition critically depends on the flatness and integrity of the grid. The cryo-shuttle design is shown in detail in Figure 1C and includes several important features: The specimen cartridge is recessed into the dove-tailed, copper FIB/SEM shuttle to ensure low specimen temperatures (−180° C to −190° C). It also includes a shutter mechanism that protects the grid from frost contamination during transfer into and out of a FIB/SEM system (Figure 1B, open or closed), and the specimen cartridge features cut-outs on both edges, allowing for shallow milling angles (10°) and a high angular tilting range (± 76°) for tomography. Furthermore, the cartridge faces can be reversed, by reinserting it with the back-side up at the dual slusher loading system, to allow milling from both surfaces of the sample in opposite directions. Thus, a thin sample slab can be created by two FIB millings, either parallel or antiparallel with cartridge face reversal, as illustrated in Figure 1D.
Taken together, our unique shuttle design has a number of advances: 1) It allows very shallow milling angles (10°) for generating large ”transparent“ sample areas for cryo-ET analysis (Rigort et al., 2010); 2) It has a built-in specimen shutter to protect the specimen and minimize ice contamination, resulting in near-frost-free transfer; 3) It includes an integrated specimen holder for stable specimen support, affording sequential FIB milling and cryo-ET to be performed on the same holder without sample transfer, thus, eliminating deformations of the fragile sample grid induced by gripping or clamping during grid transfer; 4) It maintains the grid in a fixed orientation in both cryo-FIB and cryo-ET; therefore, the FIB milling direction coincides with the tomographic specimen tilting direction, allowing for a perfect match of the FIB-thinned area with the tomography imaging area during specimen tilting. Such a design makes 3D structural analysis of cryo-FIB processed specimens much more proficient and reproducible; 5) Most importantly, it allows to produce the freely-suspended cell lamellas: by applying two consecutive mills, either parallel or anti-parallel, one can create a specimen slab on the EM grid that is ready for cryo-ET analysis without the need for cryo-FIB ”lift-out“. Such a FIB milling approach for specimen slabs is useful not only for biological specimens but also in the field of materials science, since it eliminates the difficulties associated with the FIB ”lift-out“ procedure and with specimen transfer across sample processing and imaging platforms.
Cryo-FIB milling and cryo-ET of bacterial cells
We first tested the performance of our cryo-FIB shuttle using plunge-frozen bacterial cells. Fresh E. coli cells growing in the log phase (OD at 600 nm was ~0.6) were directly applied to the EM grid and plunge-frozen. The cryo-EM grids with frozen-hydrated cells were loaded into specimen cartridges, which were then mounted into the cryo-shuttle (Figure 1B) and imaged in the FIB/SEM system (Figure 1A) using the scanning electron beam and a secondary electron detector. The SEM images recorded with a beam current of 0.45 nA showed discernable E. coli cells before and after cryo-FIB milling (Figure 2A-C), even without a platinum protection layer as previously required (Rigort et al., 2010). The good contrast made identification and milling of E. coli cells relatively easy and efficient, resulting in high yields (>80%). Depending on the density of E. coli cells on the EM grid, typically 10-20 areas of interest could be selected for milling within a single grid square. Using a 30 keV, focused, gallium ion beam at an incident angle of 10°, with a relatively low ion current of 10 pA (dose rate 0.67 ions/nm2/sec), a thin (~400 nm), slightly wedge-shaped area, exposing E. coli cellular volume (Figure 2D & E), was produced for cryo-ET in less than 1 minute of processing time. Under such low beam current conditions, the sample remained in its vitreous state after FIB milling, as indicated by the characteristic amorphous ice diffraction patterns recorded from the milled area (data not shown). The bacteria cell selected for subsequent tomographic analysis is indicated by white arrows in Figure 2 A-C.
Figure 2.

Cryo-FIB milling and cryo-ET of frozen-hydrated E. coli cells. (A & B) Cryo-scanning electron micrograph of vitrified E. coli cells on an EM grid before (A) and after (B & C) FIB milling. The insets in A & B are enlarged views of the boxed regions. The white arrows point to the cell of interest. (D & E) Low-dose cryo-EM projection images of the same boxed region in B, taken at medium (D) and high (E) magnifications. The same E. coli cell pointed out by white arrows in A-C is outlined in D. Orange dashed arrows indicate the milling direction, and the yellow dashed line indicates the direction of tilt axis in cryo-ET. Yellow arrows indicate contaminations. (F) A density profile of the bacterial envelope scanned from the outer membrane (rectangular box in E), reveals the inner (IM) and outer (OM) membranes of the E. coli cell separated by ~33 nm. The membrane bilayer leaflets are also discernible (red arrows). (G & H) Tomographic reconstruction of a FIB-milled E. coli cell. Three orthogonal slices (0.62 nm thick, labeled with XY, YZ, and XZ) from the tomogram at the cell pole are shown in G with small membrane invaginations (arrows) and putative ribosomes. Their orientations in the E. coli cell are indicated in the cartoon (top right). A cross-section along the white dashed line indicated in (G) is shown in (H). FIB milling surface is indicated by a blue dashed line. (I) Surface-rendered model of E. coli envelope displaying membrane invaginations into both the cytoplasmic and periplasmic spaces. Scale bars: 25 μm (A & B), 5 μm (C), 1 μm (D), 100 nm (E), and 200 nm (G & H).
The low dose projection image of the selected E. coli cell (Figure 2E) indicates a successful thinning process with little specimen damage or ice contamination. The cell membranes were well preserved with recognizable bilayer structures in the outer and inner membranes (Figure 2E & F). The reconstructed tomographic volume clearly shows that the top portion of a single bacterium was trimmed away, leaving about 360 nm thick bottom part of the cell, as measured in the 3D volume (Figure 2G & H). The tomogram exhibits no obvious structural damage or loss of detail on the top surface of the remaining bacterium (Figure 2G & H, movie S1). The fine detailed 3D structure suggests that the effect of implanted Ga+ ions on the frozen bacterial cell is negligible, confirming early simulation results (Yabuuchi et al., 2004). The tomogram also reveals many structural features, in particular, putative ribosome molecules (Figure 2G, black arrowhead in the XY plane) and membrane invaginations (Figure 2G (black arrows in XY and YZ planes) & I, movie S1 and Figure S1). The cytoplasmic membrane forms a continuous contour that curves into both periplasmic and cytoplasmic spaces (Figure 2G & I, black arrows, movie S1), representing a new structural feature that has not been reported previously (Dewey et al., 2010; Kishimoto-Okada et al., 2010; Marko et al., 2007). One noticeable artifact is the appearance of some dark material (Figure 2E & H, yellow arrows) that sometimes showed up on the milling surface of the FIB-processed samples, which likely resulted from deposition of sputtered material onto the freshly milled surface.
Cryo-FIB milling and cryo-ET of mammalian cells
Building upon our knowledge gained from the cryo-FIB milling of bacterial cells, we set out to process HeLa cells for cryo-ET analysis of their internal structures. There are several challenges in working with large and thick cells, as recognized previously (Rigort et al., 2010), and, so far, no 3D structures from mammalian cells have been obtained using cryo-FIB approaches (Marko et al., 2007; Rigort et al., 2012; Rigort et al., 2010). The main challenge is removal of sizeable volumes with a very low beam current (10 pA), required to best preserve the structure but at the expense of increased milling time, which can take hours. We tested different milling conditions and optimized milling strategies for HeLa cells to acquire thin cellular wedges suitable for cryo-ET analysis. Using a 30 keV, 30 pA ion beam current at a 10° milling angle, a 5 × 10 μm wedge-shaped intracellular area (~20 μm from the edge of the cell) with a ~5 × 3 μm transparent region (Figure 3A-C, white arrows) was made in ~30 minutes. A higher ion current, for instance 100 pA, reduced the milling time roughly by a factor of 3, but the cellular ultrastructure was partially compromised and milling artifacts were introduced (Figure 3B, orange arrows). A strategy to further reduce the milling time, while minimizing damage, is to initially apply a medium current (50 - 100 pA), to cut out a trench, and then polish the surface with a 10-30 pA ion beam, using the FIB cleaning cross-section mode. Using this approach, we were able to produce an electron-transparent region within 10 minutes, without noticeable structural defect (data not shown).
Figure 3.

Cryo-FIB milling and cryo-ET of frozen-hydrated HeLa cells. (A & B) Cryo-scanning electron micrograph of vitrified HeLa cells, on an EM grid, after FIB-milling. A close up of the milled area of interest shown in B. The white and orange arrows point to the milled areas. (C & D) Low-dose cryo-EM projection images of a FIB-milled HeLa cell taken at medium (C) and high (D) magnifications. The orange dashed arrows indicate the milling direction and the yellow arrows indicate contamination. (E) Tomographic reconstruction of a FIB-milled HeLa cell. Three orthogonal slices (0.62 nm thick) from the tomogram are shown with clear mitochondrial membranes and cristae (black arrows). The milled surface is indicated by a blue dashed line. Yellow arrows indicate contamination. (F) Surface-rendered model of mitochondrial membranes and vesicles in a HeLa cell. Protein complex particles (red circles in E) and actin filaments (white arrow in F) are clearly visible. Scale bars: 25 μm (A), 5 μm (B), 1 μm (C), and 200 nm (D & E).
The 3D tomograms recorded from the milled region show high quality cellular ultrastructure with great detail (Figure 3D-F, movie S2). The thickness of this region, measured from the tomogram, is ~200 nm. Several structural features are clearly visible, including well-resolved mitochondrial membranes and cristae (Figure 3E, Figure S2, black arrows), vesicles, actin filaments (Figure 3F, white arrow), and many individual protein complexes (Figure 3E, Figure S2, circles). The cross-section of the 3D volume (Figure 3E) clearly shows that a portion of the mitochondria were cut away without any noticeable damage on the top milling surface. Overall, there was little frost contamination (Figure 3B-D, Figure 2A-D), suggesting that samples were very well protected by the shutter mechanism in the cryo-FIB shuttle during transfer. Similar to the processing of E. coli cells, some milled material was deposited onto the freshly milled surface of the HeLa cell (yellow arrows).
An additional challenge associated with milling of large cells is that, unlike the bacterial cells, frozen-hydrated HeLa cells are difficult to distinguish from the ice background in SEM images, thus, identifying an area of interest is not easy. We used an approach developed in our previous correlative study (Jun et al., 2011) for selection of the target milling area. HeLa cells were cultured on EM finder grids and optical images of these were first recorded before plunge-freezing. Guided by the light microscopy images, suitable HeLa cells were then identified and target regions were selected for subsequent cryo-FIB processing. With this approach, the rate for successful milling was greatly increased. More sophisticated correlative approaches by combining fluorescent light microscopy and cryo-ET developed by us (Jun et al., 2011) and others (Briegel et al., 2010; Plitzko et al., 2009; Rigort et al., 2010; Sartori et al., 2007; Schwartz et al., 2007) will allow further targeted molecular imaging, such as HIV-1 particles inside a host cell.
Creating freely-suspended cell lamella
Creation of a free-standing cellular lamella using the FIB ”lift-out” procedure, as commonly practiced in the materials science field, has not been considered feasible due to difficulties associated with transferring the lamella at cryogenic temperatures (Rigort et al., 2010). The procedure involves fabrication of cryogenic micromanipulators for in situ “lift-out” and attachment of an extremely delicate vitreous lamella to a cryo-EM grid for further 3D structural analysis. To avoid the FIB ”lift-out” procedure, a sophisticated and complex cryo-nanobench system was recently introduced for making cell lamella from high-pressure frozen samples (Hayles et al., 2010). But, this system is very complicated, involving extended modification of several delicate devices and instruments and multiple sample transfers across different platforms. We have developed a simple, but robust, approach for making cell lamellas from plunge-frozen cells without “lift-out”. By taking advantage of the shallow milling angle, a slightly slanted cell lamella can be created through milling away material from both sides and leaving a freely suspended thin specimen slab available for imaging (Figure 1D). Multiple lamellas can be easily made within a single grid square.
We first demonstrated the feasibility of such an approach with successful fabrication of frozen-hydrated E. coli cell lamella using cryo-FIB. As illustrated in Figure 4 A-C, a thin E. coli lamella suspended by the surrounding un-milled material was created using two side-by-side parallel mills. We used low ion beam currents (1-10 pA) to minimize thermal stress, since the ion beam impacts both surfaces of the sample. The ice after milling remained in the amorphous state, as indicated by the diffuse rings and the spacing characteristic of the vitreous ice in the electron diffraction pattern (Figure 4B). Compared to vitreous sections of E. coli cells that we obtained previously by cryo-ultramicrotomy (Zhang et al., 2004), where mechanical deformation (compression and crevasses) was evident, FIB-processed cell lamellas show no signs of such artifacts (Figure 4C). Many structural features were clearly discernible within the E. coli lamella, The low dose cryo-EM image shows delineation of the two leaflets of the lipid bilayer of the inner (single arrow head, inset in Figure 4C) and the outer membranes (chevron arrow, inset in Figure 4C), as well as the peptidoglycan layer (double arrow head, inset in Figure 4C), comparable to the structures obtained from vitreous sections by cryo-ultramicrotomy (Zhang et al., 2004). By adjusting the distance between the opposing edges of two parallel milling boxes on the FIB/SEM screen, the target lamella thickness was set to 100 nm (Figure 4D), close to the measured average thickness from the tomogram (~90 nm, Figure 4F) recorded at the thinner region of the lamella (Figure 4E, boxes area). In contrast to the wedge-shaped cell substratum produced previously (Figure 3B), the lamella thickness is relative uniform throughout the milled area (Figure 4E & F). The 3D tomogram of the cell lamella shows detailed cellular ultrastructure of an E coli cell (Figure 4F).
Figure 4.

Cryo-FIB processing of cell lamella. (A) Cryo-scanning electron micrograph of vitrified E. coli cells on an EM grid after FIB-milling. The black arrow points to a lamella. (B & C) Electron diffraction pattern and low-dose cryo-EM projection image recorded from the FIB-milled E. coli cell lamella shown in A. The white arrows in (B) indicate the spacing for the vitreous ice at 0.36 nm (lower arrow) and 0.21 nm (upper arrow). Inset in (C) is the area indicated in the boxed region, but imaged at lower defocus value (~2 μm) to resolve the two leaflets of inner (single arrow head) and outer (chevron arrow) membranes. The peptidoglycan is marked with a double arrow head. The orange dashed arrows indicate the milling direction. (D) cryo-SEM image of the E. coli cell lamella used for 3D tomographic reconstruction in (E & F). (E & F) A low-dose projection cryoEM image (E, from boxed area in D) and three orthogonal slices, labeled XY, YZ and XZ, of the tomogram (F, from the boxed area in E). A cartoon (F, top right) illustrates the FIB-milled E.coli slab. The inset in F is an enlarged view of the boxed area. The milled surfaces are indicated by white dashed lines. Scale bars: 10 μm (A & D), 100 nm (B & F), and 2 μm (E).
Built upon our success with E. coli cell lamella, we applied the method to large HeLa cells cultured directly on EM grids, with a goal for future investigation of HIV-1 infection in these cells. We used a correlative approach to select the target area for FIB-processing. Figure 5A shows an optical image of HeLa cells taken before plunge-freezing and areas marked by the black arrow were targeted for milling, with an aim to prepare a cryoEM lamella through the cell nucleus. The corresponding cryo-SEM image from the same region before and after cryo-FIB processing is shown in Figures 5B and C, respectively. As seen in Figure 5D, the cryo-EM images recorded from the HeLa cell lamella reveal a nuclear envelope separating the cell nucleus (N) and cytoplasm (C), together with the endoplasmic reticulum (ER) and a cytoplasmic vesicle. A nuclear pore (~100 nm) embedded in the two-membrane nuclear envelope is clearly visible (Figure 5D inset). Thus, we demonstrate that near-native structures of intracellular regions, including cell nucleus, of mammalian cells can be successfully obtained in situ.
Figure 5.
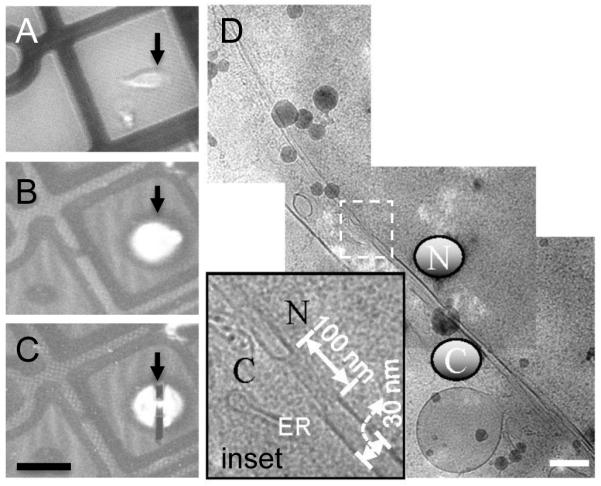
(A) An optical image showing the HeLa cells on the EM grid before plunger-freezing. (B & C) The corresponding cryo-SEM images of the same region before (B) and after (C) milling. The black arrow indicates the area of interest in each panel. (D) Cryo-EM projection images showing the nuclear envelope of the HeLa cell, recorded from the cryo-FIB prepared lamella marked by the black arrow in Figure 5C. The nucleus is indicated by an N and the cytoplasm by a C. The inset in Figure 5D is an enlarged view of the boxed region, revealing a nuclear pore. Scale bars: 50 μm (C) and 200 nm (D).
DISCUSSION
The main limitations in cryo-ET applications arise from difficulties in preparing suitably thin, vitreously frozen, biological specimens. Cryo-FIB milling is a viable tool for thinning vitreous samples that can then be used for 3D tomographic structural analysis. This approach is a significant improvement over vitreous sectioning, especially due to the absence of mechanical artifacts (Marko et al., 2007). We have designed and fabricated a cryo-shuttle which directly accepts cryo-EM specimen cartridges to streamline sample processing and 3D data collection and to allow very shallow FIB-milling angles and wider angular coverage for cryo-ET. We have successfully applied our cryo-shuttle to analyze both bacterial cells and large mammalian cells, with good results. The reconstructed 3D volumes of FIB-thinned cells offer fine structural details of cultured HeLa cells that are otherwise difficult to obtain (Eltsov et al., 2008). Our results show no mechanical stress and minimum specimen damage at the milling surfaces of processed cells. Most importantly, using two consecutive parallel FIB millings, the cellular features accessible for cryo-EM studies are no longer confined to the cell-substratum (bottom) interface, as in previous studies (Marko et al., 2007; Rigort et al., 2010). In contrast, our new approach allows access to anywhere in the sample through selective placement of the milling boxes. This approach can be applied widely, in the cellular biology and materials science fields, to make multiple lamellas without sophisticated FIB ”lift-out“ procedures, and, thus represents a significant improvement over the conventional FIB-sectioning technology.
A few issues remain with the developed technique: Sample surface contamination, due to deposition of removed material, is often observed, especially when working with thick and large cells. Low beam (1 pA) polishing of freshly milled surfaces may help to clean up the deposited material. An improvement of the cryo-box/anti-contaminator in FIB/SEM chamber could further reduce the contamination. We also observed non-uniform streak-like patterns on the milling surface (Figures 2E & 4E), as described previously (Rigort et al., 2010), which may result from uneven surface topology of the target region. Because the gold beads were removed during milling of cell lamella, acquiring a 3D data set by cryo-ET becomes challenging. Future inclusion of intracellular fiducial markers, such as expression of ferritin (Wang et al., 2011) or metallothionein (Mercogliano and DeRosier, 2007) molecules, will be helpful for carrying out 3D tomographic analyses. In addition, when working with HeLa cells, it was not easy to localize the cell and a particular cellular region of interest in SEM images. We correlated the SEM images with optical images of cells recorded before plunge-freezing to expedite searching and targeting appropriate milling sites. A more precise correlation can be achieved using a cryo-correlative light microscopy approach that we and others developed (Briegel et al., 2010; Jun et al., 2011; Plitzko et al., 2009; Sartori et al., 2007; Schwartz et al., 2007) for accurate localization of small targets. Our cryo-FIB shuttle design works seamlessly with the cryo-correlative light microscopy approach that we developed previously (Jun et al., 2011), since both use the same specimen cartridge for handling the cryo-EM grids, thus making the system even more reliable, precise, robust and convenient to use with a high success rate. We anticipate that combining our cryo-FIB milling approach with the correlative live-cell and cryo-ET method (Jun et al., 2011) will offer new ways to investigate virus and host cell interactions at many different stages of infection, particularly at the nuclear membrane when viral capsid interacts with nuclear pore complex components (Matreyek and Engelman, 2011; Schaller et al., 2011). The method will not only greatly facilitate 3D structural analysis of many dynamic cell signaling events and other cellular processes, but is also broadly applicable to generic sample preparation of thin films and surface materials without the need for challenging FIB ”lift-out“.
Supplementary Material
ACKNOWLEDGEMENTS
The authors thank Trevor Clark at the Materials Research Institute, Pennsylvania State University for help with cryo-FIB operation, Travis Wheeler and the machine shop at the Department of Cell Biology and Physiology for construction of the cryo-FIB shuttle, Drs. Sangmi Jun and Xin Meng for help with 3D tomographic reconstruction, and Dr. Teresa Brosenitsch for critical reading of the manuscript. This work was supported by the National Institutes of Health (RR024424 and GM085043).
Footnotes
Publisher's Disclaimer: This is a PDF file of an unedited manuscript that has been accepted for publication. As a service to our customers we are providing this early version of the manuscript. The manuscript will undergo copyediting, typesetting, and review of the resulting proof before it is published in its final citable form. Please note that during the production process errors may be discovered which could affect the content, and all legal disclaimers that apply to the journal pertain.
REFERENCES
- Al-Amoudi A, Studer D, Dubochet J. Cutting artefacts and cutting process in vitreous sections for cryo-electron microscopy. J Struct Biol. 2005;150:109–121. doi: 10.1016/j.jsb.2005.01.003. [DOI] [PubMed] [Google Scholar]
- Al-Amoudi A, Diez DC, Betts MJ, Frangakis AS. The molecular architecture of cadherins in native epidermal desmosomes. Nature. 2007;450:832–837. doi: 10.1038/nature05994. [DOI] [PubMed] [Google Scholar]
- Al-Amoudi A, Dubochet J, Gnaegi H, Luthi W, Studer D. An oscillating cryo-knife reduces cutting-induced deformation of vitreous ultrathin sections. J Microsc. 2003;212:26–33. doi: 10.1046/j.1365-2818.2003.01244.x. [DOI] [PubMed] [Google Scholar]
- Al-Amoudi A, Chang JJ, Leforestier A, McDowall A, Salamin LM, et al. Cryo-electron microscopy of vitreous sections. Embo J. 2004;23:3583–3588. doi: 10.1038/sj.emboj.7600366. [DOI] [PMC free article] [PubMed] [Google Scholar]
- Barcena M, Oostergetel GT, Bartelink W, Faas FG, Verkleij A, et al. Cryo-electron tomography of mouse hepatitis virus: Insights into the structure of the coronavirion. Proc Natl Acad Sci U S A. 2009;106:582–587. doi: 10.1073/pnas.0805270106. [DOI] [PMC free article] [PubMed] [Google Scholar]
- Baumeister W. From proteomic inventory to architecture. FEBS Lett. 2005;579:933–937. doi: 10.1016/j.febslet.2004.10.102. [DOI] [PubMed] [Google Scholar]
- Bennett AE, Narayan K, Shi D, Hartnell LM, Gousset K, et al. Ion-abrasion scanning electron microscopy reveals surface-connected tubular conduits in HIV-infected macrophages. PLoS Pathog. 2009;5:e1000591. doi: 10.1371/journal.ppat.1000591. [DOI] [PMC free article] [PubMed] [Google Scholar]
- Bouchet-Marquis C, Dubochet J, Fakan S. Cryoelectron microscopy of vitrified sections: a new challenge for the analysis of functional nuclear architecture. Histochem Cell Biol. 2006;125:43–51. doi: 10.1007/s00418-005-0093-x. [DOI] [PubMed] [Google Scholar]
- Briegel A, Chen S, Koster AJ, Plitzko JM, Schwartz CL, et al. Correlated light and electron cryo-microscopy. Methods in enzymology. 2010;481:317–341. doi: 10.1016/S0076-6879(10)81013-4. [DOI] [PubMed] [Google Scholar]
- Briegel A, Ortega DR, Tocheva EI, Wuichet K, Li Z, et al. Universal architecture of bacterial chemoreceptor arrays. Proc Natl Acad Sci U S A. 2009;106:17181–17186. doi: 10.1073/pnas.0905181106. [DOI] [PMC free article] [PubMed] [Google Scholar]
- Bushby AJ, P’Ng K,M, Young RD, Pinali C, Knupp C, et al. Imaging three-dimensional tissue architectures by focused ion beam scanning electron microscopy. Nat Protoc. 2011;6:845–858. doi: 10.1038/nprot.2011.332. [DOI] [PubMed] [Google Scholar]
- Carlson LA, de Marco A, Oberwinkler H, Habermann A, Briggs JA, et al. Cryo electron tomography of native HIV-1 budding sites. PLoS Pathog. 2010;6:e1001173. doi: 10.1371/journal.ppat.1001173. [DOI] [PMC free article] [PubMed] [Google Scholar]
- Castano-Diez D, Scheffer M, Al-Amoudi A, Frangakis AS. Alignator: a GPU powered software package for robust fiducial-less alignment of cryo tilt-series. Journal of structural biology. 2010;170:117–126. doi: 10.1016/j.jsb.2010.01.014. [DOI] [PubMed] [Google Scholar]
- Cyrklaff M, Linaroudis A, Boicu M, Chlanda P, Baumeister W, et al. Whole cell cryo-electron tomography reveals distinct disassembly intermediates of vaccinia virus. PLoS One. 2007;2:e420. doi: 10.1371/journal.pone.0000420. [DOI] [PMC free article] [PubMed] [Google Scholar]
- de Marco A, Muller B, Glass B, Riches JD, Krausslich HG, et al. Structural analysis of HIV-1 maturation using cryo-electron tomography. PLoS Pathog. 2010;6:e1001215. doi: 10.1371/journal.ppat.1001215. [DOI] [PMC free article] [PubMed] [Google Scholar]
- Dewey JS, Savva CG, White RL, Vitha S, Holzenburg A, et al. Micron-scale holes terminate the phage infection cycle. Proc Natl Acad Sci U S A. 2010;107:2219–2223. doi: 10.1073/pnas.0914030107. [DOI] [PMC free article] [PubMed] [Google Scholar]
- Eltsov M, Maclellan KM, Maeshima K, Frangakis AS, Dubochet J. Analysis of cryo-electron microscopy images does not support the existence of 30-nm chromatin fibers in mitotic chromosomes in situ. Proceedings of the National Academy of Sciences of the United States of America. 2008;105:19732–19737. doi: 10.1073/pnas.0810057105. [DOI] [PMC free article] [PubMed] [Google Scholar]
- Grunewald K, Medalia O, Gross A, Steven AC, Baumeister W. Prospects of electron cryotomography to visualize macromolecular complexes inside cellular compartments: implications of crowding. Biophys Chem. 2003a;100:577–591. doi: 10.1016/s0301-4622(02)00307-1. [DOI] [PubMed] [Google Scholar]
- Grunewald K, Desai P, Winkler DC, Heymann JB, Belnap DM, et al. Three-dimensional structure of herpes simplex virus from cryo-electron tomography. Science. 2003b;302:1396–1398. doi: 10.1126/science.1090284. [DOI] [PubMed] [Google Scholar]
- Gruska M, Medalia O, Baumeister W, Leis A. Electron tomography of vitreous sections from cultured mammalian cells. J Struct Biol. 2008;161:384–392. doi: 10.1016/j.jsb.2007.10.008. [DOI] [PubMed] [Google Scholar]
- Hayles MF, de Winter DA, Schneijdenberg CT, Meeldijk JD, Luecken U, et al. The making of frozen-hydrated, vitreous lamellas from cells for cryo-electron microscopy. J Struct Biol. 2010;172:180–190. doi: 10.1016/j.jsb.2010.07.004. [DOI] [PubMed] [Google Scholar]
- Heymann JA, Hayles M, Gestmann I, Giannuzzi LA, Lich B, et al. Site-specific 3D imaging of cells and tissues with a dual beam microscope. J Struct Biol. 2006;155:63–73. doi: 10.1016/j.jsb.2006.03.006. [DOI] [PMC free article] [PubMed] [Google Scholar]
- Heymann JA, Shi D, Kim S, Bliss D, Milne JL, et al. 3D imaging of mammalian cells with ion-abrasion scanning electron microscopy. J Struct Biol. 2009;166:1–7. doi: 10.1016/j.jsb.2008.11.005. [DOI] [PMC free article] [PubMed] [Google Scholar]
- Hsieh CE, Marko M, Frank J, Mannella CA. Electron tomographic analysis of frozen-hydrated tissue sections. J Struct Biol. 2002;138:63–73. doi: 10.1016/s1047-8477(02)00034-5. [DOI] [PubMed] [Google Scholar]
- Hsieh CE, Leith A, Mannella CA, Frank J, Marko M. Towards high-resolution three-dimensional imaging of native mammalian tissue: electron tomography of frozen-hydrated rat liver sections. J Struct Biol. 2006;153:1–13. doi: 10.1016/j.jsb.2005.10.004. [DOI] [PubMed] [Google Scholar]
- Jun S, Ke D, Debiec K, Zhao G, Meng X, et al. Direct visualization of HIV-1 with correlative live-cell microscopy and cryo-electron tomography. Structure. 2011;19:1573–1581. doi: 10.1016/j.str.2011.09.006. [DOI] [PMC free article] [PubMed] [Google Scholar]
- Khursigara CM, Wu X, Zhang P, Lefman J, Subramaniam S. Role of HAMP domains in chemotaxis signaling by bacterial chemoreceptors. Proc Natl Acad Sci U S A. 2008;105:16555–16560. doi: 10.1073/pnas.0806401105. [DOI] [PMC free article] [PubMed] [Google Scholar]
- Kishimoto-Okada A, Murakami S, Ito Y, Horii N, Furukawa H, et al. Comparison of the envelope architecture of E. coli using two methods: CEMOVIS and cryo-electron tomography. J Electron Microsc (Tokyo) 2010;59:419–426. doi: 10.1093/jmicro/dfq056. [DOI] [PubMed] [Google Scholar]
- Koning RI, Zovko S, Barcena M, Oostergetel GT, Koerten HK, et al. Cryo electron tomography of vitrified fibroblasts: microtubule plus ends in situ. Journal of structural biology. 2008;161:459–468. doi: 10.1016/j.jsb.2007.08.011. [DOI] [PubMed] [Google Scholar]
- Kremer JR, Mastronarde DN, McIntosh JR. Computer visualization of three-dimensional image data using IMOD. J Struct Biol. 1996;116:71–76. doi: 10.1006/jsbi.1996.0013. [DOI] [PubMed] [Google Scholar]
- Kurner J, Frangakis AS, Baumeister W. Cryo-electron tomography reveals the cytoskeletal structure of Spiroplasma melliferum. Science. 2005;307:436–438. doi: 10.1126/science.1104031. [DOI] [PubMed] [Google Scholar]
- Leis A, Rockel B, Andrees L, Baumeister W. Visualizing cells at the nanoscale. Trends Biochem Sci. 2009;34:60–70. doi: 10.1016/j.tibs.2008.10.011. [DOI] [PubMed] [Google Scholar]
- Liu J, Bartesaghi A, Borgnia MJ, Sapiro G, Subramaniam S. Molecular architecture of native HIV-1 gp120 trimers. Nature. 2008;455:109–113. doi: 10.1038/nature07159. [DOI] [PMC free article] [PubMed] [Google Scholar]
- Marko M, Hsieh C, Moberlychan W, Mannella CA, Frank J. Focused ion beam milling of vitreous water: prospects for an alternative to cryo-ultramicrotomy of frozen-hydrated biological samples. J Microsc. 2006;222:42–47. doi: 10.1111/j.1365-2818.2006.01567.x. [DOI] [PubMed] [Google Scholar]
- Marko M, Hsieh C, Schalek R, Frank J, Mannella C. Focused-ion-beam thinning of frozen-hydrated biological specimens for cryo-electron microscopy. Nat Methods. 2007;4:215–217. doi: 10.1038/nmeth1014. [DOI] [PubMed] [Google Scholar]
- Masich S, Ostberg T, Norlen L, Shupliakov O, Daneholt B. A procedure to deposit fiducial markers on vitreous cryo-sections for cellular tomography. J Struct Biol. 2006;156:461–468. doi: 10.1016/j.jsb.2006.05.010. [DOI] [PubMed] [Google Scholar]
- Matreyek KA, Engelman A. The requirement for nucleoporin NUP153 during human immunodeficiency virus type 1 infection is determined by the viral capsid. Journal of virology. 2011;85:7818–7827. doi: 10.1128/JVI.00325-11. [DOI] [PMC free article] [PubMed] [Google Scholar]
- Matteson TL, Schwartz SW, Houge EC, Kempshall BW, Giannuzzi LA. Electron backscattering diffraction investigation of focused ion beam surfaces. J. Electron. Mat. 2002;31:33–39. [Google Scholar]
- Maurer UE, Sodeik B, Grunewald K. Native 3D intermediates of membrane fusion in herpes simplex virus 1 entry. Proc Natl Acad Sci U S A. 2008;105:10559–10564. doi: 10.1073/pnas.0801674105. [DOI] [PMC free article] [PubMed] [Google Scholar]
- McEwen BF, Marko M. The emergence of electron tomography as an important tool for investigating cellular ultrastructure. J Histochem Cytochem. 2001;49:553–564. doi: 10.1177/002215540104900502. [DOI] [PubMed] [Google Scholar]
- McIntosh JR. Electron microscopy of cells: a new beginning for a new century. J Cell Biol. 2001;153:F25–32. doi: 10.1083/jcb.153.6.f25. [DOI] [PMC free article] [PubMed] [Google Scholar]
- Medalia O, Weber I, Frangakis AS, Nicastro D, Gerisch G, et al. Macromolecular architecture in eukaryotic cells visualized by cryoelectron tomography. Science. 2002;298:1209–1213. doi: 10.1126/science.1076184. [DOI] [PubMed] [Google Scholar]
- Mercogliano CP, DeRosier DJ. Concatenated metallothionein as a clonable gold label for electron microscopy. J Struct Biol. 2007;160:70–82. doi: 10.1016/j.jsb.2007.06.010. [DOI] [PMC free article] [PubMed] [Google Scholar]
- MoberlyChan WJ, Adams DP, Aziz MJ, Hobler G, Schenkel T. Fundamentals of focused ion beam nanostructural processing: Below, at, and above the surface. Mrs Bulletin. 2007;32:424–432. [Google Scholar]
- Murphy GE, Leadbetter JR, Jensen GJ. In situ structure of the complete Treponema primitia flagellar motor. Nature. 2006;442:1062–1064. doi: 10.1038/nature05015. [DOI] [PubMed] [Google Scholar]
- Patla I, Volberg T, Elad N, Hirschfeld-Warneken V, Grashoff C, et al. Dissecting the molecular architecture of integrin adhesion sites by cryo-electron tomography. Nat Cell Biol. 2010;12:909–915. doi: 10.1038/ncb2095. [DOI] [PubMed] [Google Scholar]
- Pierson J, Fernandez JJ, Bos E, Amini S, Gnaegi H, et al. Improving the technique of vitreous cryo-sectioning for cryo-electron tomography: electrostatic charging for section attachment and implementation of an anti-contamination glove box. J Struct Biol. 2010;169:219–225. doi: 10.1016/j.jsb.2009.10.001. [DOI] [PubMed] [Google Scholar]
- Plitzko JM, Rigort A, Leis A. Correlative cryo-light microscopy and cryo-electron tomography: from cellular territories to molecular landscapes. Curr Opin Biotechnol. 2009;20:83–89. doi: 10.1016/j.copbio.2009.03.008. [DOI] [PubMed] [Google Scholar]
- Rigort A, Bauerlein FJ, Villa E, Eibauer M, Laugks T, et al. Focused ion beam micromachining of eukaryotic cells for cryoelectron tomography. Proceedings of the National Academy of Sciences of the United States of America. 2012;109:4449–4454. doi: 10.1073/pnas.1201333109. [DOI] [PMC free article] [PubMed] [Google Scholar]
- Rigort A, Bauerlein FJ, Leis A, Gruska M, Hoffmann C, et al. Micromachining tools and correlative approaches for cellular cryo-electron tomography. J Struct Biol. 2010;172:169–179. doi: 10.1016/j.jsb.2010.02.011. [DOI] [PubMed] [Google Scholar]
- Sartori A, Gatz R, Beck F, Rigort A, Baumeister W, et al. Correlative microscopy: bridging the gap between fluorescence light microscopy and cryo-electron tomography. J Struct Biol. 2007;160:135–145. doi: 10.1016/j.jsb.2007.07.011. [DOI] [PubMed] [Google Scholar]
- Schaller T, Ocwieja KE, Rasaiyaah J, Price AJ, Brady TL, et al. HIV-1 capsid-cyclophilin interactions determine nuclear import pathway, integration targeting and replication efficiency. PLoS pathogens. 2011;7:e1002439. doi: 10.1371/journal.ppat.1002439. [DOI] [PMC free article] [PubMed] [Google Scholar]
- Schwartz CL, Sarbash VI, Ataullakhanov FI, McIntosh JR, Nicastro D. Cryo-fluorescence microscopy facilitates correlations between light and cryo-electron microscopy and reduces the rate of photobleaching. Journal of microscopy. 2007;227:98–109. doi: 10.1111/j.1365-2818.2007.01794.x. [DOI] [PubMed] [Google Scholar]
- Wang Q, Mercogliano CP, Lowe J. A ferritin-based label for cellular electron cryotomography. Structure. 2011;19:147–154. doi: 10.1016/j.str.2010.12.002. [DOI] [PubMed] [Google Scholar]
- Yabuuchi Y, Tametou S, Okano T, Inazato S, Sadayama S, et al. A study of the damage on FIB-prepared TEM samples of AlxGa1-xAs. J Electron Microsc (Tokyo) 2004;53:471–477. doi: 10.1093/jmicro/dfh062. [DOI] [PubMed] [Google Scholar]
- Zhang P, Khursigara CM, Hartnell LM, Subramaniam S. Direct visualization of Escherichia coli chemotaxis receptor arrays using cryo-electron microscopy. Proc Natl Acad Sci U S A. 2007;104:3777–3781. doi: 10.1073/pnas.0610106104. [DOI] [PMC free article] [PubMed] [Google Scholar]
- Zhang P, Bos E, Heymann J, Gnaegi H, Kessel M, et al. Direct visualization of receptor arrays in frozen-hydrated sections and plunge-frozen specimens of E. coli engineered to overproduce the chemotaxis receptor Tsr. J Microsc. 2004;216:76–83. doi: 10.1111/j.0022-2720.2004.01395.x. [DOI] [PubMed] [Google Scholar]
- Ziegler JF, Biersack JP, Littmark U. The Stopping and Range of Ions in Solids. Pergamon Press; New York: 1985. [Google Scholar]
- Zuber B, Nikonenko I, Klauser P, Muller D, Dubochet J. The mammalian central nervous synaptic cleft contains a high density of periodically organized complexes. Proc Natl Acad Sci U S A. 2005;102:19192–19197. doi: 10.1073/pnas.0509527102. [DOI] [PMC free article] [PubMed] [Google Scholar]
Associated Data
This section collects any data citations, data availability statements, or supplementary materials included in this article.