

Abstract
Furosemide is a class IV biopharmaceutical classification system drug having poor water solubility and low bioavailability due to the hepatic first-pass metabolism and has a short half-life of 2 h. To overcome the above drawback, this study was carried to prepare and evaluate the pellets containing furosemide solid dispersion (SD) for oral administration prepared by extrusion/spheronization. SD of furosemide was prepared with Eudragit L-100 at a drug-to-polymer ratio of 1:2 by employing a solvent evaporation method and characterized. Further, microcrystalline cellulose pellets containing SD were consequently prepared using a lab scale extrusion/ spheronizer and evaluated for in vitro drug release studies. The influence of process parameters used during extrusion/spheronization on the pellet properties was also studied using 2-factor, 3-level central composite design in order to improve the product quality. Additionally, the desirability function approach was applied to acquire the preeminent compromise between the multiple responses. Pellets containing solid dispersion (PSD) were prepared using optimal parameter settings demonstrated 88.52 ± 0.69% of the drug was released in a sustained release manner till 12 h. In vitro drug release data were fitted to various release kinetics models to study the mechanism of drug release. Drug release from the PSD was found to follow zero-order and Higuchi's model. Both studied parameters had great influence on the responses. PSD showed augmentation in the drug release profile till 12 h. The final optimized formulation was obtained by encapsulating best SD formulation within the pellet core to release the drug in the most soluble form in stomach and a sustained fashion in intestine.
Keywords: Central composite design, desirability function, furosemide, solid dispersion, sustained release pellets
INTRODUCTION
Furosemide is a potent high ceiling (loop) diuretic mainly used in the treatment of hypertension.[1] The drug has been classified as a class IV drug as per the biopharmaceutical classification system (BCS) as a result of its low solubility (0.006 mg/ml) and poor oral bioavailability (~55%).[2,3] Today, 35–40% of all new chemical entities suffer from poor aqueous solubility.[4] The enhancement of the dissolution rate of poorly water-soluble drugs after oral administration is one of the most challenging aspects of modern pharmaceutics.[5–7]
Solid dispersion (SD) is an extensively employed method to increase the solubility and dissolution behaviour of hydrophobic drugs.[8,9] SD is a system in which drug particles are distributed throughout a solid matrix.[10] The particle size of drugs in this system may be reduced markedly, and the physical state of the drug may be transformed from the crystalline to partially amorphous in this system. Therefore, this system provides the possibility of enhancing the solubility or dissolution rate remarkably.[11]
Pellets are defined as spherical, free-flowing granules with a narrow size distribution typically varying between 500 and 1500 μm for pharmaceutical applications.[12] Pellets are the multiple-unit dosage form and believed to have many therapeutic advantages, such as effectiveness and safety, over the single-unit dosage forms. The uniform dispersion of a drug into small dosage units reduces the risk of high local drug concentration and their potentially irritating effect on gastric mucosa. Furthermore, drug absorption is maximised and the peak plasma fluctuations are reduced.[13]
Response surface methodology (RSM) is a rapid technique used to empirically derive a functional relationship between an experimental response and a set of input variables in the development and optimization of drug delivery systems.[14]
An experimental design technique such as Taguchi L4 Orthogonal Array (OA) design was employed to demarcate the effect of each of these parameters and to optimize these variables on the response variables. Taguchi experimental designs, based on the orthogonal arrays, are usually labeled L4, to indicate an array with four runs.
In this work, central composite design (CCD) was employed to simultaneously study the effect of the two process parameters involved in the preparation of pellets by extrusion/spheronization against three response variables. CCD is a response surface design which provides information on direct effects, pair-wise interaction effects, curvilinear variable effects, and widely used for formulation and process optimization in the field of pharmaceutics.[15,16] Water-insoluble polymer Eudragit L-100 was used to prepare the SD. Eudragit L-100 is an anionic co-polymer of methacrylic acid and methyl methacrylate. Till now, the use of Eudragit L-100 to prepare the SD and employed inside the pellet core has not been reported for sustaining the drug release. Unfortunately, the water-insoluble drugs are poor candidates for the sustained release (SR) drug delivery system, therefore making a SD of a poorly soluble drug and incorporate it into the pellet core can be a novel approach for sustaining the drug release throughout the gastro intestinal track. By adopting the principle of solubility enhancement and sustaining the release, pellets containing solid dispersion (PSD) of furosemide are obtained in order to improve the solubility and bioavailability of the drug as well as prolong its biological half-life.
The objectives of this study are: (a) to investigate if it is possible to enhance the dissolution of furosemide by using SDs, which are produced by a solvent evaporation method, as the raw material to prepare pellets in a extrusion/ spheronization; (b) to evaluate the potential of Eudragit L-100 as carrier for SD was also evaluated for increasing the solubility of the water-insoluble drug; and (c) to optimize the process parameters which powerfully affect the characteristics of the resultant PSD by CCD.
MATERIALS AND METHODS
Materials
Furosemide was received as a gift sample from Micro labs, Bangalore, India. Eudragit L-100 was received as a gift sample from Evonik, Degussa India Ltd. Microcrystalline cellulose (MCC) was acquired from S.D Fine-Chem Limited, Mumbai. PVP K-30 was supplied by Himedia Laboratories Pvt. Ltd Mumbai. All excipients used to prepare pellets were of standard pharmaceutical grade and all chemicals used were of analytical grade.
Methods
Screening for influential factors
During initial studies, it is important to investigate the possible process variables of the system under study to know their influence on the quality of the product. A process variable identified as a factor increases the chance of success, while a process variable that is not a factor has no consequences. The screening study was performed using a Taguchi L4 OA design for finding the relevant main parameters of the extrusion/spheronization process. Two process parameters were investigated through a design matrix of four experiments. The studied parameters were as follows: (1) kneading time, (2) extruder speed, (3) spheronizer speed, and (4) spheronizer time. Based on preliminary experiments, the extreme levels of each factor were set. Symbols, coded and actual level of variables of the screening study are shown in Table 1. The significant parameters of the extrusion/spheronization were determined using the bar plot which illustrates the influence of every process parameter on the response variables.
Table 1.
Experimental conditions for the screening study

Experimental design
Central composite design
CCD has been widely used for fitting a second-order model and to require a minimum number of experiments to be performed. The independent process variables including kneading time (X1) (processing time after the liquid addition) and speed of the spheronizer (X2) were defined as factors, percentage yield (Y1), pellets size (Y2), and drug released from pellets (Y3) were used separately as the responses in the CCD.
The data obtained for the three responses in each trial were fitted to the classical second-order polynomial model.
The mathematical models were expressed as follows.
Second-order polynomial model:
y = b0 + b1x1 + b2x2 + b3x12 + b4x22 + b5x1x2
where x1, x2 represents the main effect, x12, x22 the quadratic effect and x1x2 is the interaction effect, y is the measured response, b0 is an intercept, b1–b5 are the regression coefficients. Data were analyzed by nonlinear estimation using Design Expert® software 6.0. Against the two factors graphs of surface responses were plotted with the response variation.
The effects were evaluated statistically at 0.1 level (α = 1.141). The process variables with their relative experimental values and pellets were produced according to different levels of the factors is reported in Table 2. Each experiment was executed in triplicate.
Table 2.
Factors and levels of the circumscribed central composite design

Desirability function
All of the three responses in the study should be evaluated in the optimization of furosemide SD pellets. However, it is almost impossible to optimize all the objectives simultaneously because they do not coincide with each other and conflict may occur between them. The optimum condition reached in one response may have an opposite influence on another response. For the purpose of finding the best compromising formulation for all responses, the multicriteria problem can be treated as a single criterion problem by using the desirability function approach. The desirability function for the response to be minimized can be defined as:

where Ymin represents the lowest possible value; Ymax represents the highest possible value; and Yi indicates the experimental value. In addition, if Yi is equal to or below Ymin, then di =1. If Yi is higher than or equal to Ymax, then di = 0. In contrast, for a response to be maximized, the desirability function is defined as:

where Ymin, Ymax, and Yi represent the values as the same as those expressed in Eq. (1). If Yi is equal to or below Ymin, then di = 0. If Yi is higher than or equal to Ymax, then di = 1. Among these objectives, Y2 was minimized, while Y1 and Y3 were maximized.
According to the observed response values, the limits were selected for
Y1: Ymax = 85.46 (highest percentage yield) and Ymin = 62.53 (lowest percentage yield)
Y2: Ymax = 905 (largest particle size) and Ymin = 741 (lowest particle size)
Y3: Ymax = 92.24 (highest dissolution rate) and Ymin = 75.54 (lowest dissolution rate)
To obtain the condition on the design variables, a three-dimensional graph of the response against the two factors (X1 and X2) was plotted.
Preparation of solid dispersions of furosemide
SDs of furosemide were prepared employing different drug-to-polymer ratios (1:1, 1:2 and 1:3) by the solvent evaporation method. The polymer mixture consisting of Eudragit L-100 was actually weighed and dissolved in methanol to get a clear solution. Precisely weighed amount of the drug was dissolved in the polymer solution and stirred at room temperature for 10 min and the solvent was then evaporated under room temperature for 24 h. The resulting SDs were collected after milling for 1 min and passed through sieve # 80 and stored in an amber colour glass bottles.
Drug content of solid dispersions
The drug content in SDs of all the formulations was determined in triplicate. SD equivalent to one dose (40 mg) of drug was taken and dissolved in 100 ml of 0.1 M NaOH. The samples were filtered through Whatman filter paper 0.45 μm. The filtrate was diluted suitably and analyzed using a UV spectrophotometer at 271 nm against a blank after appropriate dilutions (Model UV-1700, UV-Visible spectrophotometer, Shimadzu, Kyoto, Japan). The polymers did not interfere with the drug extraction and determination at the specified wavelength.
In vitro dissolution studies of solid dispersion
Drug release studies were performed in triplicate on a dissolution test apparatus (ELECTROLAB TDT-06PL, Mumbai, India) at 37.0 ± 0.5°C employing USP apparatus Type II at 100 rpm for 2 h. The dissolution medium consisted of 900 ml of pH (1.2) simulated acidic fluid (SAF). Dissolution studies were performed on a pure drug (40 mg), the best SD formulation containing an equivalent amount of the drug and commercial product. Aliquots of (5 ml) samples withdrawn periodically were analyzed spectrophotometrically at 271 nm, and were replaced with an equal volume of the fresh dissolution medium. An equal volume of dissolution medium kept at the same temperature was added to maintain the sink conditions. The polymer did not interfere with the UV analysis of the drug.
Based on the drug content and drug release studies the best SD formulation prepared with a 1:2 drug-to-polymer ratio was subjected for preparation of pellets.
Preparation of pellets containing solid dispersion
PSD were prepared by a laboratory scale extrusion/ spheronization process by following steps.
Preparation of wet mass
PSD were prepared in the laboratory scale extrusion/ spheronization technique using an Umang Pharmascitech radial screen extruder/spheronizer. The wet mass was produced by dry mixing the powders for 10 min in a blender mixer (Hobart, London, UK). A powder mixture containing 40% furosemide SD and 60% MCC were used as a raw material. Purified water was used as the binder liquid containing PVP K-30 (1.5%). A precisely determined amount of binder liquid (40 ml/100 g) was then added to the powder mixture and the mass was kneaded for a preset period of time after the liquid addition. The pellets were prepared under standardized operating conditions.
Extrusion
The wet powder mass was immediately extruded at 80 rpm through a radial screen extruder (Model S 250, Umang Pharmascitech, Mumbai, India), supplied with a 1 mm aperture screen.
Spheronization
A radial plate spheronizer with a plate diameter of 45.0 cm was used (model S250, Umang Pharmascitech, Mumbai, India). The friction plate speed in the spheronizer was varied between 800–1000 rpm, respectively. The extrudate was spheronized for 10 min. The wet pellets were dried in a hot air oven at 40°C for 24 h and then stored in sealed bags.
Characterization of pellets
The pellets of the different formulations were characterized for the following attributes.
Flow properties
Particle size distribution
The pellet size and pellet size distribution were estimated by sieve analysis (Test sieve shaker, Endicott Ltd, London, UK). Each batch of the pellets was sieved before the subsequent test in order to remove the lumps larger than 1000 μm. About 20 g of the sample was sieved employing a set of standard trembling at an amplitude of 2 mm for 5 min. All results presented were the mean of three determinations. Pellets ranging between 700 and 800 μm in size were selected for the In-vitro dissolution test so that the effect of the particle size on the dissolution rate is excluded.
Angle of repose
The static angle of repose was measured according to the standard reported method. The angle of repose (θ°) was calculated from the standard trigonometric relationship.[17]
Volume, density, and compressibility
50 gm of the sample was put into a 250 ml graduated cylinder of a volume and density apparatus (Electrolab TAB density Tester, USP, Model ETD 1020, Mumbai). Bulk density, tapped density, and Carr's percent compressibility were calculated.[18,19]
Friability
The friability of the PSD was assayed with a Roche friabilator for 10 min at 25 rpm. For each assay, 10 g of pellets was mixed with 20 g of glass beads.[20]
Assay of the drug content
The samples were assayed by a UV spectrophotometric method according to the Indian Pharmacopoeial 2007 norms. PSD equivalent to one dose (40 mg) of the drug were weighed and grounded to fine powder and dissolved in a 0.1 M NaOH. After 2 h of stirring with a magnetic stirrer, the sample was filtered through a 0.45 μm membrane filter and the samples were analyzed by spectrophotometrically at a wavelength of 271 nm.
In-vitro dissolution of PSD
An In-vitro drug release study was carried out using an Electrolab TDT-06PL Dissolution tester USP apparatus Type I (rotating basket) in 900 ml of the dissolution medium. Initially for 2 h, the study was carried out in SAF, pH (1.2). Further, the study was continued up to 10 h in simulated intestinal fluid (SIF) pH (6.8). Other parameters which include a paddle speed of 100 rpm and a temperature of 37 ± 0.5°C were kept constant. The dissolution process was monitored for 12 h and samples were taken at specific time interval and replaced with an equal volume of the same fresh medium. An aliquot of 5 ml was filtered through Whatman filter paper 0.45 μm. The sample solutions were diluted and the drug released from pellets was determined spectrophotometrically at a wavelength of 271 nm (Model UV-1700, UV-Visible spectrophotometer, Shimadzu, Kyoto, Japan). All experiments were performed in triplicate.
Further, the overlay plot was used to locate the optimum formulation of the PSD. Besides, the optimized formulation was subjected for differential scanning calorimetry (DSC), X-ray diffraction pattern (XRD), and scanning electron microscopy ( SEM) analysis. All experiments were performed in triplicate.
Differential scanning calorimetry
DSC thermograms of pure drug, Eudragit L-100, and optimized PSD formulation were carried out on the samples using a Shimadzu DSC-60 Differential scanning calorimeter between 40 and 300°C at a heating rate of 5°C/min under constant purging of dry nitrogen at 30 mL/ min.
X-ray diffraction pattern
XRD studies of the pure drug, Eudragit L-100, and optimized PSD formulation were carried out using a X-ray diffractometer (Brucker AXS, D8 advanced, Germany) with monochromatic Cu Kα radiation (λ = 1.5407Å), voltage 50 kV, current 100 mA, and 2θ over a 2–45° range.
Scanning electron microscopy
SEM (Jeol JSM 5600 LV, Jeol, Tokyo, Japan) was used to visualize the external and surface morphology of optimized PSD formulation. PSD were coated with the platinum sputter coater 208 HR (Cressington Scientific Instruments Ltd., Watford, UK) to assure conductivity.
Mechanism of drug release kinetics
The in vitro furosemide release data from PSD were evaluated kinetically using mathematical models namely, zero-order and Higuchi.
For zero-order kinetics: F = kot, where F signifies the fraction of drug released in time t, and ko is the zero-order release constant.
For Higuchi model: F = kHt½, where F signifies the fraction of drug released in time t, and kH is the Higuchi dissolution constant.[21]
Accelerated stability studies
Stability testing is an integral part of formulation development. It provides evidence on how the quality of a drug substance or a drug product varies with time under the influence of a variety of environmental factors. It establishes a re-test period for the drug substance or a shelf-life for the drug product and is used to recommend storage condition. Stability studies were carried out for optimized PSD for 6 months under the storage conditions of 40 ± 2°C/75% ± 5% RH as per ICH guidelines (Q1(A)R2).
RESULTS AND DISCUSSION
Solid dispersions showed a high potential to increase the solubility of a poorly soluble drug. Utilizing, Eudragit L-100 as the carrier, the drug can be dispersed in the polymer as crystals, amorphous particles or molecularly dispersed. As the particle size is decreased solid solutions provide the highest effectiveness for dissolution enhancement. After the SDs were formed (at the ratios of 1:1, 1:2, and 1:3) improved dissolution profiles with more than 60% of drug were released from formulation prepared with (1:2), when compared with a pure drug and other ratios. The momentous difference was found between the dissolution profiles of these SDs as shown in Figure 1.
Figure 1.

Drug release studies of solid dispersion formulation
In addition, the highly dispersing condition of the drug in the carrier or the transition of the physical state of furosemide from crystalline to amorphous would help improving the drug release drastically. Consequently, we selected a drug–polymer ratio system (1:2) which gave adequate dissolution and physicochemical properties for the further analysis and development.
A SD ratio 1:2 exhibited the maximum percentage yield [Table 3]. The content of the drug in the SD formulation was determined. The drug content in all the ratios was ranging from 87.71% to 95.82%, indicating the uniformity in the drug content and was found within the limits. The drug content was estimated in triplicate. Based on the drug content and dissolution studies, SD formulation with a ratio 1:2 was further carried for the preparation of pellets.
Table 3.
Evaluation of furosemide solid dispersion for the percentage yield and drug content

Pellets containing the SD were designed and developed. The powder mixture containing MCC as a spheronizer aid and a SD ratio of 1:2 was used within a pellet core, which was the composition of the pellets prepared by extrusion/ spheronization. The type and amount of granulation liquid were selected by investigating water, isopropyl alcohol, combination of water, and isopropyl alcohol in different ratios. After several trials with different batches of pellets, purified water was selected as wet massing liquid.
The optimum level of granulating fluid is that level which results in maximum pellet roundness in the targeted particle size range. In preliminary work, every formulation was granulated employing a series of water levels. The optimum level was identified as that level which produced nearly round particles whose average size is similar to the aperture of the extrusion screen. The binder selection was carried out using PVP K30 and Sodium caroxymethyl cellulose. PVP K30 was selected based on its capability to produce spherical-shaped pellets. The concentration of the selected binder was optimized to be 1.5%.
The amount and concentration of binder affected the appearance of the resulting pellets. Increasing the volume of binder solution augmented the mean size of pellets but dwindle the yield in the desirable pellet size range. The exploit of an overindulgence amount of binder gave rod-shaped pellets and increased the hardness of the pellets. Due to the influence of the amount of granulating liquid, on the processability of the wet mass, the volume of granulating liquid was further optimized to achieve accurate wetting of mass.
An increase of spheronization speed has already been reported as beneficial for pellet sphericity. This was arbitrated in terms of a high batch yield and a high percentage of pellets obtained with the size ranging 700–900 μm. At higher water concentrations, agglomeration occurred whereas using a sub-optimal amount of water resulted in dumbbells. The significant interaction between water and spheronization speed indicated that a low spheronization speed and water level decreased the sphericity of the end product.
Screening study
During screening studies, Taguchi L4 OA design was used to study the effect of most influential process parameters on the response variables. Four process parameters were chosen for the study and pellets were prepared and evaluated for the percentage yield, particle size, and in vitro dissolution profile. The significant parameters of the extrusion/spheronization were determined using the bar plot [Figure 2], which illustrates the influence of every process parameter on the response variables. Each process parameters in the studied model were characterized by a P-value (the smaller the P-value, the greater the influence of the concerned parameter on the model). From the information given by the bar plot, we could infer that the kneading time and spheronizer speed were positively significant parameters and that, by contrast, the extruder speed and spheronizer time were negatively significant. Finally, the extruder speed and spheronizer time were considered as not significant at all and these were neglected for the optimization step.
Figure 2.

Influence of process parameters on the response magnitude
Optimization of the formulation and pellets characterization
Pellets containing furosemide SD were prepared according to the CCD. Table 4 gives an overview of the characteristics of these pellets. Both independent variables, i.e. kneading time and spheronizing speed, had a statistically significant effect on pellet sphericity. As the speed of the spheronizer was increased, the pellets became more spherical, rounder and uniform size. However, at a moderate-to-high level of spheronizer speed pellet roundness was observed. There are factors in the pelletization process that cannot be controlled and these influence the results.
Table 4.
Experimental plan and observed response values of PSD

The three-dimensional response surface plots for the studied response properties namely, % yield, pellet size, and drug release at 12 h are shown in Figures 3–5. A sharp decline in the value of % yield at the low level of both the parameters, i.e., kneading time and spheronizer speed as shown in Figure 3, the influence of spheronizer speed being much more pronounced and the effect of kneading time being less prominent.
Figure 3.

Response surface plot showing the influence of kneading time and spheronizer speed on the value of percentage yield of PSD formulation
Figure 5.

Response surface plot showing the influence of kneading time and spheronizer speed on the value of cumulative drug release profile at 12 h of PSD formulation
A nonlinear trend in the values of size markedly increasing with the augmentation of kneading time is shown in Figure 4. With spheronizer speed, the values of the pellet size tend to rise nonlinearly, followed by asymptote at the low level of kneading time. Figure 5 shows a nearly linear ascending pattern for the values of dissolution at 12 h, as the level of either kneading time or spheronizer speed was increased. The changes in the values of drug dissolution were caused by the variation of the process parameter. About 88.521 ± 0.69% of the drug was released after 12 h (Y2) when both the parameters, kneading time and spheronizer speed, were at the highest level as shown in Figure 5. Maximum drug released was observed at the highest levels of the process parameter, namely, kneading time and spheronizer speed. A nearly linear ascending pattern for the values of dissolution at 12 h, as the level of spheronizer speed was increased and slightly showed a curvilinear pattern as increasing the level kneading time as revealed in Figure 5.
Figure 4.

Response surface plot showing the influence of kneading time and spheronizer speed on the value of pellet size between 700 and 800 μm of PSD formulation
The relationship between the corresponding responses and factors are exposed in Figures 3 and 5. It was found that extending kneading time increased the particle size, where the pellet size grew from 680.7 μm (experiment no. 1) to 753.2 μm (experiment no. 4) [Table 4]. The observed positive effect of kneading time from the lower level to the medium level was assumed to be the result of fact that extended kneading period offers extra colliding probabilities which were indispensable for the granule growth. Another reason for this may be enhanced wetting of the mass throughout the pelletization process. On the other hand, the influence of kneading time at medium levels was more pronounced than that at low and high levels. A nearly curvilinear increasing trend in the values of the pellet size at the medium level of kneading time and slightly a high level of spheronizer speed is shown in Figure 3. Consequently, the liquid kept inside PSD could be squeezed out to the surfaces, which may make the mass wet and adhesive and led to the fast growth of particles.
The drug content in the PSD formulations was determined and the results are shown in Table 5. The drug content in the pellets was ranging from 85.2 ± 0.5 to 95.4 ± 0.9%, indicating the uniformity in the drug content. The angle of repose and flow rate of all the experimental formulations were carried out. It was observed that the PSD had a minimum angle of repose and good circularity as well as the high density and high flow rate according to the fixed funnel method. The friability test depicts that less than 1% weight loss in Table 5 occurred in all the experiments which might be due to a large surface area of pellets and the presence of few cracks on the surface of pellets. Friability decreases along with augment in uniformity of pellets size and shape. The results showed that prepared pellets were less friable and within the limit according to Indian pharmacopeial 2007 norms.
Table 5.
Evaluation parameters of the pellets containing solid dispersion

In-vitro drug release studies
The dissolution profile of the pure drug, marketed formulation, initial PSD and PSD stored for 6 months as shown in Figure 6. In the case of PSD, around 31.27% of the drug was released within 2 h in (SAF) and more than 57.521% drug was released in a SR pattern at the end of 12 h. There was a significant difference among the dissolution profile of the pure drug, marketed formulation, PSD, and those stored for 6 months. As evident from the assorted nature of dissolution profiles [Figure 6], the influence of the polymer level and MCC seems to be vital in regulating the drug release. Several kinetic models describe the drug release from immediate and modified release dosage forms. The model that best fits the release data was evaluated by a correlation coefficient (r2) and is shown in Table 6. The correlation coefficient (r2) values were used as the criteria to choose the best model to describe drug release from the PSD. The (r2) values (r2 = 0.9864) obtained for fitting the drug release data to the Higuchi's equation indicated that the drug release mechanism from these PSD was diffusion controlled. In PSD formulation, the r2 values (0.9947) were also obtained for fitting the drug release data in the zero-order model indicating that the drug release from the PSD was according to the zero-order kinetics and thus showing the drug release rate was independent of the residual concentration of the drug. In this study, it may be elucidated by the fact that the PSD attained sufficient wetting as they resided at the bottom of the testing cup throughout the entire test.
Figure 6.

Comparison of dissolution profiles of pure drug, marketed formulation with initial PSD and that stored for 6 months as per the experimental design (n = 3). The kneading time and spheronizer speed used for preparing pellets was 250 s and 980 rpm. The cross bars indicate ± 1 SD
Table 6.
Kinetic data for drug release from PSD formulations

The model equation generated to fit the data and reflected the influence of process parameters on the percentage yield is as follows:
y1 = 73.02 + 9.000x1 + 8.020x2 – 11.250x12 – 7.748x22 (r2 = 0.8762, p < a = 0.1)
With respect to the pellet size characteristics, both responses, y2 (pellet size) and y3 (drug released), were affected remarkably by the investigated process variables. The equations generated are as follows:
y2 = 854.0 – 17.68x1 + 7.07x2 – 70.12x12 – 82.62x22 + 25.00x1x2 (r2 = 0.9380, p < a = 0.1)
y3 = 81.24 + 1.03x1 – 0.071x2 – 1.86x21 + 1.37x22 + 0.18x1x2 (r2 = 0.9691, p < a = 0.1)
Validation of model optimization
In order to evaluate the optimization capability of the models generated according to the results of CCD, PSD including the same formulation was prepared using the optimal process variable settings. In vitro dissolution and yield comparisons of the results obtained from prepared PSD with that predicted by models are shown in Table 7. The results demonstrated a good agreement on product properties with theoretical predictions. The in vitro drug release was also evaluated from PSD, which were prepared with the optimal settings after storage in 25 ± 2°C, 60% RH for 6 months. Comparisons in the drug release profile of initial PSD with those stored for 6 months, the pure drug and marketed formulation are illustrated in Figure 6. It can be perceived that the dissolution profile of the drug after storage for 6 months appeared to be much similar to that obtained at initial time, which indicated PSD were stable under the storage conditions.
Table 7.
Result of experiments for confirming optimization capability

Optimization by desirability function
Further, optimization process was carried out with desirability function to optimize the three responses simultaneously. The responses: percentage yield (Y1), pellet size (Y2), and % dissolution rate (Y3) were transformed into the desirability scale d1, d2, and d3, respectively. Among these objectives, Y2 was minimized, while Y1 and Y3 were maximized. The model was fitted with a second-order polynomial expression. The response surface for D holding variables X1 and X2 are shown in Figure 7. We sought the maximum value of D in this region (x1: 240–300; x2: 875–1012).
Figure 7.

Response surface for overall desirability as a function of kneading time and spheronizer speed
Differential scanning calorimetric analysis
To investigate the effect of SD inside the pellet core DSC was performed. The DSC thermograms of the pure drug, physical mixture and final optimized PSD formulation are shown in Figure 8. It can be seen that the pure drug showed an endothermic peak of melting about 230°C while the physical mixture showed an endothermic peak at 245.3°C. The optimized formulation showed that the drug peak intensity was increased further shifted towards higher temperature at 246.5°C, which indicates such an effect may be observed in the presence of the moisture content and it did not illustrate the presence of any thermal transition in the experimental conditions.
Figure 8.
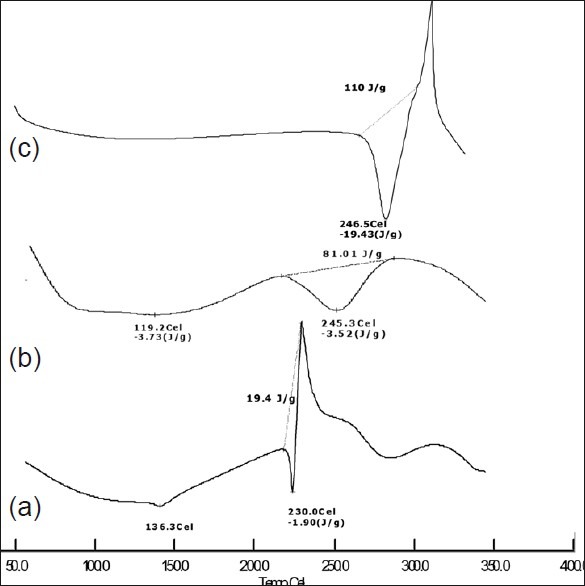
Differential scanning thermogram of (a) pure drug, (b) Eudragit L-100, (c) optimized PSD formulation
Powder X-ray diffraction pattern
The X-ray diffraction patterns of the pure drug, physical mixture and final optimized formulation are shown in Figure 9. The X-ray pattern of pure furosemide revealed a drug fingerprint with intense and sharp peaks, indicating its crystalline nature as demonstrated by sharp peaks observed at 2, 12, 14, 17, 18, 19, 21, 23, 25, 26, 28, and 29°. There is a significant difference between the 2θ values of the pure drug and final optimized PSD formulation. A reduction in crystallinity was observed in the optimized PSD formulation spectrum indicating that the crystallinity of the drug was reduced to a greater extent or a change into the amorphous form.
Figure 9.

Powder X-ray diffractometry of (a) pure drug, (b) Eudragit L-100, and (c) optimized PSD formulation
Scanning electron microscopy
SEM studies were carried out on final optimized formulation to determine the surface morphology and intactness of the drug was observed. PSD were uniform size and spherical in shape with small porous and little rough surface was observed in optimized formulation [Figure 10]. The rough surface is caused due to the rapid loss of moisture from the wet mass with the high liquid content that results in a porous surface structure. Pellets making from wet mass with a higher liquid content that are progression by extrusion/spheronization tend to have a rough surface.
Figure 10.
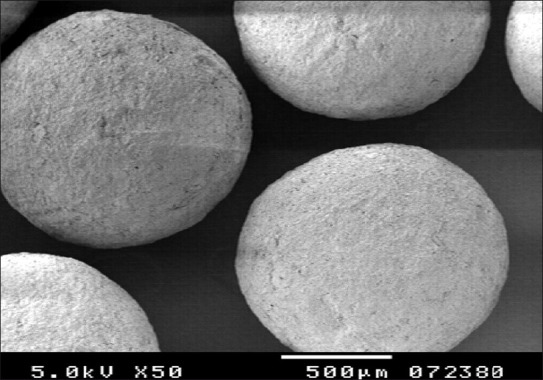
Scanning electron microscopy of optimized PSD formulation
CONCLUSION
Successful dissolution rate improvement of furosemide was obtained using SD prepared with Eudragit L-100 by a solvent evaporation method. Furosemide was presented as an amorphous state in the SD at a drug-to-polymer ratio of 1:2 (w/w) and released almost 30 times faster than the pure drug. PSD showed high content uniformity and showed a SR profile with approximately 88.521% of drug was released at the end of 12 h. Product properties including the dissolution profile and percentage yield of the desired size fraction were improved by using the optimal parameter settings and the results showed a good agreement with the prediction of the models. The method used to prepare SD of furosemide in this study is relatively simple and safe, because of the absence of specialized equipment and organic solvent. Kneading time and spheronizer speed were significant parameters which influence the pellet characteristics complicatedly during the high pelletization process. These parameters could be optimized successfully by a CCD.
ACKNOWLEDGMENTS
The authors are grateful to Prof. B. G. Shivananda, The Principal, Al-Ameen College of Pharmacy, Bangalore, for his continuous support. The authors are thankful to Micro Labs Ltd. for providing the gift sample of furosemide and to Evonik, Degussa India Ltd, Mumbai, for providing the gift sample of Eudragit L-100.
Footnotes
Source of Support: Nil
Conflict of Interest: None declared.
REFERENCES
- 1.Murray MD, Haag KM, Black PK, Hall SD, Brater DC. Variable furosemide absorption and poor predictability of response in elderly patient. Pharmacotherapy. 1997;17:98–106. [PubMed] [Google Scholar]
- 2.Filippis PD, Zingone G, Gibellini M, Rubessa F, Rupena P. Dissolution rates of different drugs from solid dispersions with Eudragit RS. Eur J Pharm Sci. 1995;3(5):265–71. [Google Scholar]
- 3.Otsuka M, Onoe M, Matsuda Y. Hygroscopic stability and dissolution properties of spray-dried solid dispersions of furosemide with eudragit. J Pharm Sci. 2006;82:32–8. doi: 10.1002/jps.2600820108. [DOI] [PubMed] [Google Scholar]
- 4.Boles Ponto LL, Schoenwald RD. Furosemide: A pharmacokinetic/ pharmacodynamic review part I. Clin Pharmacokinet. 1990;18:381–408. doi: 10.2165/00003088-199018050-00004. [DOI] [PubMed] [Google Scholar]
- 5.Ozdmir N, Ordu S. Improvement of dissolution properties of furosemide by complexation with β -cyclodextrin. Drug Dev Ind Pharm. 1998;24:19–25. doi: 10.3109/03639049809082348. [DOI] [PubMed] [Google Scholar]
- 6.Klausner EA, Lavy E, Stepensky D, Cserepes E, Barta M, Friedman M, et al. Furosemide pharmacokinetics and pharmacodynamics following gastro retentive dosage form administration to healthy volunteers. J Clin Pharmacol. 2003;43:711–20. [PubMed] [Google Scholar]
- 7.Maeda T, Takenaka H, Yamahira Y, Noguchi T. Use of rabbits for GI drug absorption studies: Relationship between dissolution rate and bioavailability of griseofulvin tablets. J Pharm Sci. 1979;68:1286–9. doi: 10.1002/jps.2600681023. [DOI] [PubMed] [Google Scholar]
- 8.Kislalioglu MS, Khan MA, Blount C, Goettsch RW, Bolton S. Physical characterization and dissolution properties of ibuprofen: Eudragits coprecipitates. J Pharm Sci. 1991;80:799–804. doi: 10.1002/jps.2600800820. [DOI] [PubMed] [Google Scholar]
- 9.Mooter GV, Wuyts M, Blaton N, Busson R, Grobet P, Augustijns P, et al. Physical stabilization of amorphous ketoconazole in solid dispersions with polyvinylpyrrolidone K25. Eur J Pharm Sci. 2000;12:261–9. doi: 10.1016/s0928-0987(00)00173-1. [DOI] [PubMed] [Google Scholar]
- 10.Moyano JR, Arias MJ, Gines JM, Rabasco AM. Dissolution behaviour of oxazepam in presence of cyclodextrins-evaluation of oxazepam-dimeb binary system. Drug Dev Ind Pharm. 1997;23:379–85. [Google Scholar]
- 11.Gruenhagen HH. Melt extrusion technology. Pharm Manuf Int. 1995;2:167–70. [Google Scholar]
- 12.Erkoboni DF. Pharmaceutical Extrusion Technology. New York: Marcel Dekker; 2003. Extrusion/spheronization. [Google Scholar]
- 13.Ott AD, Thommes M, Remon JP, Kleinebudde P, Vervaet C. Production of pellets via extrusion-spheronisation without the incorporation of microcrystalline cellulose. Eur J Pharm Biopharm. 2009;71:38–46. doi: 10.1016/j.ejpb.2008.08.005. [DOI] [PubMed] [Google Scholar]
- 14.Schilling SU, Shah NH, Malick AW, McGinity JW. Properties of melt extruded enteric matrix pellets. Eur J Pharm Biopharm. 2010;74:352–61. doi: 10.1016/j.ejpb.2009.09.008. [DOI] [PubMed] [Google Scholar]
- 15.Gotti R, Furlanetto S, Andrisano V, Cavrini V, Pinzauti S. Design of experiments for capillary electrophoretic enantioresolution of salbutamol using dermatan sulphate. J Chromatogr. 2000;875:411–22. doi: 10.1016/s0021-9673(99)01303-5. [DOI] [PubMed] [Google Scholar]
- 16.Singh G, Pai RS, Devi VK. Response surface methodology and process optimization of sustained release pellets using Taguchi orthogonal array design and central composite design. J Adv Pharm Technol Res. 2012;3:30–40. doi: 10.4103/2231-4040.93565. [DOI] [PMC free article] [PubMed] [Google Scholar]
- 17.Singh R, Poddar SS, Chivate A. Sintering of wax for controlling release from pellets. AAPS PharmSciTech. 2007;8:E175–83. doi: 10.1208/pt0803074. [DOI] [PMC free article] [PubMed] [Google Scholar]
- 18.Clarke GM, Newton JM, Short MB. Comparative gastrointestinal transit of pellet systems of varying density. Int J Pharm. 1995;114:1–11. [Google Scholar]
- 19.Souto C, Rodrıguez A, Parajes S, Pacheco RM. A comparative study of the utility of two superdisintegrants in microcrystalline cellulose pellets prepared by extrusion-spheronization. Eur J Pharm Biopharm. 2005;61:94–9. doi: 10.1016/j.ejpb.2005.04.003. [DOI] [PubMed] [Google Scholar]
- 20.Vijayalakshmi P, Devi VK, Narendra C, Srinagesh S. Development of extended zero-order release gliclazide tablets by central composite design. Drug Dev Ind Pharm. 2008;34:33–45. doi: 10.1080/03639040701386129. [DOI] [PubMed] [Google Scholar]
- 21.Nayak AK, Laha B, Sen KK. Development of hydroxyapatite-ciprofloxacin bone-implants using Quality by design. Acta Pharm. 2011;61:25–36. doi: 10.2478/v10007-011-0002-x. [DOI] [PubMed] [Google Scholar]