

Abstract
A major concern in common disease epigenomics is distinguishing causal from consequential epigenetic variation. One means of addressing this issue is to identify the temporal origins of epigenetic variants via longitudinal analyses. However, prospective birth-cohort studies are expensive and time consuming. Here, we report DNA methylomics of archived Guthrie cards for the retrospective longitudinal analyses of in-utero-derived DNA methylation variation. We first validate two methodologies for generating comprehensive DNA methylomes from Guthrie cards. Then, using an integrated epigenomic/genomic analysis of Guthrie cards and follow-up samplings, we identify interindividual DNA methylation variation that is present both at birth and 3 yr later. These findings suggest that disease-relevant epigenetic variation could be detected at birth, i.e., before overt clinical disease. Guthrie card methylomics offers a potentially powerful and cost-effective strategy for studying the dynamics of interindividual epigenomic variation in a range of common human diseases.
There is increasing interest in exploring the possibility that interindividual epigenetic variation plays a role in common human disease etiology (for review, see Petronis 2010; Rakyan et al. 2011). Consequently, epigenome-wide association studies (EWASs), analogous to genome-wide association studies (GWASs) for disease-associated genetic variants (Rakyan et al. 2011), are currently being conducted to systematically uncover epigenetic variants for a range of different diseases (www.roadmapepigenomics.org/participants lists some of the current NIH-funded EWASs). However, the disease process itself can also induce epigenetic changes. Therefore, an EWAS design that just compares post-disease affected with unaffected individuals will not distinguish causal from consequential disease-associated epigenetic variation. The inability to make this distinction will ultimately prove to be a significant barrier to establishing the etiological role or medical value for any disease-associated epigenetic variants.
One way of addressing this issue is to determine whether the epigenetic variants are detectable before overt disease. Although such variants could arise at any point during an individual's lifespan (Fraga et al. 2005), in-utero development is considered to be a period during which the epigenome is particularly susceptible to stochastic and/or environmental factors such as infection, poor diet, or stress (for review, see Warner and Ozanne 2010). A variety of common diseases have been proposed to have a component of in-utero origins including asthma, metabolic conditions including type 2 diabetes, and autoimmune disorders like multiple sclerosis (Heijmans et al. 2008; Warner and Ozanne 2010). Hence, being able to determine epigenomic profiles at birth, and by implication before overt disease, would be invaluable for elucidating the origins and potentially the etiological role of disease-associated epigenetic variants. In this regard, prospective birth-cohort studies are very useful but, unfortunately, are expensive, time-consuming, and difficult to establish.
In 1963, Robert Guthrie proposed spotting a small amount of neonatal blood onto filter paper for the large-scale biochemical screening of various diseases such as phenylketonuria (Guthrie and Susi 1963). “Guthrie cards” are now routinely created by major national health authorities; e.g., since 2000, over 90% of all neonates in the United States had Guthrie cards made shortly after birth (Pollitt 2009). Remarkably, in many cases Guthrie cards are being stored indefinitely. This led us to consider genome-wide DNA methylation profiling—DNA methylomics—of Guthrie cards as a means of investigating the origins of disease-associated epigenetic variation. Crucially, this longitudinal investigation could be done retrospectively at a fraction of the cost and time investment required for prospective studies.
Results
Our first objective was to confirm that Guthrie cards could be used to generate high-quality DNA methylomes. We obtained Guthrie cards from the Diabetes Prediction in Skåne (DiPiS) study (Larsson et al. 2004). These cards were spotted with cord blood in September 2000 (Methods). Of several different protocols, we found the Gensolve kit provided the highest genomic DNA (gDNA) yields from Guthrie cards (data not shown). A typical Guthrie card consists of four ∼6-mm diameter blood spots, and we routinely obtained ∼200 ng of gDNA per spot (Fig. 1). Although Guthrie card gDNA was of a slightly lower molecular weight compared with gDNA from freshly sampled cord blood, significant degradation was minimal (Supplemental Fig. 1). We then validated two different platforms for DNA methylomics, each offering different advantages: Illumina 450K arrays (Bibikova et al. 2011; Sandoval et al. 2011) and Methylated DNA Immunoprecipitation combined with HTS (MeDIP-seq) (Weber et al. 2005; Down et al. 2008).
Figure 1.

An example of the type of Guthrie cards used in our study (image from Ake Lernmark).
The Illumina450K array is a genome-scale platform that provides bisulfite conversion-based, single-base resolution methylation measurements at ∼450,000 different cytosines associated with a range of genomic features such as promoters, enhancers, and CpG islands (CGIs) (Sandoval et al. 2011). We generated biological duplicate Illumina450K profiles for Guthrie cards, freshly sampled cord blood, and mature sperm, all from unrelated individuals (Supplemental Table 1). Comparison of Illumina450K-based “fresh blood vs. sperm” tissue-specific differentially methylated regions (tDMRs) with “blood vs. sperm” tDMRs identified by bisulfite PCR sequencing in the Human Epigenome Project (Eckhardt et al. 2006) revealed a high correlation (R2 = 0.90, Pearson's) (Fig. 2A). Importantly, a comparison between Illumina450K-based fresh blood and Guthrie card profiles also revealed an excellent correlation (R2 = 0.99, Pearson's) (Fig. 2B). However, in both cases, the correlation was significantly weaker for tDMR methylation differences of <20% (R2 for <20% methylation differences = 0.50, Pearson's), and thus we set a conservative minimum threshold of ≥20% methylation difference for calling intersample DMRs in the analyses described below (in the rest of the manuscript, when we state “% methylation difference,” we mean an absolute difference in the beta value × 100). To further confirm the quality of Guthrie card methylomes, we compared canonical gene-associated DNA methylation profiles for both CGI and non-CGI associated genes between Guthrie cards and fresh blood and found the profiles to be virtually identical for the two different types of samples (Supplemental Fig. 2).
Figure 2.

Array and sequencing-based DNA methylomics of Guthrie cards. (A) Comparison of Illumina450K-based “fresh cord blood vs. sperm” tDMRs with “blood vs. sperm” tDMRs identified in the Human Epigenome Project (HEP) (Eckhardt et al. 2006). Plotted are 468 genomic regions (∼200–300 bp in length) common between the HEP and the Illumina450K data sets. Illumina450K-based “fresh cord blood vs. sperm” tDMRs that display <20% methylation differences are shown in gray. R2 = 0.90 (overall), R2 = 0.50 (<20% methylation), both Pearson's. (B) A comparison of fresh cord blood and Guthrie card Illumina450K profiles with HEP data. Shown is methylation data for regions called “blood vs. sperm” tDMRs in the HEP. Each column represents profiles from a separate individual, and 106 different tDMRs are shown. (SP) Sperm. (C) Normalized MeDIP-seq read counts for the “blood vs. sperm” tDMRs identified by the use of Illumina450K-based fresh blood (top) or Guthrie cards (bottom) across a range of CpG densities. Only >20% tDMR methylation differences are shown. The percentage agreement is indicated in each panel. Number of different CpGs represented in each panel: Low CpG, n = 6404; mid-CpG, n = 28,384; high CpG, n = 18,135. Note the numbers are the same for the “Fresh blood” and “Guthrie card” data sets as the differentially methylated CpG sites were called on the Illumina450K arrays.
In MeDIP-seq, immunoprecipitated methylated DNA fragments are subjected to HTS, representing a cost-effective strategy for generating whole-genome DNA methylomes at ∼50 bp resolution (Down et al. 2008). For Guthrie cards analysis, we developed a MeDIP-seq protocol for 200 ng of gDNA (Methods). We also generated standard MeDIP-seq libraries using 2 μg of DNA from fresh cord blood and sperm (Supplemental Table 1). The MeDIP-seq data were then compared with the Illumina450K-based profiles described above (Fig. 2C). Because MeDIP enrichment of a genomic region is dependent on the density of methylated CpG sites, standard measures of correlation are not suitable, and instead we calculated an “agreement” score: the percentage of Illumina450K-based DMRs that show the same directional differences in MeDIP-seq read counts between the two samples under consideration. Very good agreement scores (75%–93%) were observed between Illumina450K and MeDIP-seq data sets across a range of CpG densities. A similar analysis using Guthrie card vs. sperm MeDIP-seq-based tDMRs yielded equally strong agreement with Illumina450K data (Fig. 2C).
Our second objective was to determine the potential utility of Guthrie cards for studying human interindividual epigenetic variation. If in-utero-derived epigenomic perturbations can impact on phenotypic outcomes in later life, then there must be some interindividual epigenetic variants that are detectable at birth and temporally stable. To obtain evidence for the existence of such epigenetic variants, we conducted an integrated methylomic/genomic analysis of Guthrie cards and follow-up samplings as outlined in Figure 3A. We obtained Guthrie cards spotted with cord-blood from three unrelated individuals (two females and one male) from the DiPiS study and generated Illumina450K-based DNA methylomes. For each of the three different pairwise comparisons, we found ∼2000–3000 CpG sites that displayed interindividual DNA methylation differences of >20% (Fig. 3B) (sex chromosomes were excluded from all analyses). We then filtered these lists to reduce the influence of artifactual methylation measurements and interindividual genetic variation (Table 1). To this end, we first generated genome-wide single nucleotide polymorphism (SNP) profiles for all three individuals using their Guthrie card DNA. SNP profiling was done using the Illumina Omni2.5S array that contains ∼2.5 million SNPs with a minor allele frequency of down to 1%. Using these data, we applied three main filters to each of the three different pairwise lists of interindividual single CpG methylation differences: (1) excluded those CpGs that overlapped single nucleotide polymorphisms (SNPs) or were located within a copy number variant (CNV). This eliminates artifactual measurements that are not methylation differences, but rather due to the creation/destruction of CpGs or differences in copy number, an issue rarely addressed in complex disease epigenomics. (2) As the biological relevance of methylation differences limited to single CpG sites is presently unclear, for the second filter we specified that the CpG must exist as part of a differentially methylated region (DMR), i.e., neighboring CpGs within a 250-bp window of the index CpG site must also display >20% methylation differences in the same direction. (3) Recently, Bell and colleagues identified 180 different CpGs in the human genome whose methylation state in lymphoblastoid cells is influenced by genetic variation (Bell et al. 2011). Crucially, in the vast majority of cases they found the genetic influence to act in cis and <5 kb from the CpG site of interest. Therefore, for the third filter, we retained only those DMRs that are located within a ≥10-kb window that does not contain any SNP differences, as measured by the Illumina Omni2.5S SNP array in the pairwise comparison under consideration. This reduces the likelihood of interindividual genetic differences being the sole drivers of the DMRs (although in a few cases rare genetic variants missing from the SNP arrays would be overlooked). Overall, application of the filters resulted in a final set of 10–13 different interindividual DMRs per pairwise comparison (Fig. 3B; Table 2). Given the stringency of our filters, this is almost certainly an underestimate of the level of interindividual DNA methylation variation that exists between any two unrelated human individuals.
Figure 3.

Identification at birth of temporally stable individual-specific DNA methylation variants. (A) Experimental strategy schematic: (1) Guthrie card Illumina450K profiles were generated and >20% interindividual pairwise methylation differences called (sex chromosome data were excluded from all analyses); (2) SNP data were also generated from Guthrie card DNA; (3) a variety of filters (detailed in Table 1) were applied to the Illumina450K profiles, and then validation was performed using MeDIP-seq profiles of blood sampled when the individuals were 3 yr old. (B) Identification of temporally stable interindividual DMRs that exist at birth. (Gray points) Single CpG interindividual differences of >20%; (red points) the filtered set. The number of CpGs remaining after each filter is indicated in the adjoining tables. The final sets of CpGs (red points in the figure) were grouped into “DMRs”—differentially methylated regions. Binomial P-values (calculated at a per-DMR level) for the “Agreement scores” between Illumina450K and MeDIP-seq data are: F1 vs. F2: P = 0.01, F1 vs. M: P = 0.11, F2 vs. M: P = 0.0003.
Table 1.
Filters applied to the DMRs
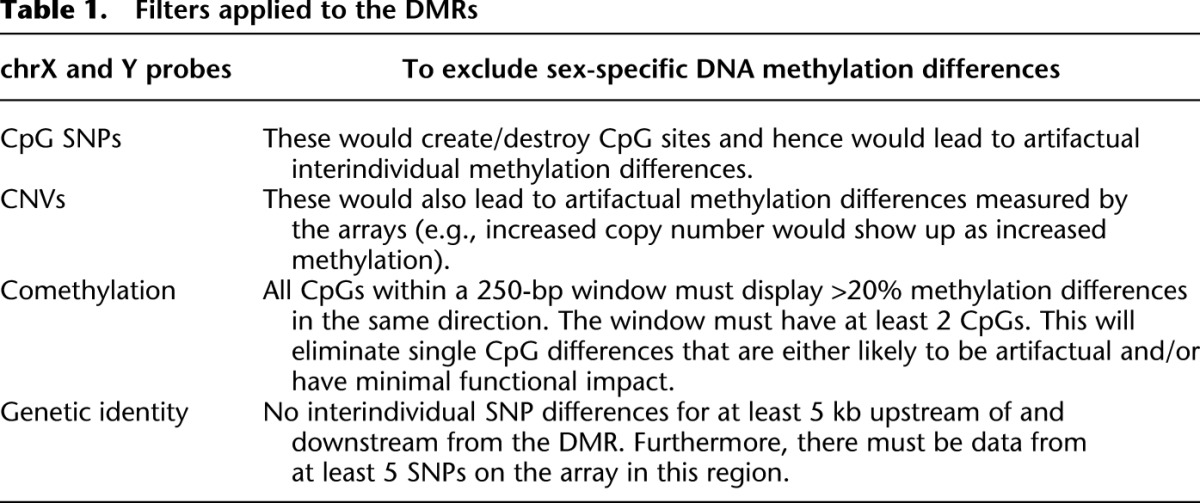
Table 2.
Genomic characteristics of the interindividual DMRs
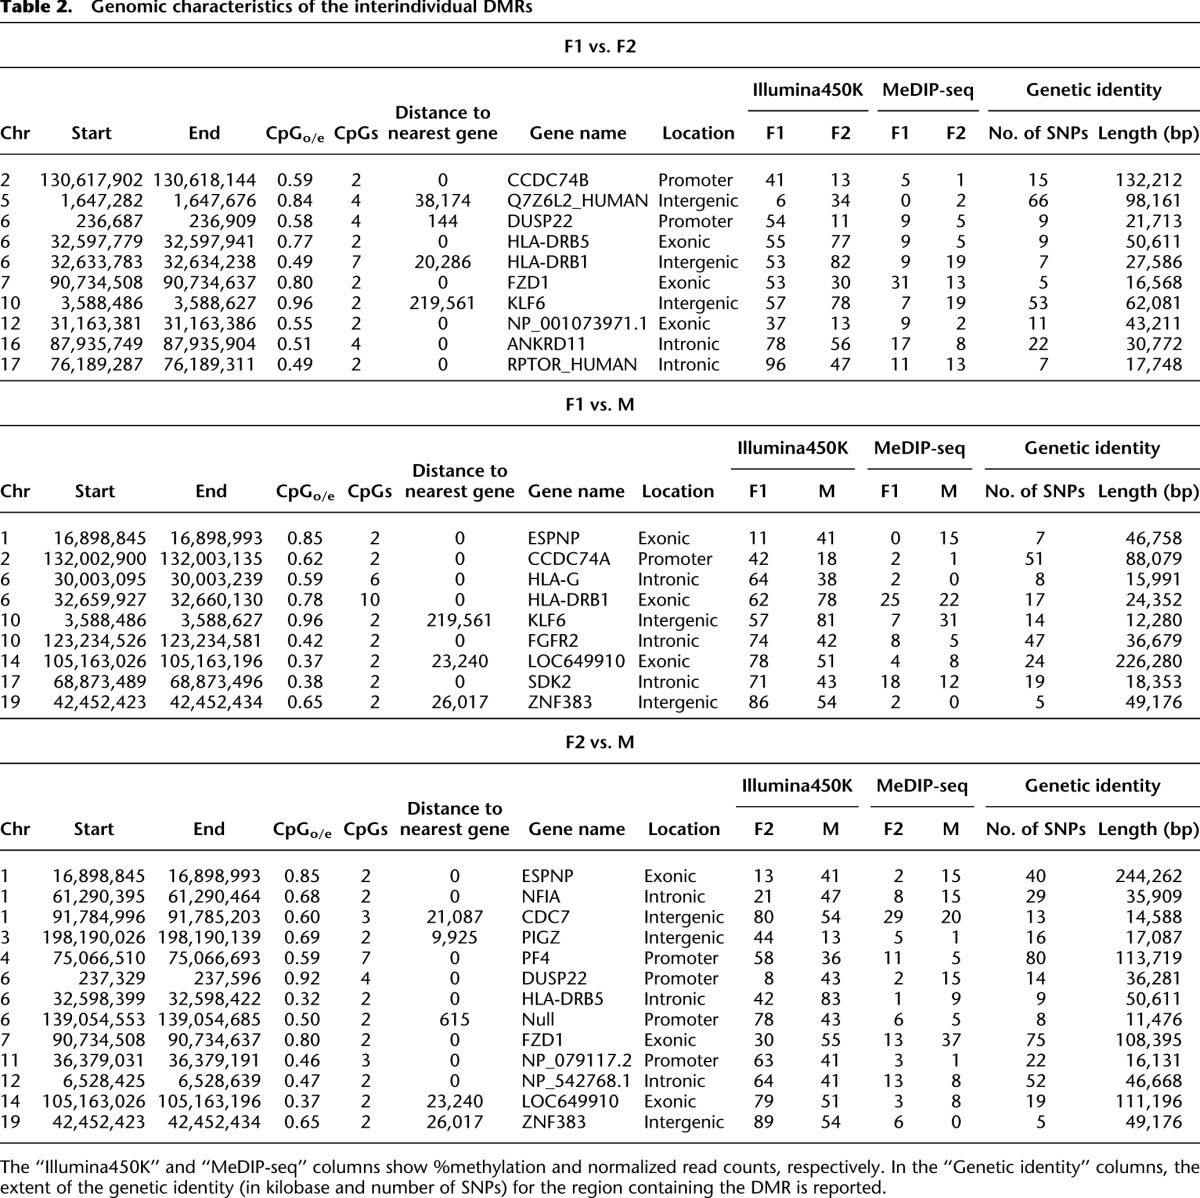
Then, to establish the temporal stability of the DMRs found using Guthrie cards (i.e., at birth), we generated MeDIP-seq profiles of whole blood sampled from the same individuals when they were 3 yr old (all individuals were disease-free at the time of sampling). Since we did not have access to 500 ng of gDNA required to perform 450K analysis on the follow-up samples, we used the MeDIP-seq method for 200 ng of gDNA as described above. Given the differences in platform-specific biases, the eventual results would, if anything, be an underestimate of the number of temporally stable epialleles that exist in the individuals under study. MeDIP-seq sequencing statistics are provided in the Supplemental section. Comparison between the final set of “at birth” Illumina450K-based interindividual DMRs with MeDIP-seq profiles of the same individuals at 3 yr old yielded agreement scores ranging from 70% to 91% (Fig. 3B). This demonstrates, for the first time, the existence of temporally stable interindividual epigenetic variation that is present at birth. These DMRs were found across the genome associated with a variety of genomic elements, including promoters and CGIs, but also intergenic regions (Table 2). Interestingly, a few DMRs were located within genes associated with human diseases, e.g., FZD1 expression is down-regulated in ulcerative colitis (Hughes et al. 2011) and NFIA has been associated with celiac disease (Dubois et al. 2010). It is also worth noting the large difference in agreement scores between the unfiltered (52%–55% i.e., marginally better than random) and post-filtered data (70%–91%). This suggests that future epigenomic investigations should integrate epigenetic and genetic variation data to optimize the biological relevance and reduce false-positive “epigenetic” discoveries.
Discussion
A significant challenge in EWASs will be distinguishing causal from consequential epigenetic variation, and using solely “case vs. control” study designs will not help to address this issue. Rather, as has been recently discussed (Rakyan et al. 2011), effective EWASs will need to combine different types of cohorts, among which longitudinal cohorts in particular will be invaluable. Guthrie card DNA methylomics therefore has the potential to become a valuable component of EWASs for a range of common diseases.
Guthrie cards could offer several advantages over large-scale prospective studies. First, in most cases they are created and stored by national health authorities, e.g., www.newbornbloodspot.screening.nhs.uk. Second, if Guthrie cards are combined with an initial post-disease profiling of cases vs. controls, then only affected individuals and a suitable number of controls need to be included in the retrospective longitudinal analyses, whereas in prospective cohorts it is very difficult to predict which individuals will develop the disease of interest, necessitating very large sample numbers. Third, although at present Guthrie cards are available for individuals <20 yr old, this already represents millions of individuals, many of whom have developed a disease (e.g., both type 1 diabetes and asthma represent childhood-onset diseases), and these numbers will only increase. In terms of potential limitations, Guthrie cards are restricted to whole blood that represents a heterogeneous population of cells. But this is also typically the case in large-scale prospective studies in which, for logistical reasons, it is only possible to sample tissues such as whole blood or buccals. However, since in-utero events are thought to impact on more than one tissue, Guthrie cards are likely to be informative for the epigenetics of a range of diseases that affect multiple blood subtypes and possibly even non-blood tissues. Although one could argue that prospective studies are likely to obtain more detailed information about life-style factors, Guthrie cards could still be used to establish whether disease-associated DNA methylation variants are present at birth, providing a crucial starting point for further research, including investigating the possibility of using epigenetic variants, in combination with genetics, as predictive markers. Finally, the vast numbers of Guthrie cards that currently exist provide a pool of material to study a large range of diseases. It is also worth noting that spotting blood on filter paper is not limited to neonatal screening, but could also be more widely applied in home/field-based settings.
Using Guthrie cards, we were able to identify temporally stable epialleles that are present at birth in humans, demonstrating a key application of Guthrie card methylomics. The identified DMRs described above must have been present in-utero since they were identified at birth. Given the filters we applied to the data, the DMRs are more likely due to environmental or stochastic interindividual differences within the in utero milieu (e.g., differences in maternal diet) rather than solely genetic differences. Indeed, even though ∼95% of the CpGs assayed by Illumina27K arrays are also represented on the Illumina450K array (Bell et al. 2011), none of the CpGs they identified, at which the methylation state is influenced by cis-genetic variation, overlap our final filtered list of DMRs. However, to unequivocally rule out genetic differences, extensive resequencing of the DMRs would be required, which was not feasible for our proof-of-principle study, but should be performed in future larger-scale EWASs. Although in this study we focused on identifying epigenetic alterations that are less likely to be due to genetic heterogeneity, Guthrie card methylomics will also be useful for studying genotype–epigenotype interactions. Recently, it has been shown that genetic influences on epigenetic states in the human genome can be probabilistic, i.e., there isn't a strict one-to-one relationship between genotype and epigenotype, but rather a certain probability at which a given epigenetic state will arise (Feinberg and Irizarry 2010). Such regions have been termed “variably methylated regions” or VMRs (Feinberg and Irizarry 2010). VMRs show similar properties to “metastable epialleles” previously described in mice (Morgan et al. 1999; Rakyan et al. 2003) and humans (Waterland et al. 2010), at which the establishment of the epigenetic state occurs during early development in a probabilistic manner. Therefore, if genetically influenced probabilistic establishment of epigenetic state occurs during embryogenesis, then knowing the epigenetic state at birth would be invaluable for understanding the biological impact and predicting the phenotypic outcomes of such genetic variants.
In summary, Guthrie cards will allow retrospective investigations into the temporal origins of epigenetic variants and potentially help elucidate their etiological role. Robert Guthrie envisaged that such cards would eventually find many uses for understanding and ultimately preventing human diseases; the application to complex disease epigenomics would be a novel and powerful use of this remarkable resource.
Methods
Samples
Guthrie card and fresh cord blood samples were obtained from the DiPiS (Diabetes Prediction in Skåne) study (Supplemental Table 1). The cord blood-spot cards used in this study were created in September 2000 and stored in the dark at ambient temperature (20–21°C) in individual page protectors. Umbilical cord blood was collected by venopuncture into BD Vacutainer EDTA tubes (BD), spotted onto filters grade 2992 (Schleicher & Schuell), and air-dried before storage. Fresh cord blood samples (from September, 2010) were collected into EDTA tubes at Malmö University Hospital, Lund University, and processed within 24 h. For the samplings of the 3-yr-old children, venous EDTA blood sample was obtained at a Community Health Center. The EDTA blood was immediately added to the Guthrie card in three droplets and allowed to dry before being mailed overnight in a page protector to the laboratory in Malmö, Sweden. The Guthrie cards were stored in the dark at room temperature before analysis within a month. The DNA from fresh cord blood was prepared using QIAamp DNA Blood Midi kit (Qiagen) according to the manufacturer's protocol. The Lund University Research Ethics Committee approved the study and written informed consent was obtained from participating mothers (DiPiS ethics approval no. Dnr 2009/244).
Isolation of genomic DNA from Guthrie cards
Guthrie card gDNA was extracted using the GenSolve kit as per the manufacturer's instructions (www.genvault.com/html/products). Following extraction, the samples were further purified using the Qiagen QiaAmp mini columns and eluted in 100 μL of elution buffer. DNA concentration was determined using a Qubit instrument (Invitrogen).
Generation and analysis of array- and HTS-based data
Illumina450K arrays were processed according to the manufacturer's instructions using 500 ng of DNA. The data were quantile normalized and resulting beta values were used in downstream analyses. MeDIP-seq libraries were prepared using a modified version of the protocol described in Reference 13 and sequenced on an Illumina GAIIx instrument (v4 chemistry). One lane of 36-bp paired-end sequencing was performed for each MeDIP-seq library. A detailed description is provided in the Supplemental Methods. MeDIP-seq reads were aligned and processed using bwa 0.5.9 (Li et al. 2009), samtools 0.1.7 (Li and Durbin 2009), and custom scripts (available upon request). After alignment and deduplication, we selected all read pairs with a mapping score ≥10. Within each group of samples (Guthrie cards and fresh blood) we calculated histograms of read-pair spacings (insert sizes), then randomly discarded some reads from each library in order to perfectly match the insert-size distributions within the group. We then counted numbers of read pairs overlapping 500-bp windows centered around the target CpG site of each probe on the Illumina450K array. It is worth noting that we did not perform DMR calling per se on the MeDIP-seq data, but rather asked whether the difference between read counts in the two samples was positive or negative. So, read/tag depth only affects agreement score to the extent that signal/noise ratio will tend to be higher in a region with high read depths. Since MeDIP enrichment efficiency depends on the number of meCpGs per fragment, this will tend to be higher when methylation occurs in the context of CpG dense regions. Illumina Omni2.5S arrays (www.illumina.com) were processed according to the manufacturer's instructions using 200 ng of Guthrie card DNA.
Statistical analyses
For all correlation analyses among the different methylomic data sets, Pearson's correlation coefficient was selected as it is a familiar descriptive measure of the similarity between two quantitative data sets and has been previously used in the context of DNA methylomics (Down et al. 2008).
Processing of HEP data
HEP bisulfite data for sperm, CD4+, and CD8+ T-cells were downloaded from the website. This includes amplicon coordinates (NCBI34) and methylation ratios for each CpG covered by each bisulfite PCR sequencing read of the HEP data set. Since some amplicons have low coverage, we selected only those amplicons which, for each of CD4+, CD8+, and Sperm, have at least two reads of data, and have coverage for at least five separate CpG sites. Also, to avoid double counting (i.e., where two HEP amplicons overlapped in our data set) we excluded the smaller of the overlapping amplicons from further analyses. For each amplicon that fulfilled these criteria, we took the mean of all CpG methylation ratios for each cell type. As an additional quality control measure (and also to exclude some HEP amplicons that are highly variable between different blood cell types) we discarded amplicons with a >10% methylation difference between CD4+ and CD8+ cells. We then took the mean of the CD4+ and CD8+ methylation ratios to give a combined “Blood” methylation value.
Additional methods
Detailed methodology is described in the Supplemental Methods.
Data access
The raw array and sequencing data from this study have been deposited in the NCBI Gene Expression Omnibus (GEO) (http://www.ncbi.nlm.nih.gov/geo/) under accession no. GSE38128.
Acknowledgments
We thank the midwives at Malmö University Hospital, Sweden, for their help in collecting cord blood and especially the participating mothers. This work was supported by the Knut and Alice Wallenberg Foundation. We acknowledge coinvestigators in the DiPiS study: C. Andersson, B. Lindberg, B. Lernmark, A. Carlsson, E. Cederwall, K. Larsson, J. Neiderud, B. Jönsson, S.A. Ivarsson, and H.E. Larsson. The DiPiS study was supported by the Swedish Research Council (K2011-54X-15312-07-6) and the Skåne County Council for Research and Development. V.K.R., C.G., and R.D.L. are supported by the BBSRC, UK (BB/H012494/1). R.D.L. is supported by Juvenile Diabetes Research Foundation International (JDRFI Award 5-2011-145). S.V.R. and G.C.E. are funded by the Multiple Sclerosis Society of the United Kingdom. S.V.R. and G.G. are funded by the Medical Research Council, United Kingdom (G0801976). V.K.R., R.D.L., A.L., and B.O.B. are supported by EU-FP7 “BLUEPRINT.” R.D.L. was also supported by grants from the JDRF (nPOD: 25-2010-703) and Diabetes UK (10/0004107).
Footnotes
[Supplemental material is available for this article.]
Article published online before print. Article, supplemental material, and publication date are at http://www.genome.org/cgi/doi/10.1101/gr.134304.111.
References
- Bell JT, Pai AA, Pickrell JK, Gaffney DJ, Pique-Regi R, Degner JF, Gilad Y, Pritchard JK 2011. DNA methylation patterns associate with genetic and gene expression variation in HapMap cell lines. Genome Biol 12: R10 doi: 10.1186/gb-2011-12-1-r10 [DOI] [PMC free article] [PubMed] [Google Scholar]
- Bibikova M, Barnes B, Tsan C, Ho V, Klotzie B, Le JM, Delano D, Zhang L, Schroth GP, Gunderson KL, et al. 2011. High density DNA methylation array with single CpG site resolution. Genomics 98: 288–295 [DOI] [PubMed] [Google Scholar]
- Down TA, Rakyan VK, Turner DJ, Flicek P, Li H, Kulesha E, Gräf S, Johnson N, Herrero J, Tomazou EM, et al. 2008. A Bayesian deconvolution strategy for immunoprecipitation-based DNA methylome analysis. Nat Biotechnol 26: 779–785 [DOI] [PMC free article] [PubMed] [Google Scholar]
- Dubois PC, Trynka G, Franke L, Hunt KA, Romanos J, Curtotti A, Zhemakova A, Heap GA, Adány R, Aromaa A, et al. 2010. Multiple common variants for celiac disease influencing immune gene expression. Nat Genet 42: 295–302 [DOI] [PMC free article] [PubMed] [Google Scholar]
- Eckhardt F, Lewin J, Cortese R, Rakyan VK, Attwood J, Burger M, Burton J, Cox TV, Davies R, Down TA, et al. 2006. DNA methylation profiling of human chromosomes 6, 20 and 22. Nat Genet 38: 1378–1385 [DOI] [PMC free article] [PubMed] [Google Scholar]
- Feinberg AP, Irizarry RA 2010. Evolution in health and medicine Sackler colloquium: Stochastic epigenetic variation as a driving force of development, evolutionary adaptation, and disease. Proc Natl Acad Sci 1: 1757–1764 [DOI] [PMC free article] [PubMed] [Google Scholar]
- Fraga MF, Ballestar E, Paz MF, Ropero S, Setien F, Ballestar ML, Heine-Suñer D, Ciqudosa JC, Urioste M, Benitez J, et al. 2005. Epigenetic differences arise during the lifetime of monozygotic twins. Proc Natl Acad Sci 102: 10604–10609 [DOI] [PMC free article] [PubMed] [Google Scholar]
- Guthrie R, Susi A 1963. A simple phenylalanine method for detecting phenylketonuria in large populations of newborn infants. Pediatrics 32: 338–343 [PubMed] [Google Scholar]
- Heijmans BT, Tobi EW, Stein AD, Putter H, Blauw GJ, Susser ES, Siagboom PE, Lumey LH 2008. Persistent epigenetic differences associated with prenatal exposure to famine in humans. Proc Natl Acad Sci 105: 17046–17049 [DOI] [PMC free article] [PubMed] [Google Scholar]
- Hughes KR, Sablitzky F, Mahida YR 2011. Expression profiling of Wnt family of genes in normal and inflammatory bowel disease primary human intestinal myofibroblasts and normal human colonic crypt epithelial cells. Inflamm Bowel Dis 17: 213–220 [DOI] [PubMed] [Google Scholar]
- Larsson K, Elding-Larsson H, Cederwall E, Kockum K, Neiderud J, Siöbiad S, Lindberg B, Lernmark B, Cilio C, Ivasson SA, et al. 2004. Genetic and perinatal factors as risk for childhood type 1 diabetes. Diabetes Metab Res Rev 20: 429–437 [DOI] [PubMed] [Google Scholar]
- Li H, Durbin R 2009. Fast and accurate short read alignment with Burrows-Wheeler transform. Bioinformatics 25: 1754–1760 [DOI] [PMC free article] [PubMed] [Google Scholar]
- Li H, Handsaker B, Wysoker A, Fennell T, Ruan J, Horner N, Marth G, Abecasis G, Durbin R, 1000 Genome Project Data Processing Subgroup 2009. The Sequence Alignment/Map format and SAMtools. Bioinformatics 25: 2078–2079 [DOI] [PMC free article] [PubMed] [Google Scholar]
- Morgan HD, Sutherland HG, Martin DI, Whitelaw E 1999. Epigenetic inheritance at the agouti locus in the mouse. Nat Genet 23: 314–318 [DOI] [PubMed] [Google Scholar]
- Petronis A 2010. Epigenetics as a unifying principle in the aetiology of complex traits and diseases. Nature 465: 721–727 [DOI] [PubMed] [Google Scholar]
- Pollitt RJ 2009. Newborn blood spot screening: New opportunities, old problems. J Inherit Metab Dis 32: 395–399 [DOI] [PubMed] [Google Scholar]
- Rakyan VK, Chong S, Champ ME, Cuthbert PC, Morgan HD, Luu KV, Whitelaw E 2003. Transgenerational inheritance of epigenetic states at the murine AxinFu allele occurs after maternal and paternal transmission. Proc Natl Acad Sci 100: 2538–2543 [DOI] [PMC free article] [PubMed] [Google Scholar]
- Rakyan VK, Down TA, Balding DJ, Beck S 2011. Epigenome-wide association studies for common human diseases. Nat Rev Genet 12: 529–541 [DOI] [PMC free article] [PubMed] [Google Scholar]
- Sandoval J, Heyn H, Moran S, Serra-Musach J, Pujana MA, Bibikova M, Esteller M 2011. Validation of a DNA methylation microarray for 450,000 CpG sites in the human genome. Epigenetics 6: 692–702 [DOI] [PubMed] [Google Scholar]
- Warner MJ, Ozanne SE 2010. Mechanisms involved in the developmental programming of adulthood disease. Biochem J 427: 333–347 [DOI] [PubMed] [Google Scholar]
- Waterland RA, Kellermayer R, Laritsky E, Ravco-Soion P, Harris RA, Travisano M, Zhang W, Torskaya MS, Zhang J, Shen L, et al. 2010. Season of conception in rural gambia affects DNA methylation at putative human metastable epialleles. PLoS Genet 6: e1001252.doi: 10.1371/journal.gen.1001252 [DOI] [PMC free article] [PubMed] [Google Scholar]
- Weber M, Davies JJ, Wittig D, Oakeley EJ, Haase M, Lam WL, Schübeler D 2005. Chromosome-wide and promoter-specific analyses identify sites of differential DNA methylation in normal and transformed human cells. Nat Genet 37: 853–862 [DOI] [PubMed] [Google Scholar]