

Abstract
Endogenous estrogens that are synthesized in the body impact gene regulation by activating estrogen receptors in diverse cell types. Exogenous compounds that have estrogenic properties can also be found circulating in the blood in both children and adults. The genome-wide impact of these environmental estrogens on gene regulation is unclear. To obtain an integrated view of gene regulation in response to environmental and endogenous estrogens on a genome-wide scale, we performed ChIP-seq to identify estrogen receptor 1 (ESR1; previously estrogen receptor α) binding sites, and RNA-seq in endometrial cancer cells exposed to bisphenol A (BPA; found in plastics), genistein (GEN; found in soybean), or 17β-estradiol (E2; an endogenous estrogen). GEN and BPA treatment induces thousands of ESR1 binding sites and >50 gene expression changes, representing a subset of E2-induced gene regulation changes. Genes affected by E2 were highly enriched for ribosome-associated proteins; however, GEN and BPA failed to regulate most ribosome-associated proteins and instead enriched for transporters of carboxylic acids. Treatment-dependent changes in gene expression were associated with treatment-dependent ESR1 binding sites, with the exception that many genes up-regulated by E2 harbored a BPA-induced ESR1 binding site but failed to show any expression change after BPA treatment. GEN and BPA exhibited a similar relationship to E2 in the breast cancer line T-47D, where cell type specificity played a much larger role than treatment specificity. Overall, both environmental estrogens clearly regulate gene expression through ESR1 on a genome-wide scale, although with lower potency resulting in less ESR1 binding sites and less gene expression changes compared to the endogenous estrogen, E2.
Endogenous estrogens are physiologically important signaling molecules that can vary in concentration by an order of magnitude within a reproductive female. Despite such large fluctuations, estrogens play pivotal and diverse roles in many tissues. In addition to endogenous estrogens, foreign estrogenic compounds can be found in the environment as well as at high doses in many people's blood streams (Grace et al. 2004; Jeng et al. 2010), providing the opportunity for these exogenous compounds to alter estrogen signaling in a variety of cell types.
Epidemiological studies suggest that exposure to environmental estrogens affects cancer rates (Ardies and Dees 1998) and impacts the age of puberty onset in young women (Aksglaede et al. 2009). Two compounds of particular interest due to their abundance are bisphenol A (BPA), used in the construction of polycarbonate plastics as well as epoxy resins found in water bottles, food containers, and dental fillings, and genistein (GEN), a prevalent isoflavone found in soybean. Both GEN and BPA can be observed at high levels (>40 μM) in circulating serum (Holder et al. 1999; Schonfelder et al. 2002), suggesting that these compounds have the opportunity to alter estrogen signaling and gene regulation through estrogen receptors.
Observations in animal models have shown that both GEN and BPA can have a direct impact on development and cancer progression. Prenatal exposure to both GEN and BPA causes an acceleration in puberty onset (Nikaido et al. 2004) and desensitizes tissues in adult animals to the endogenous estrogen, 17β-estradiol (E2) (Woodruff and Walker 2008; Molzberger et al. 2011). BPA exposure increases the risk of breast cancer in animal models (Weber Lozada and Keri 2011), while dietary GEN is able to block tamoxifen-induced growth inhibition of breast tumors (Du et al. 2012).
While there are clear physiological effects of xenoestrogen exposure, an integrated molecular picture detailing how environmental estrogens act in combination with estrogen receptor 1 (ESR1; previously estrogen receptor α) to impact gene regulation remains to be uncovered. GEN, along with some other environmental estrogens, exhibits binding affinities for purified ESR1 that are similar to E2 (Kuiper et al. 1998) and has been shown to induce ESR1 binding at particular transcriptional promoters (Chang et al. 2008). BPA exposure has been shown to induce some of the gene expression changes that are also observed following treatment with E2 (Hess-Wilson et al. 2006, 2007), while eliciting some distinct gene expression changes (Singleton et al. 2006). To appreciate the full impact of these exogenous chemicals on gene regulation, an integrated approach that includes the investigation of genome-wide changes in ESR1 binding and gene expression caused by environmental estrogen exposure in multiple cell types is needed.
To determine the gene regulatory consequences of treatment with exogenous and endogenous estrogens, we exposed endometrial cancer cells to GEN, BPA, or E2 and measured ESR1 binding and gene expression changes. We found that GEN and BPA cause a distinct set of transcriptional responses that are observed after E2 treatment. Similar patterns were also observed in breast cancer cells, which exhibited very different gene regulatory responses to estrogens but maintained the same relationship between E2, GEN, and BPA. Importantly, BPA induced a small number of gene expression changes, yet influenced E2-dependent gene expression, suggesting a mechanism whereby endogenous estrogen signaling is altered in the presence of environmental estrogens.
Results
BPA and GEN promote ESR1 binding to more than 1000 genomic loci
The genomic pathway of estrogen signaling consists of estrogen receptors binding to genomic loci and regulating transcription. To determine the impact that environmental estrogens have on the genomic pathway, we used ChIP-seq to identify sites of occupancy for ESR1 following treatment with GEN and BPA for 1 h. We also measured binding of ESR1 after 1 h of E2 treatment to compare the effects of environmental estrogens to those of an endogenous estrogen. Using 1-h DMSO treatment followed by ChIP-seq targeting ESR1 as a vehicle control, we used MACS (Zhang et al. 2008) to discover ESR1 binding sites induced by each compound in two independent biological replicates of the endometrial cancer cell line, ECC-1, which proliferates in response to E2 exposure (Castro-Rivera et al. 1999). For E2, GEN, and BPA, only sites that were replicated in each experiment were analyzed further.
There were reproducible differences in the number of ESR1 binding sites detected after treatment with each chemical. There were 8622 ESR1-bound sites induced by E2, half (4910) as many sites induced by GEN, and one-fifth (1471) as many sites induced by BPA (Table 1). This is the first evidence that BPA and GEN exposure causes ESR1 to bind thousands of sites across the genome. To determine, relative to E2, whether GEN and BPA induction caused ESR1 to bind to distinct sites, we analyzed the overlap of ESR1 binding sites associated with each compound. Almost all of the sites bound after GEN and BPA treatment were also bound after E2 treatment, with 93.6% of GEN-induced sites and 95.2% of BPA-induced sites overlapping with E2-induced sites.
Table 1.
Number of ESR1 binding sites and overlap
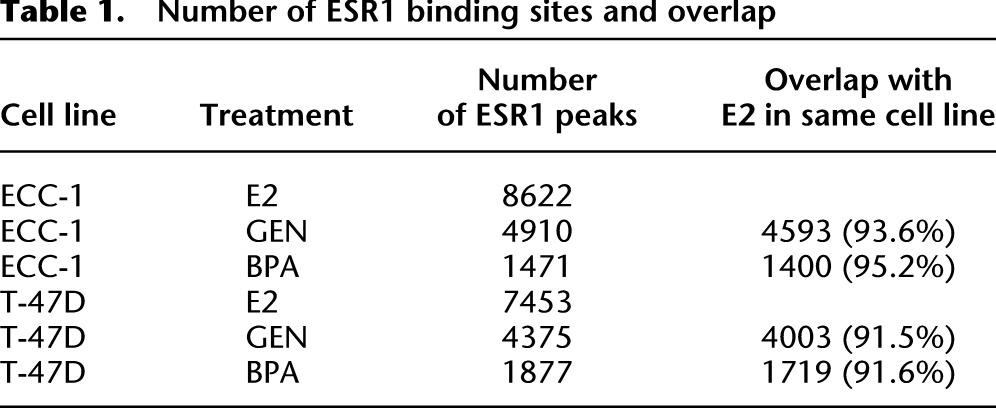
Figure 1, A and B, shows two prototypical sites in which ESR1 binding is induced by all three ligands. The overall ESR1 binding signal after E2 induction is greater than the signal after GEN induction, which is greater than the signal after BPA induction. To examine the quantitative differences in ESR1 binding induced by different compounds in more detail, we compared ESR1 binding signal strength, calculated as the number of sequence reads in a binding site per million aligned reads (RPM), for every binding site in each ChIP experiment. For example, the signal strengths for E2, GEN, BPA, and DMSO of the binding site shown in Figure 1A are 21.5, 13.2, 4.1, and 0.15 RPM. Figure 1C displays the signal strengths for all E2-induced ESR1 binding sites. We found that the strength of ESR1 binding after E2 treatment was very similar between biological replicates (r > 0.85). We also found that the strongest signal binding sites after E2 induction had the strongest signal after GEN and BPA induction (r > 0.8), with GEN-induced sites averaging 1.66-fold lower signal and BPA-induced sites averaging 5.1-fold lower signal compared to E2-induced sites.
Figure 1.

ESR1 binding is induced by GEN and BPA. Examples of ESR1 binding induced by E2, GEN, BPA, and DMSO near the promoters of GREB1 (A) and JUND (B) in ECC-1 are shown. The height of the orange graph represents number of reads per 1 million total reads. (C) Binding site signal strength is plotted for each binding site with E2-induced signal strength (replicate 1) on the x-axis vs. E2 (black; replicate 2), GEN (green; replicate 1), and BPA (red; replicate 1) signal strength on the y-axis for ECC-1.
To identify differences in ESR1 binding sites induced by each compound, we split ESR1 binding sites into three groups: sites induced by E2 only, sites induced by E2 and GEN (E2+GEN), and sites induced by all three compounds (E2+GEN+BPA). The distribution of ESR1 binding sites relative to gene features is nearly identical for each group (Fig. 2A). The majority of ESR1 binding sites are found in intergenic regions at least 2 kb away from known genes. When compared to the genomic background, each group of binding sites was enriched for regions near transcription start sites: promoters, first exons, and first introns (P < 1 × 10⁻⁶; χ2 test). A common sequence motif was found in all three binding site groups, which matches the canonical estrogen response element (ERE) (Fig. 2B). We analyzed each binding site for the best match to the motif and estimated a relative affinity of ESR1 for the site (Hertz and Stormo 1999). Figure 2C shows that each set of binding sites is enriched for strong matches to the ESR1 motif compared to randomly chosen sequences. ESR1 sites bound after all three treatments as well as sites bound after GEN and E2 treatment have significantly higher scoring matches than sites induced by E2 only (P < 10−4; Wilcoxon test). Overall, ESR1 binding sites induced by each environmental estrogen represent a subset of the sites induced by the endogenous estrogen, E2, with GEN- and BPA-induced sites exhibiting an enrichment for strong matches to an ERE and higher signal after E2 treatment.
Figure 2.

Properties of E2-, GEN-, and BPA-induced ESR1 binding sites. (A) The proportion of genomic locations of ESR1 binding sites with respect to genes is displayed. The genomic background is also shown. (B) The most prevalent sequence motif found in ESR1 binding sites found after E2-, GEN-, or BPA-treatment matches the canonical estrogen response element (ERE). (C) Distributions of ERE motif strength, measured as log relative affinity compared to highest possible affinity site, are shown as boxplots. Boxes cover 25th to 75th percentiles, and the whiskers define the 95% confidence interval.
E2, GEN, and BPA cause overlapping gene expression responses
Given that both BPA and GEN cause ESR1 to bind many sites across the genome, we sought to determine changes in gene expression that each environmental estrogen induced. We treated ECC-1 with E2, GEN, BPA, or DMSO (as a control) for 8 h, a time point at which an even representation of ESR1 binding sites at up- and down-regulated genes has been observed (Carroll et al. 2006). We then performed RNA-seq using the Tn-RNA-seq protocol that we recently developed (Gertz et al. 2012), obtaining more than 40 million paired-end 50-bp reads for each sample. Biological replicates were performed for each treatment in order to determine significantly affected transcripts (see Methods).
In total, more than 900 genes were significantly affected by E2 treatment, with a false discovery rate of 5% (see Supplemental Tables S1 and S2 for gene expression data). In response to E2 exposure, 547 genes were up-regulated and 440 genes were down regulated. This includes the down-regulation of one long intergenic noncoding (LINC) RNA, LINC00152, as well as up-regulation of one microRNA precursor, miR-663a, thought to play a role in nasopharyngeal carcinoma through the repression of CDNK1A (Yi et al. 2012). Genes whose expression is affected by E2 treatment are highly enriched in ribosomal-associated proteins that play a role in translation (Supplemental Table S3), which is consistent with the proliferative effect of E2 on ECC-1.
Congruent with the observation that GEN and BPA induce fewer ESR1 binding sites than E2, both compounds affect a smaller number of genes in comparison to E2. Treatment with GEN caused up-regulation of 207 genes and down-regulation of 49 genes. While 54 genes were up-regulated after BPA exposure, only two genes were down-regulated. Unlike transcripts that were affected by E2, genes induced by GEN and BPA are not enriched for translation and ribosome function. In both cases, genes involved in transport of carboxylic acids were overrepresented (P < 2.51 × 10⁻⁵). This includes the transport of amino acids, sialic acid, prostaglandins, and other mono-, di-, and tricarboxylic acids.
The genes whose expression was influenced by GEN or BPA exposure represent a subset of the genes impacted by E2 treatment. Of the genes that were up-regulated by GEN and BPA, 94.2% and 94.4% were also up-regulated by E2, respectively (Fig. 3A). GEN and BPA down-regulated genes overlap with E2 down-regulated genes at a rate of 80% and 100%, respectively. There were no genes that are affected by E2 and regulated in the opposite direction by GEN or BPA. The high overlap between genes affected by E2, GEN, and BPA indicates there is some functional redundancy between these compounds, with the environmental estrogens acting on a subset of genes influenced by E2 that is depleted for ribosomal function and enriched for carboxylic acid transport. A small set of genes is significantly impacted by GEN or BPA and not E2; however, each of these genes responds to E2 in the same manner as GEN or BPA at levels that are just below significance.
Figure 3.

Gene expression changes in response to GEN and BPA. (A) The overlap between genes up-regulated (left panel) and genes down-regulated (right panel) by E2, GEN, and BPA. (B) A scatter plot shows the relative magnitude of gene expression changes with log2 of the fold change induced by E2 on the x-axis, and log2 of the fold change induced by GEN (green) and BPA (red) on the y-axis. The black line represents equal magnitude. (C) Examples of gene expression measurements in DMSO, E2, GEN, and BPA are shown for four representative genes. Error bars represent s.e.m.
BPA and GEN also induce smaller magnitude gene expression changes in comparison to E2. On average, gene expression changes brought on by GEN are 10% smaller than changes caused by E2 treatment (P < 2.2 × 10⁻¹⁶; Wilcoxon test), and expression changes induced by BPA are 25% smaller than E2 changes (P < 2.2 × 10⁻¹⁶; Wilcoxon test) (Fig. 3B). Figure 3C shows some prototypical examples of genes significantly affected by E2. TGFA, a gene known to be regulated by E2 (Fontana et al. 1992) and overexpressed in endometrial cancer (Niikura et al. 1996), is up-regulated by E2, GEN, and BPA. RRP1B, up-regulated only by E2, is thought to play a role in ribosomal RNA processing and may be involved in metastatic potential (Crawford et al. 2007). SLC22A5, a carnitine transporter associated with autoimmune diseases (Peltekova et al. 2004; Santiago et al. 2006), is significantly up-regulated by E2 only but shows similar changes after GEN and BPA treatment. IGFBP3, a modulator of insulin-like growth factor (Firth et al. 1998) and a direct target of androgen receptor (Peng et al. 2006), is significantly down-regulated by E2 and GEN; however, BPA down-regulates IGFBP3 to a level that does not meet genome-wide significance. The lower-signal ESR1 binding sites and lower-magnitude gene expression changes induced by BPA and GEN, compared to E2, suggest that these environmental estrogens are less potent inducers of gene regulation through ESR1.
Many genes bound after BPA or GEN treatment are regulated by E2 but not by BPA or GEN
Based on the overlap of both ESR1 binding sites and gene expression changes induced by E2, GEN, and BPA, we sought to quantify the relationship between ESR1 binding and gene expression changes after exposure to environmental estrogens. We partitioned both genes and ESR1-bound sites into three groups: E2 only, E2+GEN, and E2+GEN+BPA. A breakdown of the number of genes and binding sites can be found in Supplemental Table S4. We analyzed the genes in each group and whether they had an associated ESR1 binding site (within 50 kb of the transcription start site). Figure 4 shows the number of genes in each group that can be explained by nearby ESR1 binding sites. As expected, the highest association was found when the group of genes and the group of binding sites matched. For example, 63% of E2+GEN+BPA genes had an associated E2+GEN+BPA binding site, compared to 7.5% of E2+GEN+BPA genes being associated with E2 only binding sites or 11% being associated with E2+GEN binding sites.
Figure 4.

Association between ESR1 binding and gene expression changes in response to E2, GEN, and BPA. The number of genes in each group that are within 50 kb of ESR1 binding sites (also broken out by group) for up-regulated (A) and down-regulated (B) genes. (C) ChIP-seq signal and gene expression levels after E2-, GEN-, BPA-, and DMSO-treatment are shown for two representative genes. The height of the orange graph represents the normalized number of reads for each ChIP-seq experiment. Error bars represent s.e.m.
There are a large number of genes associated with a BPA-induced ESR1 binding site (E2+GEN+BPA) which are not regulated by BPA treatment (E2 only or E2+GEN). In total, 43 genes up-regulated by E2, and not by BPA, had an associated E2+GEN+BPA ESR1 binding site. MAP4K3, a nutrient sensitive regulator of mTOR signaling (Findlay et al. 2007), is up-regulated by E2 and not by BPA; however, BPA treatment as well as E2 treatment causes ESR1 to bind a site 20 kb downstream from the transcription start site (Fig. 4C). GEN treatment can also induce ESR1 binding without causing a significant gene expression response, as 53 genes are associated with an E2+GEN or E2+GEN+BPA ESR1 binding site without GEN affecting their gene expression. SKIL, a negative regulator of TGFβ signaling (Lamouille and Derynck 2009), harbors three GEN-induced ESR1 sites within 20 kb of the transcription start site but does not respond to GEN treatment (Fig. 4C). The inability of BPA and GEN to produce gene expression responses, while causing ESR1 to bind nearby sites, suggests that BPA- and GEN-induced ESR1 binding sites are less potent mediators of gene regulation.
Gene expression changes are modulated by continuous exposure to BPA or E2
To explore possible interactions between exogenous and endogenous estrogens, we focused on how E2 and BPA influence gene regulation in combination. We grew ECC-1 with continual exposure to either 100 nM BPA, 5 pM E2, 10 nM E2, or DMSO for 5 d. We then performed short-term treatment of cells with BPA or E2 and measured relative changes in gene expression for a representative panel of genes (Fig. 5). Continual treatment with 10 nM E2 is meant to mimic adult levels of estrogen, and the continual treatment with 5 pM is meant to mimic prepubertal levels of estrogen (Klein et al. 1999).
Figure 5.

Long-term exposure to BPA and E2 alters gene expression response. (A) Relative expression measurements are shown for four genes in ECC-1 after short-term BPA exposure following 5 d of treatment with DMSO, 5 pM E2, or 10 nM E2. (B) Relative expression measurements are shown for four genes in ECC-1 after short-term treatment with 10 nM E2 following 5 d of treatment with DMSO, 5 pM E2, or 5 pM E2 plus 100 nM BPA. Error bars represent s.e.m.
We found that continuous exposure to E2 influences the gene expression response induced by BPA. Figure 5A shows that the expression of TGFA, ZNF608, DOK7, and SLC22A5 are all significantly affected by short-term exposure to BPA when cells are grown continuously with only DMSO. The expression changes observed in this assay are very similar to the results obtained with RNA-seq (r = 0.85). When ECC-1 cells are continuously exposed to prepubertal levels of E2, BPA-induced expression changes remain significant. However, when cells are pretreated with adult levels of E2, short-term BPA exposure does not change gene expression. These results indicate that chronic adult E2 exposure blunts the BPA-induced gene expression changes. By contrast, preadolescent levels of E2 do not diminish gene expression changes mediated by acute BPA treatment.
Interestingly, in the context of chronic exposure to BPA, we found attenuation in the gene expression changes induced by E2. Adult levels of E2 were able to induce significant gene expression changes for TGFA, ZNF608, DOK7, and SLC22A5 in cells with long-term exposure to preadolescent levels of E2, whereas in cells pretreated with BPA, E2 did not elicit a significant change in the expression of TGFA, ZNF608, and SLC22A5 (Fig. 5B). The fold change of DOK7 expression in response to adult levels of E2 was reduced by half with continuous exposure to BPA. Long-term exposure to BPA enhanced basal E2-indpendent gene expression of TGFA, ZNF608, SLC22A5, and to a lesser extent, DOK7, to levels similar to those observed upon E2 treatment. This suggests that long-term BPA exposure influences E2-dependent gene expression.
To examine whether the impact of long-term exposure to BPA on gene expression is ESR1-dependent, we treated ECC-1 cells with BPA and the ESR1 antagonist ICI 182,780 (Fulvestrant) and measured the expression of TGFA, ZNF608, SLC22A5, and DOK7 (Supplemental Fig. S1). We found that for each gene, the expression changes driven by long-term BPA exposure are lost when cells are treated with ICI. These results indicate that long-term BPA treatment acts through ESR1 to influence gene expression.
BPA and GEN exhibit similar gene regulation patterns in T-47D
To determine the impact of environmental estrogens on ESR1 signaling in another cell type, we performed ChIP-seq and RNA-seq after DMSO, E2, GEN, or BPA treatment in the breast cancer cell line T-47D. We found a striking amount of cell type specificity in ESR1 binding and gene expression changes induced by E2, GEN, and BPA. While both cell lines had a similar number of ESR1 binding sites, 7453 in T-47D and 8622 in ECC-1, only 1446 of the ESR1-bound sites overlap (19% of T-47D bound sites) (Fig. 6A). These results indicate that the set of ESR1-bound sites is distinct between endometrial and breast cancer cells, consistent with previous reports indicating high levels of cell type specificity in ESR1 binding (Krum et al. 2008; Hurtado et al. 2011).
Figure 6.

GEN and BPA induce ESR1 binding and expression changes in T-47D. (A) The overlap between E2-induced ESR1 binding sites in ECC-1 and T-47D is displayed. (B) Binding site signal strength is plotted for each binding site with E2-induced signal strength (replicate 1) on the x-axis vs. E2 (black; replicate 2), GEN (green; replicate 1), and BPA (red; replicate 1) signal strength on the y-axis for T-47D. (C) The overlap between genes regulated by E2, GEN, or BPA is shown as a Venn diagram. (D) The number of genes in each group that are within 50 kb of ESR1 binding sites (also broken out by group) is shown for up-regulated genes.
The disparity in ESR1 binding could be due to differences between breast and endometrial cells specifically or to differences between cells regardless of type. To address this question, we compared, by ChIP-seq, the sites bound by ESR1 identified in ECC-1 and T-47D to ESR1 binding sites found in MCF-7, a breast cancer cell line (Welboren et al. 2009). Of the 10,196 ESR1 binding sites identified in MCF-7 cells, T-47D shares 3037 (41% of T-47D binding sites) and ECC-1 shares 1798 (21% of ECC-1 binding sites). The two breast cancer cell lines, MCF-7 and T-47D, are twice as similar to each other than they are to the endometrial cancer line, indicating that at least these two breast cancer cell lines share some common genomic traits that result in ESR1 binding to similar locations (Supplemental Fig. S2). While the breast cancer cell lines are more similar to each other, there remain 4022 (53.9%) ESR1 binding sites specific to T-47D, suggesting that cell-autonomous regulation of ESR1 binding also occurs.
Very similar relationships between ESR1 binding after treatment with E2, GEN, and BPA were observed in ECC-1 and T-47D (Table 1). E2 induced twice as many ESR1 binding sites as GEN and five times as many sites as BPA in T-47D. Binding sites induced by GEN and BPA overlapped highly (>91%) with E2 induced sites, indicating that BPA and GEN treatment causes binding of ESR1 to a subset of the sites bound following E2 treatment. In fact, GEN- and BPA-induced ESR1 binding matched much more closely to E2-induced sites in the same cell line than GEN- or BPA-induced sites in the other cell line (∼90% vs. ∼20%). Consistent with data from ECC-1, ESR1 binding site signal strengths in T-47D were strongest after E2 treatment, lower after GEN treatment, and lowest after BPA treatment (Fig. 6B). In both ECC-1 and T-47D, GEN and BPA induced a smaller number of ESR1 binding sites, compared to E2 but maintained a high level of cell type specificity.
FOXA1 and GATA3 are transcription factors that have been shown to be important for ESR1 binding and enhancer activity in breast cancer cells (Kong et al. 2011). To determine if ESR1 binding sites induced by E2, GEN, and BPA were more or less likely to co-occur with these factors, we mapped FOXA1 and GATA3 binding by ChIP-seq in untreated (DMSO control) T-47D cells. We found a significantly higher percentage of E2+GEN+BPA (39%) or E2+GEN (32.7%) ESR1 sites co-occurring with FOXA1 and GATA3 compared to E2-only ESR1 sites (26%) (P < 2.2 × 10⁻¹⁶ and P < 2.7 × 10⁻¹⁰, respectively; Fisher's exact test). The higher overlap between ESR1 sites, found after BPA and GEN treatment, and FOXA1 and GATA3 sites suggest that binding of ESR1 induced by GEN and BPA may have higher dependency on cofactors.
In a pattern similar to ECC-1, GEN and BPA caused a subset of the gene expression changes induced by E2 in T-47D. E2 treatment led to the up-regulation of 443 genes and the down-regulation of 168 genes, while GEN up-regulated 106 genes and down-regulated 14 genes (Fig. 6C). BPA only affected one gene, up-regulating CXCL12. CXCL12, a chemokine that can increase metastatic potential (Muller et al. 2001), was up-regulated by E2 and GEN as well. We observed high overlap between GEN- and E2-affected genes; every gene that was up-regulated by GEN in T-47D was also up-regulated by E2, and 10 out of 14 genes down-regulated after GEN treatment were also down-regulated by E2. Genes affected by both GEN and E2 were enriched for tissue development (P < 7.53 × 10⁻⁴), and genes affected by E2 were enriched in ribosomal processes and translation (P < 2.50 × 10⁻²⁴). This finding is consistent with ECC-1 and the increase in proliferation that has been observed after E2 treatment in T-47D (Chalbos et al. 1982).
While E2 regulates ribosomal genes in both ECC-1 and T-47D, the overlap between genes regulated by E2 in each cell line is small. Consistent with ESR1 binding, gene expression changes induced by each compound were highly cell type-specific. Only 71 up-regulated genes (16% of T-47D up-regulated genes) overlapped between ECC-1 and T-47D; nine genes were down-regulated in both lines (5% of T-47D down-regulated genes). There were 46 genes that changed direction between cell lines, with 39 genes up-regulated in T-47D while being down-regulated in ECC-1, and nine up-regulated in ECC-1 while being down-regulated in T-47D. Of the genes regulated in opposite directions, 10 are ribosomal proteins (P < 5.8 × 10⁻¹⁷); however, most ribosomal proteins are up-regulated in one or both lines.
We analyzed the overlap between gene expression changes and ESR1 binding in T-47D using the same groups described above: E2 only, E2+GEN, and E2+GEN+BPA. We found very similar patterns in T-47D as was observed in ECC-1 (Supplemental Table S4), with each group of genes being enriched for the same group of ESR1 binding sites (Fig. 6D). There were 72 genes that were associated with a BPA-induced ESR1 binding site which showed no expression change after treatment with BPA and a significant expression change after E2 exposure. GEN caused ESR1 binding at 46 E2-affected genes that did not change after GEN treatment. These results are consistent with the hypothesis that BPA- and GEN-induced ESR1 binding events are less potent mediators of gene regulation.
Discussion
By studying exposure of ECC-1 to GEN and BPA, we were able to demonstrate that these compounds induce thousands of ESR1 binding sites. To our knowledge, this is the first genome-wide study of ESR1 binding in response to BPA or GEN treatment. We also found that GEN and BPA change the expression of a subset of genes affected by E2, representing 26% and 6%, respectively. Genes affected by GEN and BPA were more often up-regulated, as <20% were down-regulated. The tendency of GEN and BPA to cause up-regulation as opposed to down-regulation could be the result of different mechanisms. It is possible that ESR1 is more likely to bind coactivators than corepressors when induced by GEN or BPA. GEN and BPA may also be working on a longer time scale, since the majority of early gene expression changes induced by E2 involve up-regulation (Frasor et al. 2003), the gene regulation response caused by GEN and BPA after 8 h may be similar to early changes brought on by E2.
There are many genes that are regulated by E2 only but have nearby ESR1 binding induced by E2, GEN, and BPA. This suggests that environmental estrogen-induced ESR1 is a less potent mediator of gene regulation, possibly a consequence of proportionally less ESR1 binding caused by either lower amounts of activated ESR1 or lower affinity ESR1 binding. The failure of GEN and BPA to cause significant gene expression responses could also be reflective of a failure to recruit coactivators. This hypothesis is consistent with in vitro data showing that BPA- and GEN-liganded ESR1 have 100,000- and 10,000-fold lower relative recruitment of NCOA1 and NCOA2 compared to E2, respectively (Routledge et al. 2000). The lack of recruitment of coactivators to BPA- and GEN-liganded ESR1 may explain the disconnect between ESR1 binding observations and gene expression changes. Overall, there are many more ESR1 binding sites compared to gene expression changes after each treatment, in agreement with previous studies (Cheng et al. 2009; Reddy et al. 2009; Simpson et al. 2012). It is unclear if the extra binding sites represent spurious binding that is unrelated to gene expression or if most genes require multiple long distance binding sites.
Genes impacted by E2 were highly enriched for ribosome-associated proteins, consistent with the observation that estrogen exposure increases uterine ribosome concentration in vivo (Moore and Hamilton 1964). However, GEN and BPA were unable to regulate ribosome-associated genes. This raises the question of the influence that each compound has on proliferation, as making ribosomal proteins is an important step in increasing proliferation. In agreement with this observation, BPA has been reported to have no impact on ECC-1 proliferation at the dose used in our study (Bergeron et al. 1999). Previous studies of GEN's impact on proliferation suggest that intermediate doses, such as the 100 nM concentration that we used, increase proliferation (Hirsch et al. 2007). GEN's failure to up-regulate ribosomal proteins may be due to the time point that we assayed or a difference in the mechanism with which GEN induces proliferation compared to E2. For example, GEN induces the expression of cyclin D2 and AP1 component FOS, which are not affected by BPA and could be responsible for increased cell proliferation.
BPA and E2 seem to desensitize ECC-1 to each other. When BPA was introduced to cells that were already exposed to high levels of E2, there was no effect on gene expression. However, when cells were pretreated with low amounts of E2, similar to prepubertal levels, BPA was able to influence gene expression. Our results suggest that BPA is affecting E2-dependent gene expression in the context of low E2 levels. This is consistent with findings that infants and children, who exhibit low concentrations of E2, are more sensitive to BPA exposure than are adults (Crain et al. 2008; Woodruff and Walker 2008). Long-term treatment with BPA is also able to block gene expression changes brought on by the switch from low to high E2 levels, suggesting that the presence of BPA may augment the molecular response to natural changes in estrogen concentrations.
We also studied the influence of BPA and GEN on gene regulation in a breast cancer cell line, T-47D. In comparing the cell types, we found that E2 caused very different molecular responses in ECC-1 and T-47D, with <20% overlap of ESR1 binding sites and the genes impacted by E2. This is a surprising finding, as E2 induces proliferation in both cell lines (Chalbos et al. 1982; Castro-Rivera et al. 1999), and indicates that diverse gene regulatory responses can result in related phenotypic outcomes. While ECC-1 and T-47D differ substantially in their response to E2, the relationship between E2, GEN, and BPA within a line was consistent. Different cell types exhibited much lower overlap than different estrogens (∼20% vs. ∼90%). The biggest difference in each compound's behavior between cell types was that BPA was only able to induce one significant gene expression change (CXCL12) in T-47D. This observation is surprising since BPA treatment causes 1877 ESR1 binding sites in T-47D and could be due to a T-47D-specific factor that modulates gene expression changes from a BPA-liganded ESR1. The mechanism underlying this lack of gene expression response in a cell type-specific manner is unknown and requires further investigation.
Our results show that physiological concentrations of GEN and BPA induce ESR1 binding but affect gene regulation to a different extent. These differences are consistent between cell types and congruent with the opposite affects that GEN and BPA seem to have on human health. For example, prenatal exposure to BPA is associated with morphological abnormalities, reduced fertility, and higher rates of breast and prostate cancer (Maffini et al. 2006). In contrast to BPA, consumption of GEN is correlated with decreased cancer risk (Adlercreutz 1995). However, early exposure to GEN is thought to delay the onset of puberty (Jacobson-Dickman and Lee 2009) and lead to reduced fertility and underdevelopment of the female reproductive tract (Jefferson et al. 2007). Gene regulatory differences between GEN and BPA may be sufficient to impart distinct physiological characteristics to the cell, or, alternatively, work in combination with other factors to promote physiological differences upon exposure to these environmental estrogens. For example, although neither ECC-1 nor T-47D cells express estrogen receptor 2 (formerly estrogen receptor β) under our culture conditions, estrogen receptor 2 has been shown to be growth-inhibitory, promote differentiation (Korach et al. 1996; Forster et al. 2002; Strom et al. 2004), and has higher affinity for GEN compared to ESR1 (Kuiper et al. 1998). This may explain some of the opposing roles of GEN and BPA in human health. GEN and BPA may also exert their effects through other signaling pathways. BPA has been shown to activate MAPK1 (also known as ERK) kinase (Lee et al. 2008), AKT1 (also known as AKT) kinase, and PIK3CA (also known as PI 3-kinase) (Masuno et al. 2005) in different cell types, while GEN inhibits tyrosine-specific kinases such as EGFR (Akiyama et al. 1987). Understanding how these other mechanisms interact with estrogen signaling pathways will be important in appreciating the impact that environmental estrogens have on human health.
Methods
Cell culture and inductions
We grew both ECC-1 (ATCC CRL-2923) and T-47D (ATCC HTB-133) in RPMI-1640 (Invitrogen) supplemented with 1% penicillin-streptomycin (Invitrogen) and 10% fetal bovine serum (HyClone). Five days before induction, cells were switched to phenol red-free RPMI-1640 supplemented with 1% penicillin-streptomycin and 10% Charcoal/Dextran-treated fetal bovine serum (HyClone). Fresh media was added 1 d before inductions. For ChIP-seq experiments, 6 μL of 5000× concentrated solutions of E2, GEN, and BPA dissolved in DMSO were added to 30 mL media in 150-mm dishes. For the vehicle control, 6 μL DMSO was added to 30 mL of media. For RNA-seq experiments, 3 μL concentrated solution or DMSO was added to 15 mL of media in 100-mm dishes. For qPCR experiments, 10 μL 50× concentrated solution or DMSO was added to 500 μL of media in a single well of a 24-well plate. ICI 182,780 was used at a final concentration of 100 nM.
For chromatin IP, chromatin was harvested by adding formaldehyde to the media to a final concentration of 1% for 10 min. After 10 min, glycine was added to a final concentration of 0.125 M for 5 min. Cells were washed with cold PBS, and then Farnham lysis buffer (5 mM PIPES at pH 8.0, 85 mM KCl, 0.5% NP-40) was added. Cell lysate was then collected with a policeman, and nuclei were collected by centrifugation for 5 min at 1000g. Pelleted nuclei were stored at −80°C.
For RNA samples, a 100-mm dish of cells was lysed with 600 μL Lysis/Binding buffer from an mRNA direct kit (Invitrogen). Lysate was then collected with a policeman and passed through a 20-gauge needle 10 times. Lysate was stored at −80°C.
Chromatin immunoprecipitation and analysis
Chromatin immunoprecipitation and ChIP-seq were performed as previously described (Reddy et al. 2009). The antibodies ERα (HC-20), GATA-3 (HG3-31), and HNF3α/β (C-20) (FOXA1) (Santa Cruz Biotechnology, Inc.) were verified by immunoprecipitation followed by Western blot (data not shown) and were used in ChIP-seq experiments. At least 12 million 36-bp reads were obtained for every replicate, and each ChIP-seq experiment was performed in duplicate.
To determine binding sites, sequences were aligned to the February 2009 (GRCh37/hg19) build of the human genome using ELAND (Illumina). The alignments obtained from ESR1 ChIP-seq libraries of cells induced by E2, GEN, or BPA were compared to sequence alignments obtained from the DMSO induction ChIP-seq libraries in the same cell line using the program MACS (Zhang et al. 2008). FOXA1 and GATA3 ChIP-seq libraries were compared to reverse crosslink input control libraries from T-47D cells. At least 78% of binding sites were shared between ChIP-seq replicates, and only binding sites that were identified in both replicates were used for further analysis. All ChIP-seq data can be accessed through the USCS Genome Browser's site “Transcription Factor Binding Sites by ChIP-seq from ENCODE/HAIB” (http://genome.ucsc.edu/cgi-bin/hgTrackUi?g=wgEncodeHaibTfbs) and through the Gene Expression Omnibus (GEO) accession number GSE32465.
RNA-seq and analysis
Tn-RNA-seq was performed as previously described (Gertz et al. 2012). In brief, mRNA was purified from cell lysate with an mRNA Direct kit (Invitrogen) according to the manufacturer's instructions. Purified mRNA was treated with 2 U DNase I (New England BioLabs) in RSB buffer (1 mM Tris pH 7.4, 1 mM NaCl, 300 nM MgCl2) for 10 min at 37°C. Two μL of 500 mM EDTA pH 8.0 were added, and the reaction was purified using a spin-50 Sephadex column (USA Scientific). Double-stranded cDNA was constructed from the DNase-treated mRNA. Fifty ng cDNA then underwent Nextera tagmentation and PCR. Libraries were constructed with DNA barcodes and pooled as four per lane on an Illumina HiSeq 2000.
We aligned paired-end 50-bp reads to spliced reference transcripts using bowtie (parameters: -n 2 -a -m 10 –X 3000). For each replicate, we obtained at least 30 million reads that aligned to RefSeq transcripts. Reads per kb per million reads (RPKMs) were calculated for each transcript by multiplying the number of aligned reads times 1,000,000 and dividing by the number of aligned reads for the replicate times the size of the transcript (in kb).
We then analyzed RPKMs to find significantly changing genes as previously described (Reddy et al. 2009). Briefly, to account for the fact that lower-expressed genes are more variable between replicates, we used variance stabilization to normalize RPKMs. After variance stabilization, the normalized log ratios fit a normal distribution, and we assigned P-values accordingly. Once P-values were calculated for every transcript, the R package q value (Storey and Tibshirani 2003) was used to calculate false discovery rates, and we used a 5% cutoff to determine significantly changing genes. We performed this analysis comparing DMSO RPKMs to E2, GEN, or BPA in each cell line. To look for significantly enriched GO annotations, we used g:profiler (Reimand et al. 2007).
Motif discovery and annotation
To discover prevalent sequence motifs within the ESR1 binding sites, we searched 50 bp on each side of the peak summit, which was reported by MACS (Zhang et al. 2008). We then used BioProspector (Liu et al. 2001) to perform de novo motif finding and look for sequence motifs with a width of 16 bp. The top five motifs for each ChIP-seq data set all matched the reported sequence motif in Figure 1B. Each peak was annotated with proximity to RefSeq transcripts.
Quantitative PCR
We performed qPCR to determine if long-term exposure to BPA or E2 influenced gene expression responses. To create cDNA, we used a modified version of the SYBR Green Cells-to-CT kit (Life Technologies). We first washed each well twice with PBS, then added 90 μL lysis buffer with DNase I, and incubated at room temperature for 5 min. Five μL stop solution was then added and incubated at room temperature for 2 min. To perform reverse transcription, 22.5 μL lysate was added to 25 μL RT mix and 2.5 μL RT enzyme and incubated at 37°C for 1 h and 95°C for 5 min. For qPCR, 3 μL of the RT reaction was added to 1 μL each of 10 μM primers (see Supplemental Table S5 for primer sequences), 10 μL PCR master mix, and 5 μL water. Biological duplicates were performed for each experiment, and expression measurements were normalized to CTCF expression levels.
Data access
ChIP-seq data can be accessed through the UCSC Genome Browser's site “Transcription Factor Binding Sites by ChIP-seq from ENCODE/HAIB” (http://genome.ucsc.edu/cgi-bin/hgTrackUi?db=hg19&g=wgEncodeHaibTfbs) and through the NCBI Gene Expression Omnibus (GEO) (http://www.ncbi.nlm.nih.gov/geo/) under accession number GSE32465. RNA-seq data can be accessed through the NCBI Gene Expression Omnibus (GEO) under accession number GSE38234.
Acknowledgments
We thank Greg Barsh, Devin Absher, Chris Gunter, Shawn Levy, Barbara Wold, and members of the Myers lab for valuable discussions and contributions. This work was funded by NHGRI ENCODE Grant 5U54HG004576 (to R.M.M.). J.G. was supported by Postdoctoral Fellowship PF-12-028-01-TBE from the American Cancer Society.
Footnotes
[Supplemental material is available for this article.]
Article published online before print. Article, supplemental material, and publication date are at http://www.genome.org/cgi/doi/10.1101/gr.135681.111.
References
- Adlercreutz H 1995. Phytoestrogens: Epidemiology and a possible role in cancer protection. Environ Health Perspect (Suppl 7) 103: 103–112 [DOI] [PMC free article] [PubMed] [Google Scholar]
- Akiyama T, Ishida J, Nakagawa S, Ogawara H, Watanabe S, Itoh N, Shibuya M, Fukami Y 1987. Genistein, a specific inhibitor of tyrosine-specific protein kinases. J Biol Chem 262: 5592–5595 [PubMed] [Google Scholar]
- Aksglaede L, Sorensen K, Petersen JH, Skakkebaek NE, Juul A 2009. Recent decline in age at breast development: The Copenhagen Puberty Study. Pediatrics 123: e932–e939 [DOI] [PubMed] [Google Scholar]
- Ardies CM, Dees C 1998. Xenoestrogens significantly enhance risk for breast cancer during growth and adolescence. Med Hypotheses 50: 457–464 [DOI] [PubMed] [Google Scholar]
- Bergeron RM, Thompson TB, Leonard LS, Pluta L, Gaido KW 1999. Estrogenicity of bisphenol A in a human endometrial carcinoma cell line. Mol Cell Endocrinol 150: 179–187 [DOI] [PubMed] [Google Scholar]
- Carroll JS, Meyer CA, Song J, Li W, Geistlinger TR, Eeckhoute J, Brodsky AS, Keeton EK, Fertuck KC, Hall GF, et al. 2006. Genome-wide analysis of estrogen receptor binding sites. Nat Genet 38: 1289–1297 [DOI] [PubMed] [Google Scholar]
- Castro-Rivera E, Wormke M, Safe S 1999. Estrogen and aryl hydrocarbon responsiveness of ECC-1 endometrial cancer cells. Mol Cell Endocrinol 150: 11–21 [DOI] [PubMed] [Google Scholar]
- Chalbos D, Vignon F, Keydar I, Rochefort H 1982. Estrogens stimulate cell proliferation and induce secretory proteins in a human breast cancer cell line (T47D). J Clin Endocrinol Metab 55: 276–283 [DOI] [PubMed] [Google Scholar]
- Chang EC, Charn TH, Park SH, Helferich WG, Komm B, Katzenellenbogen JA, Katzenellenbogen BS 2008. Estrogen receptors α and β as determinants of gene expression: Influence of ligand, dose, and chromatin binding. Mol Endocrinol 22: 1032–1043 [DOI] [PMC free article] [PubMed] [Google Scholar]
- Cheng Y, Wu W, Kumar SA, Yu D, Deng W, Tripic T, King DC, Chen KB, Zhang Y, Drautz D, et al. 2009. Erythroid GATA1 function revealed by genome-wide analysis of transcription factor occupancy, histone modifications, and mRNA expression. Genome Res 19: 2172–2184 [DOI] [PMC free article] [PubMed] [Google Scholar]
- Crain DA, Janssen SJ, Edwards TM, Heindel J, Ho SM, Hunt P, Iguchi T, Juul A, McLachlan JA, Schwartz J, et al. 2008. Female reproductive disorders: The roles of endocrine-disrupting compounds and developmental timing. Fertil Steril 90: 911–940 [DOI] [PMC free article] [PubMed] [Google Scholar]
- Crawford NP, Qian X, Ziogas A, Papageorge AG, Boersma BJ, Walker RC, Lukes L, Rowe WL, Zhang J, Ambs S, et al. 2007. Rrp1b, a new candidate susceptibility gene for breast cancer progression and metastasis. PLoS Genet 3: e214 doi: 10.1371/journal.pgen.0030214 [DOI] [PMC free article] [PubMed] [Google Scholar]
- Du M, Yang X, Hartman JA, Cooke PS, Doerge DR, Ju YH, Helferich WG 2012. Low-dose dietary genistein negates the therapeutic effect of tamoxifen in athymic nude mice. Carcinogenesis 33: 895–901 [DOI] [PMC free article] [PubMed] [Google Scholar]
- Findlay GM, Yan L, Procter J, Mieulet V, Lamb RF 2007. A MAP4 kinase related to Ste20 is a nutrient-sensitive regulator of mTOR signalling. Biochem J 403: 13–20 [DOI] [PMC free article] [PubMed] [Google Scholar]
- Firth SM, Ganeshprasad U, Baxter RC 1998. Structural determinants of ligand and cell surface binding of insulin-like growth factor-binding protein-3. J Biol Chem 273: 2631–2638 [DOI] [PubMed] [Google Scholar]
- Fontana JA, Nervi C, Shao ZM, Jetten AM 1992. Retinoid antagonism of estrogen-responsive transforming growth factor α and pS2 gene expression in breast carcinoma cells. Cancer Res 52: 3938–3945 [PubMed] [Google Scholar]
- Forster C, Makela S, Warri A, Kietz S, Becker D, Hultenby K, Warner M, Gustafsson JA 2002. Involvement of estrogen receptor β in terminal differentiation of mammary gland epithelium. Proc Natl Acad Sci 99: 15578–15583 [DOI] [PMC free article] [PubMed] [Google Scholar]
- Frasor J, Danes JM, Komm B, Chang KC, Lyttle CR, Katzenellenbogen BS 2003. Profiling of estrogen up- and down-regulated gene expression in human breast cancer cells: Insights into gene networks and pathways underlying estrogenic control of proliferation and cell phenotype. Endocrinology 144: 4562–4574 [DOI] [PubMed] [Google Scholar]
- Gertz J, Varley KE, Davis NS, Baas BJ, Goryshin IY, Vaidyanathan R, Kuersten S, Myers RM 2012. Transposase mediated construction of RNA-seq libraries. Genome Res 22: 134–141 [DOI] [PMC free article] [PubMed] [Google Scholar]
- Grace PB, Taylor JI, Low YL, Luben RN, Mulligan AA, Botting NP, Dowsett M, Welch AA, Khaw KT, Wareham NJ, et al. 2004. Phytoestrogen concentrations in serum and spot urine as biomarkers for dietary phytoestrogen intake and their relation to breast cancer risk in European prospective investigation of cancer and nutrition-norfolk. Cancer Epidemiol Biomarkers Prev 13: 698–708 [PubMed] [Google Scholar]
- Hertz GZ, Stormo GD 1999. Identifying DNA and protein patterns with statistically significant alignments of multiple sequences. Bioinformatics 15: 563–577 [DOI] [PubMed] [Google Scholar]
- Hess-Wilson JK, Boldison J, Weaver KE, Knudsen KE 2006. Xenoestrogen action in breast cancer: Impact on ER-dependent transcription and mitogenesis. Breast Cancer Res Treat 96: 279–292 [DOI] [PubMed] [Google Scholar]
- Hess-Wilson JK, Webb SL, Daly HK, Leung YK, Boldison J, Comstock CE, Sartor MA, Ho SM, Knudsen KE 2007. Unique bisphenol A transcriptome in prostate cancer: Novel effects on ERβ expression that correspond to androgen receptor mutation status. Environ Health Perspect 115: 1646–1653 [DOI] [PMC free article] [PubMed] [Google Scholar]
- Hirsch K, Atzmon A, Danilenko M, Levy J, Sharoni Y 2007. Lycopene and other carotenoids inhibit estrogenic activity of 17β-estradiol and genistein in cancer cells. Breast Cancer Res Treat 104: 221–230 [DOI] [PubMed] [Google Scholar]
- Holder CL, Churchwell MI, Doerge DR 1999. Quantification of soy isoflavones, genistein and daidzein, and conjugates in rat blood using LC/ES-MS. J Agric Food Chem 47: 3764–3770 [DOI] [PubMed] [Google Scholar]
- Hurtado A, Holmes KA, Ross-Innes CS, Schmidt D, Carroll JS 2011. FOXA1 is a key determinant of estrogen receptor function and endocrine response. Nat Genet 43: 27–33 [DOI] [PMC free article] [PubMed] [Google Scholar]
- Jacobson-Dickman E, Lee MM 2009. The influence of endocrine disruptors on pubertal timing. Curr Opin Endocrinol Diabetes Obes 16: 25–30 [DOI] [PubMed] [Google Scholar]
- Jefferson WN, Padilla-Banks E, Newbold RR 2007. Disruption of the developing female reproductive system by phytoestrogens: Genistein as an example. Mol Nutr Food Res 51: 832–844 [DOI] [PubMed] [Google Scholar]
- Jeng YJ, Kochukov M, Watson CS 2010. Combinations of physiologic estrogens with xenoestrogens alter calcium and kinase responses, prolactin release, and membrane estrogen receptor trafficking in rat pituitary cells. Environ Health 9: 61 doi: 10.1186/1476-069X-9-61 [DOI] [PMC free article] [PubMed] [Google Scholar]
- Klein KO, Mericq V, Brown-Dawson JM, Larmore KA, Cabezas P, Cortinez A 1999. Estrogen levels in girls with premature thelarche compared with normal prepubertal girls as determined by an ultrasensitive recombinant cell bioassay. J Pediatr 134: 190–192 [DOI] [PubMed] [Google Scholar]
- Kong SL, Li G, Loh SL, Sung WK, Liu ET 2011. Cellular reprogramming by the conjoint action of ERα, FOXA1, and GATA3 to a ligand-inducible growth state. Mol Syst Biol 7: 526 doi: 10.1038/msb.2011.59 [DOI] [PMC free article] [PubMed] [Google Scholar]
- Korach KS, Couse JF, Curtis SW, Washburn TF, Lindzey J, Kimbro KS, Eddy EM, Migliaccio S, Snedeker SM, Lubahn DB et al. 1996. Estrogen receptor gene disruption: Molecular characterization and experimental and clinical phenotypes. Recent Prog Horm Res 51: 159–186; discussion 186–188 [PubMed] [Google Scholar]
- Krum SA, Miranda-Carboni GA, Lupien M, Eeckhoute J, Carroll JS, Brown M 2008. Unique ERα cistromes control cell type-specific gene regulation. Mol Endocrinol 22: 2393–2406 [DOI] [PMC free article] [PubMed] [Google Scholar]
- Kuiper GG, Lemmen JG, Carlsson B, Corton JC, Safe SH, van der Saag PT, van der Burg B, Gustafsson JA 1998. Interaction of estrogenic chemicals and phytoestrogens with estrogen receptor β. Endocrinology 139: 4252–4263 [DOI] [PubMed] [Google Scholar]
- Lamouille S, Derynck R 2009. Oncogene and tumour suppressor: The two faces of SnoN. EMBO J 28: 3459–3460 [DOI] [PMC free article] [PubMed] [Google Scholar]
- Lee S, Suk K, Kim IK, Jang IS, Park JW, Johnson VJ, Kwon TK, Choi BJ, Kim SH 2008. Signaling pathways of bisphenol A-induced apoptosis in hippocampal neuronal cells: Role of calcium-induced reactive oxygen species, mitogen-activated protein kinases, and nuclear factor-κB. J Neurosci Res 86: 2932–2942 [DOI] [PubMed] [Google Scholar]
- Liu X, Brutlag DL, Liu JS 2001. BioProspector: Discovering conserved DNA motifs in upstream regulatory regions of co-expressed genes. Pac Symp Biocomput 2001: 127–138 [PubMed] [Google Scholar]
- Maffini MV, Rubin BS, Sonnenschein C, Soto AM 2006. Endocrine disruptors and reproductive health: The case of bisphenol-A. Mol Cell Endocrinol 254–255: 179–186 [DOI] [PubMed] [Google Scholar]
- Masuno H, Iwanami J, Kidani T, Sakayama K, Honda K 2005. Bisphenol A accelerates terminal differentiation of 3T3-L1 cells into adipocytes through the phosphatidylinositol 3-kinase pathway. Toxicol Sci 84: 319–327 [DOI] [PubMed] [Google Scholar]
- Molzberger AF, Vollmer G, Hertrampf T, Moller FJ, Kulling S, Diel P 2011. In utero and postnatal exposure to isoflavones results in a reduced responsivity of the mammary gland towards estradiol. Mol Nutr Food Res 56: 399–409 [DOI] [PubMed] [Google Scholar]
- Moore RJ, Hamilton TH 1964. Estrogen-induced formation of uterine ribosomes. Proc Natl Acad Sci 52: 439–446 [DOI] [PMC free article] [PubMed] [Google Scholar]
- Muller A, Homey B, Soto H, Ge N, Catron D, Buchanan ME, McClanahan T, Murphy E, Yuan W, Wagner SN, et al. 2001. Involvement of chemokine receptors in breast cancer metastasis. Nature 410: 50–56 [DOI] [PubMed] [Google Scholar]
- Niikura H, Sasano H, Kaga K, Sato S, Yajima A 1996. Expression of epidermal growth factor family proteins and epidermal growth factor receptor in human endometrium. Hum Pathol 27: 282–289 [DOI] [PubMed] [Google Scholar]
- Nikaido Y, Yoshizawa K, Danbara N, Tsujita-Kyutoku M, Yuri T, Uehara N, Tsubura A 2004. Effects of maternal xenoestrogen exposure on development of the reproductive tract and mammary gland in female CD-1 mouse offspring. Reprod Toxicol 18: 803–811 [DOI] [PubMed] [Google Scholar]
- Peltekova VD, Wintle RF, Rubin LA, Amos CI, Huang Q, Gu X, Newman B, Van Oene M, Cescon D, Greenberg G, et al. 2004. Functional variants of OCTN cation transporter genes are associated with Crohn disease. Nat Genet 36: 471–475 [DOI] [PubMed] [Google Scholar]
- Peng L, Malloy PJ, Wang J, Feldman D 2006. Growth inhibitory concentrations of androgens up-regulate insulin-like growth factor binding protein-3 expression via an androgen response element in LNCaP human prostate cancer cells. Endocrinology 147: 4599–4607 [DOI] [PubMed] [Google Scholar]
- Reddy TE, Pauli F, Sprouse RO, Neff NF, Newberry KM, Garabedian MJ, Myers RM 2009. Genomic determination of the glucocorticoid response reveals unexpected mechanisms of gene regulation. Genome Res 19: 2163–2171 [DOI] [PMC free article] [PubMed] [Google Scholar]
- Reimand J, Kull M, Peterson H, Hansen J, Vilo J 2007. g:Profiler–a web-based toolset for functional profiling of gene lists from large-scale experiments. Nucleic Acids Res 35: W193–W200 [DOI] [PMC free article] [PubMed] [Google Scholar]
- Routledge EJ, White R, Parker MG, Sumpter JP 2000. Differential effects of xenoestrogens on coactivator recruitment by estrogen receptor (ER) α and ERβ. J Biol Chem 275: 35986–35993 [DOI] [PubMed] [Google Scholar]
- Santiago JL, Martinez A, de la Calle H, Fernandez-Arquero M, Figueredo MA, de la Concha EG, Urcelay E 2006. Evidence for the association of the SLC22A4 and SLC22A5 genes with type 1 diabetes: A case control study. BMC Med Genet 7: 54 doi: 10.1186/1471-2350-7-54 [DOI] [PMC free article] [PubMed] [Google Scholar]
- Schonfelder G, Wittfoht W, Hopp H, Talsness CE, Paul M, Chahoud I 2002. Parent bisphenol A accumulation in the human maternal-fetal-placental unit. Environ Health Perspect 110: A703–A707 [DOI] [PMC free article] [PubMed] [Google Scholar]
- Simpson NE, Gertz J, Imberg K, Myers RM, Garabedian MJ 2012. Research resource: Enhanced genome-wide occupancy of estrogen receptor α by the cochaperone p23 in breast cancer cells. Mol Endocrinol 26: 194–202 [DOI] [PMC free article] [PubMed] [Google Scholar]
- Singleton DW, Feng Y, Yang J, Puga A, Lee AV, Khan SA 2006. Gene expression profiling reveals novel regulation by bisphenol-A in estrogen receptor-α-positive human cells. Environ Res 100: 86–92 [DOI] [PubMed] [Google Scholar]
- Storey JD, Tibshirani R 2003. Statistical significance for genomewide studies. Proc Natl Acad Sci 100: 9440–9445 [DOI] [PMC free article] [PubMed] [Google Scholar]
- Strom A, Hartman J, Foster JS, Kietz S, Wimalasena J, Gustafsson JA 2004. Estrogen receptor β inhibits 17β-estradiol-stimulated proliferation of the breast cancer cell line T47D. Proc Natl Acad Sci 101: 1566–1571 [DOI] [PMC free article] [PubMed] [Google Scholar]
- Weber Lozada K, Keri RA 2011. Bisphenol A increases mammary cancer risk in two distinct mouse models of breast cancer. Biol Reprod 85: 490–497 [DOI] [PMC free article] [PubMed] [Google Scholar]
- Welboren WJ, van Driel MA, Janssen-Megens EM, van Heeringen SJ, Sweep FC, Span PN, Stunnenberg HG 2009. ChIP-Seq of ERα and RNA polymerase II defines genes differentially responding to ligands. EMBO J 28: 1418–1428 [DOI] [PMC free article] [PubMed] [Google Scholar]
- Woodruff TK, Walker CL 2008. Fetal and early postnatal environmental exposures and reproductive health effects in the female. Fertil Steril (Suppl) 89: e47–e51 [DOI] [PMC free article] [PubMed] [Google Scholar]
- Yi C, Wang Q, Wang L, Huang Y, Li L, Liu L, Zhou X, Xie G, Kang T, Wang H et al. 2012. MiR-663, a microRNA targeting p21WAF1/CIP1, promotes the proliferation and tumorigenesis of nasopharyngeal carcinoma. Oncogene doi: 10.1038/onc.2011.629 [DOI] [PubMed] [Google Scholar]
- Zhang Y, Liu T, Meyer CA, Eeckhoute J, Johnson DS, Bernstein BE, Nusbaum C, Myers RM, Brown M, Li W, et al. 2008. Model-based analysis of ChIP-Seq (MACS). Genome Biol 9: R137 doi: 10.1186/gb-2008-9-9-r137 [DOI] [PMC free article] [PubMed] [Google Scholar]