

Abstract
Genes regulated by the same miRNA can be discovered by virtue of their coexpression at the transcriptional level and the presence of a conserved miRNA-binding site in their 3′ UTRs. Using this principle we have integrated the three best performing and complementary algorithms into a framework for inference of regulation by miRNAs (FIRM) from sets of coexpressed genes. We demonstrate the utility of FIRM by inferring a cancer–miRNA regulatory network through the analysis of 2240 gene coexpression signatures from 46 cancers. By analyzing this network for functional enrichment of known hallmarks of cancer we have discovered a subset of 13 miRNAs that regulate oncogenic processes across diverse cancers. We have performed experiments to test predictions from this miRNA-regulatory network to demonstrate that miRNAs of the miR-29 family (miR-29a, miR-29b, and miR-29c) regulate specific genes associated with tissue invasion and metastasis in lung adenocarcinoma. Further, we highlight the specificity of using FIRM inferences to identify miRNA-regulated genes by experimentally validating that miR-767-5p, which partially shares the miR-29 seed sequence, regulates only a subset of miR-29 targets. By providing mechanistic linkage between miRNA dysregulation in cancer, their binding sites in the 3′UTRs of specific sets of coexpressed genes, and their associations with known hallmarks of cancer, FIRM, and the inferred cancer miRNA-regulatory network will serve as a powerful public resource for discovery of potential cancer biomarkers.
MicroRNAs (miRNAs) mediate degradation (Baek et al. 2008) or translational repression (Selbach et al. 2008) of gene transcripts associated with an array of biological processes including many of the hallmarks of cancer (Hanahan and Weinberg 2000, 2011; Dalmay and Edwards 2006; Ruan et al. 2009). Not surprisingly, dysregulated miRNAs can be readily detected in tumor biopsies (Jiang et al. 2009) and are known to be diagnostic and prognostic indicators (Zen and Zhang 2012). In some cases miRNAs have also been shown to be potential therapeutic targets (Garofalo and Croce 2011; Nana-Sinkam and Croce 2011). Conservative estimates suggest that each human miRNA regulates several hundred transcripts (Baek et al. 2008; Selbach et al. 2008), and thus miRNA-mediated regulation results in statistically significant gene coexpression signatures that are readily discovered through transcriptome profiling (Lim et al. 2005; Wang and Wang 2006; Weber et al. 2006; Brueckner et al. 2007; Chang et al. 2007; Grimson et al. 2007; He et al. 2007; Johnson et al. 2007; Karginov et al. 2007; Linsley et al. 2007; Frankel et al. 2008; Georges et al. 2008; Hendrickson et al. 2008; Ozen et al. 2008; Sengupta et al. 2008; Ceppi et al. 2009; Fasanaro et al. 2009; Tan et al. 2009; Tsai et al. 2009; Valastyan et al. 2009; Malzkorn et al. 2010; Wang et al. 2010). Together these studies motivated us to build a generalized framework for the inference of miRNA regulatory networks for genes discovered to be coexpressed through analysis of genome-wide transcriptome profiles.
There are two commonly used strategies to identify the miRNA regulator(s) responsible for the observed coexpression of a set of genes: (1) Enrichment of predicted 3′ UTR binding sites for a known miRNA (Kertesz et al. 2007; Betel et al. 2008, 2010; Friedman et al. 2009); or (2) de novo identification of a 3′ UTR motif that is complementary to a seed sequence of a miRNA in miRBase (Linhart et al. 2008; Fan et al. 2009; Goodarzi et al. 2009; Kozomara and Griffiths-Jones 2011). Algorithms utilizing the first strategy incorporate some combination of seed complementarity, cross-species conservation, and thermodynamic properties of the binding site. These algorithms include PITA (Kertesz et al. 2007), TargetScan (Friedman et al. 2009), and both miRanda (Betel et al. 2008) and miRSVR (Betel et al. 2010) from microRNA.org. While the combined modeling of two or more miRNA-binding properties within these algorithms boosts signal (Supplemental Table 1), the multiple hypotheses testing required to identify bona fide miRNA-binding sites unfortunately also simultaneously leads to high false-negative rates (∼32%–52%) (Sethupathy et al. 2006). Therefore, inference of a comprehensive miRNA regulatory network would require the integration of best-performing algorithms from this class with algorithms that utilize the second strategy. We have recently developed a novel algorithm miRvestigator to accurately associate 3′ UTR motifs to complementary miRNA seed sequences (Plaisier et al. 2011). However, for this algorithm to be effective it has to be coupled to a second algorithm Weeder (Pavesi et al. 2006) that can accurately detect de novo cis-regulatory motifs that are conserved within the 3′ UTRs of the coexpressed genes (Linhart et al. 2008; Fan et al. 2009). miRvestigator converts relative conservation of nucleotides at each position of a cis-regulatory motif discovered by Weeder into a profile hidden Markov model (HMM). Using this HMM, the Viterbi algorithm, and a background distribution of all possible k-mer sequences (6-, 7-, or 8-mer), miRvestigator accurately identifies the most likely miRNA that binds the conserved 3′ UTR element to mediate the observed coregulation (Plaisier et al. 2011).
Here, we report the construction of a generalized framework for the inference of regulation by miRNAs (FIRM). First, we have compiled a compendium of transcriptome profiles from studies that had interrogated differential expression of genes in response to targeted perturbation of specific miRNAs (Lim et al. 2005; Weber et al. 2006; Brueckner et al. 2007; Chang et al. 2007; Grimson et al. 2007; He et al. 2007; Johnson et al. 2007; Karginov et al. 2007; Linsley et al. 2007; Frankel et al. 2008; Georges et al. 2008; Hendrickson et al. 2008; Ozen et al. 2008; Sengupta et al. 2008; Ceppi et al. 2009; Fasanaro et al. 2009; Tan et al. 2009; Tsai et al. 2009; Valastyan et al. 2009; Malzkorn et al. 2010; Wang et al. 2010). Second, using this compendium of miRNA-perturbed transcriptomes we demonstrate that functional miRNA-binding sites (8 bp of complementarity) preferentially reside in the 3′ UTRs. Further, we demonstrate that using preferential 3′ UTR localization as a heuristic significantly increases sensitivity and specificity of miRNA-binding site discovery by Weeder-miRvestigator. Third, using the compendium of miRNA-perturbed transcriptomes we have identified and integrated the best performing algorithms into a generalized framework for inference of miRNA regulatory networks. Finally, we demonstrate the utility of this framework by applying it to a set of 2240 coexpression signatures from 46 different cancers. The original study was able to associate only four signatures to putative regulation by a known miRNA (Goodarzi et al. 2009). In contrast, using the integrated framework we were able to explain 1324 signatures as potential outcomes of regulation by specific miRNAs in miRBase. By applying functional enrichment and semantic similarity we have identified within this expansive network specific miRNAs associated with hallmarks of cancer. Further, filtering gene coexpression signatures for specific hallmarks of cancer such as “tissue invasion and metastasis” generated a metastatic cancer–miRNA regulatory network of 33 miRNAs. Importantly, this revealed that a relatively small subset of miRNAs regulate multiple oncogenic processes across different cancers. Through in-depth analyses of data from prior studies as well as new data from targeted miRNA-perturbation experiments, we have experimentally validated the role of miR-29 family members in lung adenocarcinoma and discovered gene targets for regulation by the relatively unknown miR-767-5p. These analyses and validations demonstrate how the cancer–miRNA regulatory network can be used to accelerate discovery of miRNA-based biomarkers and potentially therapeutics.
Results
Inferring miRNA mediated regulation through analysis of coexpressed genes
The inference of a miRNA regulatory network can be accomplished in two ways. The first approach requires prior knowledge of genome-wide binding site locations for known miRNAs (Sethupathy et al. 2006). There are many algorithms that utilize this target enrichment strategy for inference of miRNA regulatory networks (Grimson et al. 2007; Linhart et al. 2008; Betel et al. 2010). The second approach performs the de novo discovery of conserved putative miRNA-binding sites within the 3′ UTRs of coexpressed genes. Weeder is one such algorithm that accurately discovers conserved cis-regulatory elements in 3′ UTRs (Linhart et al. 2008; Fan et al. 2009). The information of conserved cis-regulatory sequences can then be utilized for pattern matching to seed sequences of known miRNAs in miRBase. We had previously reported a web framework using the miRvestigator algorithm for performing such pattern matching (Plaisier et al. 2011). Here, we present results on the performance of Weeder and miRvestigator applied to simulated data sets. We then utilize a compendium of experimentally generated data from targeted miRNA perturbation studies to demonstrate that restricting Weeder's search space to 3′ UTR's sequences increases the sensitivity and specificity of Weeder–miRvestigator. Finally, we use the compendium to compare the performance of algorithms for the inference of miRNA regulation and combine the optimal methods into an integrated framework.
Weeder–miRvestigator
We constructed a framework for accurate inference of miRNA-mediated regulation using as input just the 3′ UTR sequences of coexpressed genes by coupling Weeder de novo motif detection and miRvestigator for subsequent association to known miRNA seeds (Fig. 1). We tested the sensitivity and specificity of miRvestigator independent of Weeder using synthetic 3′ UTR motifs. Starting with the seed sequence of miR-1 we computationally generated a set of synthetic motifs with increasing entropy. Using these synthetic motifs we computed the receiver operating characteristic (ROC) area under the curve (AUC) across a range of motif entropies. The ROC AUC is a standard approach to evaluate the sensitivity and specificity of classification or feature selection by an algorithm. This statistical analysis demonstrated that the miRvestigator scoring function (complementarity P-value metric) outperforms regular expression in both sensitivity and specificity for higher entropies (Fig. 2A; Supplemental Methods). Using the same approach we tested the performance of the integrated Weeder–miRvestigator framework in recovering the miR-1 seed sequence from a set of synthetic sequences into which it was inserted at a known frequency (0%–100%). The results showed that by integrating the two algorithms we can sensitively and specifically recover the complementary miRNA seed (ROC AUC ∼0.9) even when it is present in just 40% of the query sequences (Fig. 2B). We conclude from these experiments that the integrated Weeder–miRvestigator approach is a sensitive and specific method for inference of miRNA-mediated regulation from 3′ UTRs of coregulated genes.
Figure 1.

Overview of Weeder–miRvestigator tandem that we developed to identify miRNAs driving coexpression of transcripts. Quantitative assays of the transcriptome are used to identify gene-coexpression signatures comprised of genes with significantly similar gene-expression profiles. The 3′ UTR sequences for the coexpressed genes are then extracted from the genome and used as input into the Weeder algorithm. The Weeder algorithm searches the 3′ UTR sequences for an overrepresented motif, which is turned into a miRvestigator hidden Markov model (HMM). All of the miRNA seed sequences from the miRNA repository miRBase are compared with the HMM model of the overrepresented sequence motif using the Viterbi algorithm. The miRNA seed sequence with the most significant complementarity P-value is the most likely miRNA driving the coexpression signature and a hypothesis that can be tested experimentally.
Figure 2.

The sensitivity and specificity of the miRvestigator algorithm and framework is estimated using simulated data sets. (A) The ROC AUC was computed by simulating miR-1 motifs across a range of motif entropies. Shown are the ROC AUC for the consensus matched to 8-bp miRNA seed sequences from miRBase using regular expression and the miRvestigator HMM-derived scoring metrics Viterbi P-value. (B) We then tested the sensitivity and specificity of coupling de novo motif detection algorithm Weeder to the miRvestigator (Fig. 1) by applying them to 30 simulated sequences with varying levels of inserted miR-1 seed sequence (0%–100%). (C) Histogram of Weeder-identified miRNA-binding sites for whole transcripts where transcripts are centered on the stop codon (0 bp). Instances of miRNA-binding sites were either stratified based upon their complementarity to the motif identified by Weeder (8, 7, or 6 bp) or the combination of all complementarities. As described by the gene structure below the histogram upstream of the stop codon are the 5′ UTR and coding regulatory regions, and downstream is the 3′ UTR. In the gene structure below the histogram, the coding sequence is a wider gray box, the start codon is a green arrow, and the stop codon is a red stop sign. (D) Significance of the enrichment of miRNA-binding sites per 1 Kbp was computed as a meta statistic and is shown for each gene region and each stratified site complementarity.
Restricting searches to 3′ UTR increases sensitivity and specificity of the Weeder–miRvestigator
MiRNA target prediction algorithms (including PITA, TargetScan, miRANDA, and miRSVR) improved their performance by restricting searches to the 3′ UTRs of transcripts where it has been demonstrated statistically that functional miRNA-binding sites are preferentially located (Grimson et al. 2007). To determine the validity of this heuristic we investigated the distribution of functional miRNA-binding sites within coregulated transcripts by applying Weeder–miRvestigator to full transcript sequences (5′ UTR, coding sequence [CDS], and 3′ UTR). First, we compiled a compendium of miRNA target gene sets from 50 transcriptomes that were generated by perturbing specific miRNAs (22 independent studies, 41 unique mIRNAs; Supplemental Table 2). The analysis was then restricted to target gene sets in the compendium where Weeder–miRvestigator was able to identify the corresponding perturbed miRNA (27 of 50 sets). The 3′ UTRs were significantly enriched for miRNA-binding sites with 8 bp complementarity to the miRNA seed sequence (P-value = 3.2 × 10⁻⁵, Fig. 2C,D). Remarkably, none of the other transcript regions showed significant enrichment of miRNA-binding sites (P-value > 1.5 × 10⁻⁴, P-value corrected for 27 miRNAs × 3 transcript regions × 4 instance complementarities to the miRNA seed [All, 8, 7, and 6 bp complementarities]). This unbiased analysis has independently confirmed the observation of Grimson et al. (2007) that functional miRNA-binding sites preferentially reside in the 3′ UTRs. Next, we compared the sensitivity and specificity of searching full transcripts versus restricting the search space to the 3′ UTRs by computing ROC curves for Weeder–miRvestigator. Restricting the search space to 3′ UTRs (ROC AUC = 0.96) significantly increased the sensitivity and specificity of miRNA-binding site discovery by Weeder (P-value = 1.8 × 10⁻²) relative to corresponding searches on full-transcript sequences (ROC AUC = 0.80). Therefore, all subsequent miRNA-binding site searches with Weeder were restricted to the 3′ UTR of putatively coregulated gene sets.
Selecting optimal methods to infer a comprehensive miRNA regulatory network
While multiple hypotheses testing correction procedures can reduce the number of false positives (incorrectly inferred regulatory interactions), it also results in a higher false-negative rate (i.e., missing regulatory interactions). Therefore, we hypothesized that integrating results from multiple inference methods would construct a more comprehensive cancer–miRNA regulatory network, as each method identifies a different subset of the miRNA regulatory network. To assess this, we first identified the best-performing network inference methods by computing a ROC curve from the predictions of applying each method to the compendium of experimentally determined miRNA target gene sets. In addition to Weeder–miRvestigator, we tested four additional algorithms that infer miRNA regulation through enrichment of predicted binding sites in 3′ UTRs of coexpressed genes: PITA, TargetScan, miRanda, and miRSVR. This comparative analysis demonstrated that Weeder–miRvestigator, PITA, and TargetScan are the best-performing algorithms for inference of miRNA-mediated regulation (Fig. 3A) (ROC AUC ± 95% confidence interval: 0.96 ± 0.03, 0.94 ± 0.04, and 0.90 ± 0.05, respectively; Supplemental Table 3). Using cancer as an example, we explain in subsequent sections how the integration of these three best-performing algorithms provides a generalizable framework for inference of regulation by miRNAs (FIRM) to infer comprehensive miRNA regulatory networks for complex diseases.
Figure 3.

(A) Determining the optimal method(s) (most sensitive and specific) to infer miRNA-mediated regulation from coexpressed genes. The methods tested were (1) Weeder coupled to miRvestigator (Weeder–miRvestigator) (black line), (2) enrichment of PITA-predicted miRNA target genes (blue line), (3) enrichment of TargetScan-predicted target genes (green line), (4) enrichment of miRSVR-predicted target genes (orange line), and (5) enrichment of miRanda-predicted target genes (red line). (B) Overlap of coexpression signatures between putative miRNA regulators predicted by the three methods (Weeder–miRvestigator, PITA, and TargetScan) in FIRM. Pairwise overlap of coexpression signatures between methods is statistically significant (Weeder–miRvestigator vs. PITA: 0.045; Weeder–miRvestigator vs. TargetScan: 0.019; PITA vs. TargetScan: 7.4 × 10⁻²²). All three methods identified miR-29a/b/c as the regulator for the lung adenocarcinoma coexpression signature AD Lung Beer 31.
Constructing a cancer–miRNA regulatory network using FIRM
A previous study published by Goodarzi et al. (2009) analyzed transcriptome profiles from 46 different cancers and identified 2240 cancer-subtype characteristic coexpression signatures. Interestingly, the investigators were able to associate only four of these signatures to regulation by a specific miRNA in miRBase. We analyzed these coexpression signatures using FIRM with the intent of constructing a comprehensive cancer–miRNA regulatory network. Weeder–miRvestigator, PITA, and TargetScan predicted miRNA regulators for 119, 662, and 1029 coexpression signatures, respectively (Weeder–miRvestigator criteria: perfect 7-mer or 8-mer match, FDR ≤ 0.05, Supplemental Table 4; PITA and TargetScan criteria: FDR ≤ 0.001 and enrichment ≥ 10%, Supplemental Tables 5, 6, respectively). There was significant overlap in pairwise comparisons of predictions for the same cancer (Weeder–miRvestigator vs. PITA: 0.045, Weeder–miRvestigator vs. TargetScan: 0.019, and PITA vs. TargetScan: 7.4 × 10⁻²²) (Fig. 3B). While this significant overlap demonstrates concordance across the methods, a large fraction of the inferred miRNA regulation was unique to each method. This is not surprising given the high false-negative rates of these methods and the different principles they use for identifying miRNA-mediated regulation. In other words, predictions made by the three algorithms are mostly complementary. Combining results from all three methods in FIRM resulted in the construction of a comprehensive miRNA regulatory network that links 1324 coexpression signatures to post-transcriptional regulation mediated by 608 miRNAs (Supplemental Table 7). Within this network, 443 coexpression signatures were associated to miRNAs by more than one algorithm. Twenty coexpression signatures were independently associated to the same miRNA by two different algorithms (Supplemental Table 7). Interestingly, the only prediction that was consistent across all algorithms was that the miR-29 family regulates genes whose coexpression is observed in lung adenocarcinoma. In the following sections we investigate which miRNAs regulate oncogenic processes and the degree to which this network recapitulates known dysregulation of miRNAs in miR2Disease.
The cancer–miRNA network recapitulates miR2Disease and discovers miRNAs that are causal in cancers
We investigated whether the cancer-miRNA regulatory network was able to recapitulate miRNAs that are both dysregulated in tumors and causally linked to specific oncogenic processes. We performed this analysis by comparing the cancer–miRNA network to entries in miR2Disease, a manually curated database of miRNAs that are dysregulated and causally associated with 163 human diseases including the 46 cancers in our study. Remarkably, there was significant enrichment of known dysregulated miRNAs in the cancer–miRNA network. Altogether, 191 putative miRNA regulators in our inferred network were previously shown to be dysregulated in patient tumors of the same cancer type (P-value = 2.1 × 10−91; Supplemental Table 7). Importantly, there were significant overlaps with predictions by each of the three algorithms (Weeder–miRvestigator P-value = 0.029, PITA P-value = 7.4 × 10⁻²³, and TargetScan P-value = 1.1 × 10⁻³²). This result further demonstrates the value of combining the three algorithms in FIRM to infer a more comprehensive miRNA regulatory network.
Using miR2Disease, we further investigated whether the dysregulated miRNAs predicted by FIRM were also known to causally influence cancer phenotypes. It was striking that over a third of the putative miRNA regulators that were dysregulated were also known to causally affect cancer phenotypes (66 miRNAs, P-value = 1.4 × 10⁻³⁴; Supplemental Table 7). Among these, three of the most highly connected miRNAs (miR-29b, miR-200b, and miR-296-5p) were dysregulated in at least eight cancers and causal in at least four cancers. These results demonstrate that the network inferred by FIRM had captured disease-relevant miRNA regulation of cancer. It also suggests that the network contains novel testable hypotheses regarding the role of miRNAs in the regulation of cancer beyond what is documented in miR2Disease. A key next step is the prioritization of these novel testable hypotheses by integrating orthogonal information.
Identifying miRNAs regulating the hallmarks of cancer
Associating a miRNA to a coexpression signature in patient tumors does not by itself implicate it in the regulation of key oncogenic processes. However, the network enables the discovery of cancer-relevant miRNAs through analysis of target genes for functional enrichment of one or more hallmarks of cancer (Hanahan and Weinberg 2000, 2011): (1) “self sufficiency in growth signals,” (2) “insensitivity to antigrowth signals,” (3) “evading apoptosis,” (4) “limitless replicative potential,” (5) “sustained angiogenesis,” (6) “tissue invasion and metastasis,” (7) “genome instability and mutation,” (8) “tumor promoting inflammation,” (9) “reprogramming energy metabolism,” and (10) “evading immune detection.” We analyzed genes within each of the coexpression signatures for hallmarks of cancer through their associations to specific Gene Ontology (GO) biological process terms.
In total, 627 of the 2240 coexpression signatures were significantly enriched for GO terms (FDR ≤ 0.05) and 314 were associated with a putative miRNA in the regulatory network (Supplemental Table 8). To further filter this set and discover specific coexpression signatures associated with oncogenesis, we manually curated the lowest level GO terms for each of the 10 hallmarks of cancer (Supplemental Table 9), e.g., the hallmark of cancer “Evading Apoptosis” is associated with the GO term “Positive Regulation of Anti-Apoptosis.” Based on semantic similarity between GO terms we then associated 158 of the 314 putatively miRNA regulated coexpression signatures to one or more hallmarks of cancer (Jiang-Conrath Semantic Similarity Score ≥ 0.8, permuted P-value ≤ 5.1 × 10⁻⁴; Supplemental Table 8).
Metastatic potential is one of the defining features of malignant tumors making putative miRNA-regulators of “tissue invasion and metastasis” excellent biomarker candidates. As an initial filter we selected 85 of the 158 “hallmarks of cancer”-associated coexpression signatures that had significant overlap (P-value ≤ 0.05) between GO-annotated and putatively miRNA-regulated genes. Next, we extracted from these 85 coexpression signatures a subnetwork of 33 miRNAs and their predicted regulatory influences on 47 coexpression signatures associated with “tissue invasion and metastasis”—i.e., the metastatic cancer miRNA-regulatory network (Fig. 4A; Supplemental Table 10). Notably, at least three miRNAs, miR-29a/b/c, miR-199a/b-3p, and miR-222, are known to be differentially expressed in the cancer type predicted by this subnetwork. While some of these prior studies had independently revealed phenotypic consequences of perturbing the miR-29 family on tumor invasiveness, FIRM proposes a mechanistic explanation by predicting that these miRNAs directly regulate specific genes involved in “tissue invasion and metastasis.” We have performed detailed experimental validations demonstrating the regulation of metastasis-associated genes by the miR-29 miRNAs, and results of these experiments are presented in a later section.
Figure 4.

Metastatic and cross-cancer–miRNA regulatory networks. Hierarchy of filters applied to the cancer–miRNA regulatory network to produce both the metastatic and cross-cancer miRNA-regulatory networks is depicted above the networks, and a legend for the networks can be found in the top right corner. Nodes are cancers (purple octagons), coexpression signatures (orange circles), inferred miRNAs (red diamonds), or hallmarks of cancer (green parallelogram). Orange edges describe the cancer where a coexpression signature was observed, blue edges link a putative miRNA regulator to a coexpression signature (putative miRNA regulation from cancer miRNA regulatory network), and red edges link putative miRNAs to the hallmarks of cancer based upon functional enrichment of the coexpression signatures they regulate (GO term semantic similarity). (Thicker dashed edges) Experimental validation for the inferred relationship. (A) Metastatic cancer–miRNA regulatory network was filtered for the sake of space to show only cancers with at least one predicted regulatory interaction that has been validated. (B) The cross-cancer–miRNA regulatory network was generated by identifying miRNAs with more than one coexpression signature that are functionally enriched for the same GO terms, and that are sufficiently similar to GO terms characterizing the hallmarks of cancer.
A relatively small subset of miRNAs regulate oncogenic processes in diverse cancers
Regulation of the same oncogenic process by the same miRNA across different cancers reinforces the likelihood that the inferred miRNA regulation is real. In the cancer–miRNA regulatory network the number of coexpression signatures regulated by a miRNA follows a power-law distribution (γ = 2.1 ± 0.0; goodness of fit P-value < 1.0 × 10⁻⁴) with each miRNA predicted to regulate, on average, 3.3 ± 3.3 coexpression signatures (Barabasi and Albert 1999). This suggests that some miRNAs regulate common biological processes across multiple cancers. Therefore, we filtered the cancer–miRNA regulatory network for miRNAs predicted to regulate genes within two or more coexpression signatures enriched for the same GO term(s). This analysis recovered 24 miRNAs that were predicted to combinatorially regulate 74 nonredundant coexpression signatures. Again, using semantic similarity to the hallmarks of cancer we discovered a subnetwork of 38 coexpression signatures from 30 cancer types that are regulated by 13 highly connected miRNAs (miR-29a/b/c, miR-130a, miR-296-5p, miR-338-5p, miR-369-5p, miR-656, miR-760, miR-767-5p, miR-890, miR-939, miR-1275, miR-1276, and miR-1291)—i.e., a cross-cancer–miRNA regulatory network (Fig. 4B; Supplemental Table 11). Each of the 13 miRNAs putatively regulates the same oncogenic processes across two or more cancers (Fig. 4B). We have already discussed the role of the miR-29 family in regulation of “tissue invasion and metastasis.” Further, reversing down-regulation of miR-130a in metastatic prostate cancer cell lines has been previously demonstrated to increase apoptosis (Boll et al. 2012). This independently validates the cancer–miRNA regulatory network predicted effect of miR-130a on “evading apoptosis.” Finally, the predicted role of miR-296-5p in “activating invasion and metastasis” has also been validated by an independent study that discovered down-regulation of this miRNA in metastases relative to primary tumors (Vaira et al. 2012). Notably, five of the 13 miRNAs (hsa-miR-29a/b/c, miR-296-5p, miR-760, miR-767-5p, and miR-1276) were inferred for coexpression signatures where a significant fraction of genes are direct miRNA targets and have GO annotated functions in oncogenic processes (Fig. 4A). It is noteworthy that such filtering is too stringent and would have excluded known cancer-related miRNAs such as miR-130a. Therefore, the integration of coexpression, shared miRNA-binding sites, and GO annotations, together overcome the incompleteness and uncertainties across all of these orthogonal data sets to discover novel biologically meaningful regulation by miRNAs. Thus, we predict that all of the 13 miRNAs are excellent candidates for follow-up studies to assess their use as general-purpose cancer biomarkers.
Extracellular matrix genes coregulated by the miR-29 family in lung adenocarcinoma
In both the metastatic and cross-cancer–miRNA regulatory network, the miR-29 family (miR-29a, miR-29b, and miR-29c) was predicted to be responsible for eight coexpression signatures, five of which were associated with four hallmarks of cancer, viz. “tissue invasion and metastasis,” “sustained angiogenesis,” “insensitivity to antigrowth signals,” and “self sufficiency in growth signals” (Fig. 4A,B). Two of these coexpression signatures were from lung adenocarcinoma patient tumors, “AD Lung Beer 31” and “AD Lung Bhattacharjee 59” (Bhattacharjee et al. 2001; Beer et al. 2002). The miR-29 family was associated with the coexpression signature from “AD Lung Beer 31” by all three inference methods; on the other hand, only PITA picked miR-29 as the putative regulator responsible for the coexpression signature from “AD Lung Bhattacharjee 59.”
Two independent studies demonstrated that overexpression of miR-29a reduces the invasiveness of lung carcinoma cell lines (Muniyappa et al. 2009), and knock-down of miR-29b increases invasiveness (Rothschild et al. 2012), serving as independent validation of the network-predicted role of the miR-29 family as regulators of “activating invasion and metastasis” in lung cancer. The direction of this association is concordant with a different set of studies which independently discovered that miR-29 family members were down-regulated in lung adenocarcinomas relative to normal lung (Yanaihara et al. 2006; Landi et al. 2010). Taken together these orthogonal sets of results strongly suggest that down-regulation of the miR-29 family increases tumor invasiveness, thereby decreasing patient survival (Rothschild et al. 2012).
A major strength of the cancer–miRNA regulatory network is that it identifies specific genes that are directly regulated by a specific miRNA. For instance, the miR-29 family is implicated in modulating metastatic potential of patient tumors because it is predicted to directly regulate 79 and 64 genes in two coexpression signatures—“AD Lung Beer 31” and “AD Lung Bhatacharjee 59.” Notably, the two coexpression signatures have a significant overlap of 32 genes (P-value = 2.1 × 10−46). We assessed whether these genes were indeed targets for regulation by the miR-29 family by investigating whether they were differentially regulated when endogenous miRNAs of the miR29 family were knocked-down in a fetal lung fibroblast cell line (Cushing et al. 2011). Sixteen genes from “AD Lung Beer 31” and nine genes from “AD Lung Bhattacharjee 59” were up-regulated in response to knock-down of the three miR-29 family members (P-values = 6.1 × 10⁻¹⁴ and 1.5 × 10⁻⁸, respectively). Altogether, 17 genes from both coexpression signatures were up-regulated in the Cushing et al. (2011) study (Table 1), and notably all of these genes contain one or more miR-29 family binding sites in their 3′ UTRs (Table 1).
Table 1.
Genes validated to be regulated by the miR-29 family
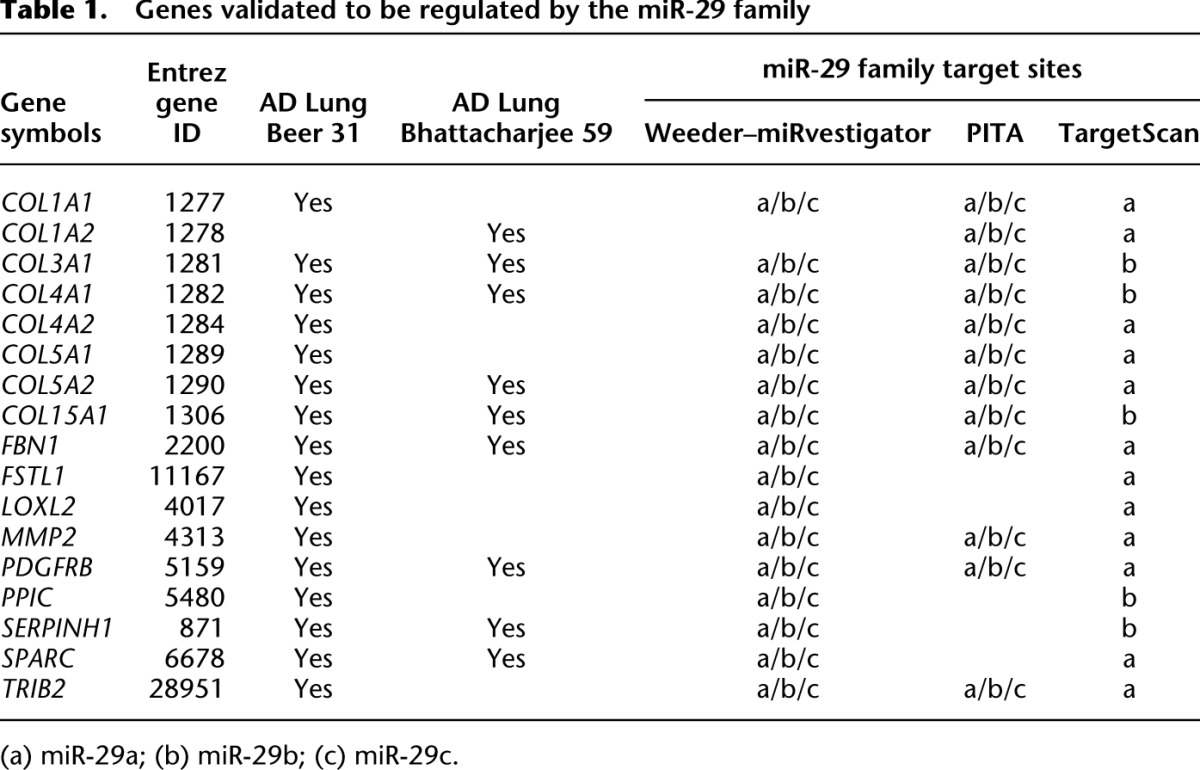
Differential regulation of the 17 genes in the Cushing et al. (2011) study does not demonstrate direct regulation by miR29 family miRNAs through physical interaction with predicted binding sites within 3′ UTRs of these genes. However, it is possible to demonstrate direct miRNA regulation by fusing the 3′ UTR of each putative target gene to a luciferase reporter, selectively deleting specific binding sites and performing luciferase assays in cell lines that are cotransfected with the wild-type or mutated reporter–fusion construct and the synthetic miRNA mimic (at different concentrations) (Lal et al. 2011). We selected a total of eight genes (COL3A1, COL4A1, COL4A2, FBN1, MMP2, PDGFRB, SERPINH1, and SPARC—see Table 1) to investigate using the aforementioned luciferase assay whether they were direct targets for regulation by miR29 family miRNAs (miR-29a, miR-29b, and miR-29c). These genes were selected because they were predicted by the FIRM methods to (1) be in coexpression signatures regulated by the miR-29 family, (2) contain miR-29 family binding sites, (3) have functional association to “tissue invasion and metastasis” (e.g., collagens, metallo-proteases, etc.), and (4) be up-regulated by miR-29 family knock-down in lung fibroblasts in the Cushing et al. (2011) study.
First, we used qRT–PCR to demonstrate that the miR-29a mimic significantly down-regulates transcript levels of luciferase when it is fused to 3′ UTRs of either COL3A1 or SPARC (COL3A1 P-value = 3.2 × 10⁻², fold-change: −3.9; SPARC P-value = 4.2 × 10⁻², fold-change: −1.7). This validates our central thesis that perturbing a miRNA results in observable changes in transcript levels of the predicted target transcripts with corresponding miRNA-binding sites in the 3′ UTR. We then assayed the effects of all three miR-29 mimics (miR-29a, miR-29b, and miR-29c) on normalized luciferase activity relative to a control (i.e., no miRNA mimic). Significant reduction in normalized luciferase expression (P-value < 0.05) was observed for seven of the eight genes tested (Table 2), and there was no consequence when luciferase was fused to the negative control 3′ UTR from HIST1H2AC (miR-29a: P-value = 0.99, fold-change = 1.2). Deletion of all of the putative miR-29 binding sites from the 3′ UTRs of MMP2 and SPARC abolished down-regulation of luciferase activity by the miR-29 family mimics, conclusively demonstrating that miR-29 directly regulates abundance of predicted target transcripts via binding to the predicted 3′ UTR sites (MMP2-deletion: one site deleted, fold-change = 1.1, P-value = 8.6 × 10⁻¹; SPARC-deletion: two sites deleted, fold-change = 1.4, P-value = 1.0) (Fig. 5A). Finally, titration of the miR-29a mimic demonstrated that it down-regulates COL3A1 and SPARC in a dose-dependent manner (Fig. 5B).
Table 2.
Genes validated to be regulated by the miR-29 family and miR-767-5p
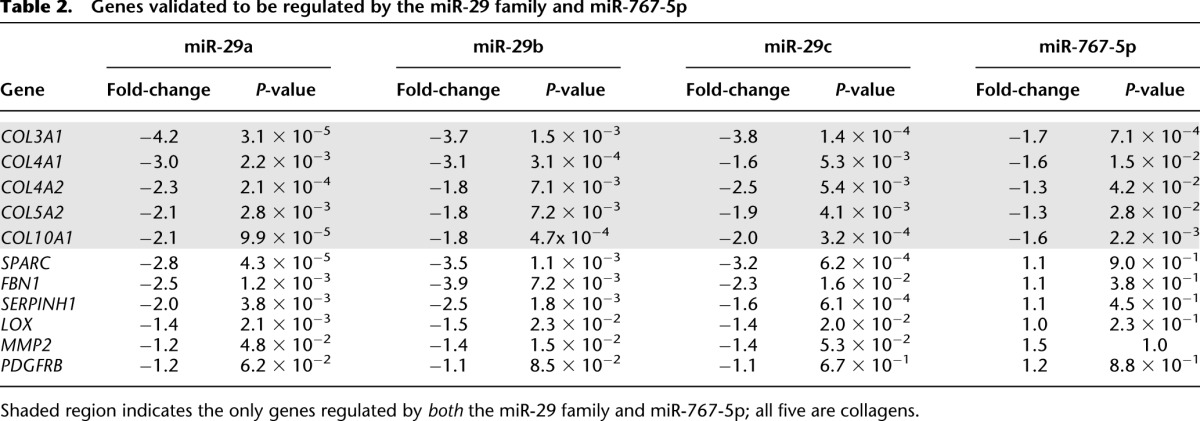
Figure 5.

Luciferase reporter assay validation of miRNA-binding site predictions from FIRM. (A) Deletion of miR-29-binding sites ablates response to miR-29a mimic. The wild-type 3′ UTRs are MMP2 and SPARC. The miR-29-binding sites that deleted 3′ UTRs are MMP2 Δ and SPARC Δ. The deletions have a slight increase in normalized luminescence over their corresponding vector control, which is similar to what is observed for the negative control, HIST1H2AC, which does not have a miR-29-binding site. (B) Dose response curves for COL3A1 and SPARC titrating the amounts of miR-29a mimic (50 nM, 5 nM, 500 pM, 50 pM, and 5 pM).
miR-767-5p regulates a collagen-specific subset of miR-29 target genes
Analysis of predicted regulation by miR-29 demonstrates that the cancer–miRNA regulatory network makes accurate predictions that can be validated experimentally through a combination of miRNA perturbation and targeted mutagenesis of specific binding sites in the 3′ UTRs. We conducted further experimental analysis of predicted regulation by miR-767-5p to assess the specificity of using FIRM inferences to identify genes regulated by a miRNA. We selected miR-767-5p because this miRNA partially shares the miR-29 seed sequence. Specifically, both the metastatic and cross-cancer–miRNA regulatory networks contain the PITA predictions that miR-767-5p regulates genes associated with four hallmarks of cancer (“insensitivity to antigrowth signals,” “self sufficiency in growth signals,” “sustained angiogenesis,” and “tissue invasion and metastasis”) from four coexpression signatures (AD Ovarian Welsh 20, HSCC Head-Neck Chung 1, and SQ Bhattacharjee 18 and 44) across three cancer types (Bhattacharjee et al. 2001; Welsh et al. 2001; Chung et al. 2004).
Unlike the miR-29 family, miR-767-5p has not been previously associated with any oncogenic processes. Therefore, we first evaluated whether there is any evidence for expression of miR-767-5p in head and neck, lung, or ovarian cancers to support the prediction by the cancer–miRNA regulatory network. A scan of miRNA-seq data from The Cancer Genome Atlas (TCGA) shows that miR-767-5p is indeed expressed in lung squamous cell carcinoma, head and neck squamous cell carcinoma, and ovarian serous cystadenocarcinoma (data not shown). Additionally, the MirZ miRNA expression atlas identifies miR-767-5p expression in astrocytoma, osteosarcoma, and teratocarcinoma cell lines (Hausser et al. 2009). Future studies with the completed TCGA data will be able to determine whether miR-767-5p is differentially expressed between tumor and normal and whether miR-767-5p is predictive of patient survival. Based on this evidence we proceeded to test the effect of perturbing miR-767-5p on transcript abundance of the PITA-predicted targets. Overexpression of miR-767-5p using a miRNA mimic led to significant reduction (P-value ≤ 0.05) in the normalized luciferase activity for three of the four predicted miRNA target genes (COL3A1, COL5A2, COL10A1, and LOX) (Table 2).
In addition to validating a novel oncogenesis-associated miRNA, the aforementioned rationale for selecting miR-767-5p was that it also shares 6 bp of similarity to the 8-bp seed region of the miR-29 family, leading to a significant overlap between their predicted target genes (65% for PITA and 35% for TargetScan). This may explain why miR-767-5p and the miR-29 family are both predicted regulators of the HSCC Head-Neck Chung 1 coexpression signature. However, the two seed sequences have little similarity in the 3′ region (Supplemental Fig. 1). The partial overlap in the miRNA seeds and their predicted targets provide an opportunity to test the specificity of using FIRM inferences to identify genes regulated by a miRNA. First, we tested all 11 3′ UTR luciferase fusions by overexpressing miR-29a, miR-29b, and miR-29c and miR-767-5p. Of the 22 regulatory interactions tested (Table 2) we observed only one false positive (miR-767-5p did not affect LOX transcript levels) and two false negatives (the cancer–miRNA network did not predict the experimentally observed regulation of COL4A2 by miR-767-5p, and regulation of COL10A1 by the miR-29 family). Thus, the false discovery rate was 7.1%—a significant improvement over previously published estimates (Sethupathy et al. 2006). Consistent with the cancer–miRNA network predictions, of the 11 genes that were tested only the five collagens were significantly regulated (P-value ≤ 0.05) by both miR-767-5p and the miR-29 family. Despite sharing 6 bp of similarity in the seed sequence, miR-767-5p had no effect on transcript abundance of the other six bona fide miR-29 family targets to underscore the specificity of the cancer–miRNA regulatory network predictions filtered through FIRM.
Discussion
As genome-wide analyses for discovery of molecular signatures of complex disease becomes routine, it is imperative that these data are integrated into predictive and actionable models that drive targeted hypothesis-driven discovery of diagnostics, prognostics, and, ultimately, therapeutics. The systems integration of disparate kinds of information boosts signal to noise, enabling the discovery of biologically meaningful patterns as we have demonstrated here through inference of a cancer–miRNA regulatory network. The success of the FIRM approach depended not only on integration of three best-performing algorithms that use complementary strategies for inference of miRNA regulatory networks, but also on the integration of disparate data types such as gene coexpression and distributions of both known and de novo-discovered miRNA-binding sites (Fig. 6). This is a remarkable achievement given that the information for miRNA binding and regulation exists in a contiguous stretch of merely 6–8 nucleotides located within the expansive 3′ UTRs of >20,000 genes in a genome of 6 billion base pairs.
Figure 6.

Summary of FIRM predictions for the miR-29a/b/c and miR-767-5p cancer–miRNA regulatory subnetwork. This subnetwork is included in both the metastatic- and cross-cancer–miRNA regulatory networks. The network is laid out hierarchically with (from the top down) cancers, miRNAs, coexpression signatures, genes that were experimentally validated through luciferase assays, significantly enriched GO biological process terms for the coexpression signature, and finally the GO terms associated with hallmarks of cancers. (Left) The FIRM integration strategy that is a flow of information through this hierarchy, where the red arrows indicate a FIRM prediction. The meanings of the FIRM predictions are described on the right side, where inference of a miRNA regulating a cancer coexpression signature predicts that the miRNA is dysregulated in that cancer. This same inference predicts that the miRNA regulates the genes in the signature, which can be tested experimentally. Functional enrichment of GO term annotations among the coregulated genes predicts the effect of regulating this set of genes, and association of the enriched GO terms with hallmarks of cancer predicts the oncogenic processes that might be affected.
Further, we have also demonstrated that by incorporating the mechanistic basis of miRNA regulation, i.e., binding to complementary sequences in the 3′ UTRs of coexpressed genes, the network can be more easily assayed with targeted experimental and functional evaluation. In doing so we were able to demonstrate that the cancer–miRNA regulatory network had captured a significant proportion of known miRNA dysregulation and their causal influence on cancer phenotypes. In fact, the network also made specific experimentally testable novel predictions regarding the role of 158 miRNAs in mediating coexpression of genes associated with oncogenic processes. Among these were 33 miRNAs that were predicted to regulate metastatic processes, including a core set of 13 miRNAs that were predicted to regulate the same set of oncogenic processes across different cancer types. Our focused investigation of the role of miR-29 family in promoting metastasis in lung adenocarcinoma demonstrates how these network predictions could drive discovery of new biology.
As a generalizable framework for inferring miRNA-mediated regulation, FIRM will also benefit from simultaneous measurement of changes in miRNA and mRNA levels in patient tumors. However, negative correlation with gene-expression changes alone does not accurately identify bona fide targets for the miRNA (Liu et al. 2007; Ritchie et al. 2009; Wang et al. 2009). Thus, clustering of the gene expression data and subsequent analysis with FIRM will be necessary for the inference of accurate miRNA regulatory networks. Correlation with the putative miRNA regulators could be used post hoc as a secondary screen to filter the predicted list of targets and prioritize miRNAs for further experimental validation. We have demonstrated the power of this approach by performing targeted experiments to test predictions from the cancer–miRNA regulatory network. These experiments have discovered novel regulation of specific oncogenesis-associated genes by miRNAs that are shared across different cancer types. Importantly, in addition to providing mechanistic linkages between a known tumor-suppressor miRNA (miR-29) and regulation of specific genes with metastatic potential, we have also discovered a novel oncogenesis-associated miRNA (miR-767-5p). The choice of miRNAs for validating network predictions has also helped to highlight the sensitivity and specificity of FIRM performance. As such, we have not only demonstrated the extraordinary value of the cancer–miRNA network in cancer research; but also the power of FIRM to construct from easily generated gene-expression data similar miRNA regulatory networks for any disease.
Our plan for the future is to integrate inference of miRNA regulation into the clustering procedure. This will act as a constraint for accurate discovery of genes coregulated by the same miRNA. The cMonkey biclustering algorithm already incorporates de novo discovery of transcription-factor binding sites within gene promoters to limit the space of gene–gene associations to accurately discover sets of genes that are regulated by the same transcription factor (Reiss et al. 2006). The incorporation of constraints based on mechanisms of miRNA regulation will greatly improve the ability of cMonkey to model eukaryotic transcriptional regulatory networks. We predict that the ability of cMonkey to discover conditional coregulation of genes will increase the sensitivity of FIRM and also provide the context (disease type, stage of progression, etc.) for regulatory influence of a miRNA. This information will be invaluable for performing experimental tests of predictions of miRNA regulation in the right context.
Methods
De novo identification of 3′ UTR motifs
Sequences and RefSeq gene definition files were downloaded from the UCSC Genome Browser FTP site (ftp://hgdownload.cse.ucsc.edu/goldenPath/currentGenomes/Homo_sapiens). Details can be found in the Supplemental Methods. The Weeder de novo motif detection algoirthm (Pavesi et al. 2006) was then used to identify over-represented miRNA-binding sites in the 3′ UTR of putatively miRNA coregulated genes (Linhart et al. 2008; Fan et al. 2009).
miRvestigator identification of complementary miRNA for the 3′ UTR motif
MiRvestigator employs a hidden Markov model (HMM) to align and compute a probability describing the complementarity of a specific miRNA seed to a 3′ UTR motif (Plaisier et al. 2011). The miRvestigator HMM is described in detail in the Supplemental Methods. The 3′ UTR motif is first converted to a miRvestigator HMM and the Viterbi algorithm is used to provide a complementarity P-value by comparing the HMM to all potential seed sequences from miRBase. There are different models for the base-pairing of miRNA seeds to the complementary protein-coding transcript binding sites as described in Figure 1 (Brennecke et al. 2005; Bartel 2009). The significance of the complementarity for a given miRNA is then calculated by exhaustively computing the complete distribution of complementarity probabilities for all potential miRNA k-mer seed sequences (where k = 6, 7, or 8 bp). The miRNA(s) with the smallest complementarity P-value are considered the most likely to regulate the set of transcripts from which the 3′ UTR motif was derived.
Simulating synthetic motifs and 3′ UTRs sequences
Motifs were simulated based upon the reverse complement of the 8-bp seed sequence 5′-UGGAAUGU-3′ for miR-1 (MIMAT0000416). The miRNA seed signal determined the percent that the seed nucleotide was given in each column of the PSSM and the remaining signal was distributed randomly to the other three nucleotides. We simulated motifs with different entropies by adding between 10% and 75% noise at a 5% interval to each seed nucleotide position. A seed nucleotide signal of 25% is the random case, as one of the other three nucleotides is likely to have a higher frequency than the seed nucleotide. Thirty sequences were simulated by randomly sampling 8-mers from the distribution of 8-mers in 3′ UTRs and inserting an instance of the reverse complement of the miR-1 seed sequence at varying proportions (0%–100%). The receiver operating characteristic (ROC) area under the curve (AUC) was calculated using the ROCR package (Sing et al. 2005).
Assessing bias in the distribution of miRNA-binding sites
Instances of Weeder motif binding sites from either full transcripts (5′ UTR, coding sequence [CDS], 3′ UTR) or just 3′ UTRs of genes matching to the perturbed miRNA were identified for the compendium of experimentally determined miRNA target gene sets. Significance for the normalized counts per 1 Kbp was calculated for the distribution of matches in each gene region and for each experimentally determined miRNA target gene set by comparison with 1,000,000 randomly sampled gene sets of the same size. A combined P-value was computed by using Stouffer's Z-score method. The ROCR package was again used to compute ROC curves and ROC AUCs for each method. The pROC package was used to calculate the 95% confidence interval and pairwise P-values to determine if there is a significant difference between the ROC curves of the methods (Robin et al. 2011).
Identifying enriched predicted miRNA-binding sites
The PITA, TargetScan, miRanda, and miRSVR miRNA target gene-prediction databases were downloaded from their respective websites. The significance for enrichment of genes with a predicted miRNA-binding site was calculated using the hypergeometric P-value for each miRNA. The miRNA(s) with the smallest hypergeometric P-value are considered the most likely to regulate the signature. Multiple hypothesis testing correction was applied using the Benjamin-Hochberg approach for controlling the false discovery rate (FDR) equal to or less than 0.001 (FDR ≤ 0.001) and requiring at least 10% of the genes to be targeted by the specific miRNA.
Selecting optimal methods to infer the miRNA regulatory network
Each inference method was applied to the compendium of 50 miRNA target gene sets (Supplemental Table 2). The ROCR and pROC packages in R were used to compute ROC curves, ROC AUC, and P-values between ROC curves.
miR2Disease overlap
First, we created a mapping between the 46 cancer subtypes and the disease classifications in the manually curated miR2Disease database. Instances were then identified where an inferred miRNA regulator was previously observed to be dysregulated or causal in the same cancer type. Significance of the enrichment of overlap between miR2Disease and the cancer–-miRNA regulatory network was calculated using a hypergeometric P-value in R.
Functional enrichment and semantic similarity to hallmarks of cancer
Enrichment of GO biological process terms in each cancer coexpression signature were assessed using the topGO package in R (Alexa et al. 2006) by computing a hypergeometric P-value with the Benjamini-Hochberg correction (FDR ≤ 0.05). All GO terms passing the significance threshold for a coexpression signature were included in downstream analyses. Semantic similarity between a significantly enriched GO term and each hallmark of cancer was assessed by using the Jiang and Conrath similarity measure as implemented in the R package GOSim (Fröhlich et al. 2007). For each coexpression signature the similarity scores between its enriched GO terms and the GO terms for each hallmark of cancer was computed, and the maximum for each hallmark was returned. Similarity scores greater than or equal to 0.8 were considered sufficient for inferring a link between the enriched GO terms for a coexpression signature and a hallmark of cancer. Random sampling of 1000 GO terms and computing the Jiang and Conrath scores demonstrated that a similarity score ≥0.8 resulted in a permuted P-value ≤5.1 × 10⁻⁴.
miR-29 family coexpression signature overlaps
A hypergeometric P-value was used to test for significant overlap between the lung adenocarcinoma signature genes and the genes up-regulated by in vitro due to knock-down of miR-29 family miRNAs.
Luciferase reporter assay
The 3′ UTRs for genes of interest were amplified from cDNA (primers in Supplemental Table 12) and cloned into the pmirGLO Dual-Luciferase miRNA target expression vector behind firefly luciferase. The sequence and orientation for all 3′ UTRs inserted into pmirGLO were verified by sequencing. HEK293 cells were plated at a density of 100,000 cells per well and cotransfected in 96-well plates 24 h after plating. Cells were transfected using DharmaFect DUO (Dharmacon) with 75 ng of the 3′ UTR fused reporter vector and either 50 nM of miR-29a, miR-29b, miR-29c, miR-767-5p, or cel-miR-67 (negative control) miRNA mimic (Dharmacon). Twenty-four hours after transfection, firefly and renilla luciferase activities were measured using the Dual-Glo assay (Promega) on a Synergy H4 hybrid multimode microplate reader (BioTek) per manufacturer recommendations. Experiments were conducted in biological triplicates. Luminescence measurements were first background subtracted using a vehicle-only control, and then firefly luminescence was normalized to renilla luminescence. Experimental comparisons are made to vector only controls. Student's t-test and fold-changes were calculated using standard methods. MiRNA binding sites for MMP2 and SPARC were deleted using recombinant PCR (primers in Supplemental Table 12). Dose response curves for COL3A1 and SPARC were conducted using 50 nM, 5 nM, 500 pM, 50 pM, and 5 pM miRNA mimic concentrations.
Availability of miRvestigator, FIRM, and the cancer–miRNA regulatory network
MiRvestigator was developed as an open source project using the Python programming language and is available both as a web service (http://mirvestigator.systemsbiology.net) and as source code (http://github.com/cplaisier/miRvestigator) (Plaisier et al. 2011). The FIRM and cancer–miRNA regulatory network are freely available at http://cmrn.systemsbiology.net.
Data access
To facilitate reader access and usability we have developed and hosted a freely available website (http://cmrn.systemsbiology.net) containing (1) all data contained within the cancer–miRNA regulatory network, (2) including the compendium of 50 experimentally defined miRNA target gene sets, and (3) the FIRM framework to infer miRNA regulatory networks from gene coexpression information. Our hope is that this will provide cancer researchers with a usable interface to explore the cancer–miRNA regulatory network, computational biologists with a valuable resource to compare methods of inferring miRNA-mediated regulation, and researchers with the tools to infer miRNA-regulatory networks for their disease of interest. No public database submissions were relevant, and all algorithms and results reported in this manuscript are available at http://cmrn.systemsbiology.net.
Acknowledgments
This work was supported by grants from NIH (P50GM076547 and 1R01GM077398-01A2), DoE (DE-FG02-04ER64685), and NSF (DBI-0640950). We thank the Luxembourg Centre for Systems Biomedicine and the University of Luxembourg for support. We also thank Hani Goodarzi and Saeed Tavazoie for providing the 2240 clusters from the 46 cancer transcriptome profiling studies.
Author contributions: C.L.P. developed and conducted all studies. M.P. performed 3′ UTR cloning for luciferase assays. N.S.B. supervised the studies. C.L.P and N.S.B. wrote the paper.
Footnotes
[Supplemental material is available for this article.]
Article published online before print. Article, supplemental material, and publication date are at http://www.genome.org/cgi/doi/10.1101/gr.133991.111.
Freely available online through the Genome Research Open Access option.
References
- Alexa A, Rahnenführer J, Lengauer T 2006. Improved scoring of functional groups from gene expression data by decorrelating GO graph structure. Bioinformatics 22: 1600–1607 [DOI] [PubMed] [Google Scholar]
- Baek D, Villén J, Shin C, Camargo FD, Gygi SP, Bartel DP 2008. The impact of microRNAs on protein output. Nature 455: 64–71 [DOI] [PMC free article] [PubMed] [Google Scholar]
- Barabasi A-L, Albert R 1999. Emergence of scaling in random networks. Science 286: 509–512 [DOI] [PubMed] [Google Scholar]
- Bartel DP 2009. MicroRNAs: Target recognition and regulatory functions. Cell 136: 215–233 [DOI] [PMC free article] [PubMed] [Google Scholar]
- Beer DG, Kardia SLR, Huang C-C, Giordano TJ, Levin AM, Misek DE, Lin L, Chen G, Gharib TG, Thomas DG, et al. 2002. Gene-expression profiles predict survival of patients with lung adenocarcinoma. Nat Med 8: 816–824 [DOI] [PubMed] [Google Scholar]
- Betel D, Wilson M, Gabow A, Marks DS, Sander C 2008. The microRNA.org resource: Targets and expression. Nucleic Acids Res 36: D149–D153 [DOI] [PMC free article] [PubMed] [Google Scholar]
- Betel D, Koppal A, Agius P, Sander C, Leslie C 2010. Comprehensive modeling of microRNA targets predicts functional non-conserved and non-canonical sites. Genome Biol 11: R90 doi: 10.1186/gb-2010-11-80-r90 [DOI] [PMC free article] [PubMed] [Google Scholar]
- Bhattacharjee A, Richards WG, Staunton J, Li C, Monti S, Vasa P, Ladd C, Beheshti J, Bueno R, Gillette M, et al. 2001. Classification of human lung carcinomas by mRNA expression profiling reveals distinct adenocarcinoma subclasses. Proc Natl Acad Sci 98: 13790–13795 [DOI] [PMC free article] [PubMed] [Google Scholar]
- Boll K, Reiche K, Kasack K, Mörbt N, Kretzschmar AK, Tomm JM, Verhaegh G, Schalken J, von Bergen M, Horn F, et al. 2012. MiR-130a, miR-203 and miR-205 jointly repress key oncogenic pathways and are downregulated in prostate carcinoma. Oncogene doi: 10.1038/onc.2012.55 [DOI] [PubMed] [Google Scholar]
- Brennecke J, Stark A, Russell RB, Cohen SM 2005. Principles of microRNA-target recognition. PLoS Biol 3: e85 doi: 10.1371/journal.pbio.0030085 [DOI] [PMC free article] [PubMed] [Google Scholar]
- Brueckner B, Stresemann C, Kuner R, Mund C, Musch T, Meister M, Sültmann H, Lyko F 2007. The human let-7a-3 locus contains an epigenetically regulated microRNA gene with oncogenic function. Cancer Res 67: 1419–1423 [DOI] [PubMed] [Google Scholar]
- Ceppi M, Pereira PM, Dunand-Sauthier I, Barras E, Reith W, Santos MA, Pierre P 2009. MicroRNA-155 modulates the interleukin-1 signaling pathway in activated human monocyte-derived dendritic cells. Proc Natl Acad Sci 106: 2735–2740 [DOI] [PMC free article] [PubMed] [Google Scholar]
- Chang T-C, Wentzel EA, Kent OA, Ramachandran K, Mullendore M, Lee KH, Feldmann G, Yamakuchi M, Ferlito M, Lowenstein CJ, et al. 2007. Transactivation of miR-34a by p53 broadly influences gene expression and promotes apoptosis. Mol Cell 26: 745–752 [DOI] [PMC free article] [PubMed] [Google Scholar]
- Chung CH, Parker JS, Karaca G, Wu J, Funkhouser WK, Moore D, Butterfoss D, Xiang D, Zanation A, Yin X, et al. 2004. Molecular classification of head and neck squamous cell carcinomas using patterns of gene expression. Cancer Cell 5: 489–500 [DOI] [PubMed] [Google Scholar]
- Cushing L, Kuang PP, Qian J, Shao F, Wu J, Little F, Thannickal VJ, Cardoso WV, Lü J 2011. miR-29 is a major regulator of genes associated with pulmonary fibrosis. Am J Respir Cell Mol Biol 45: 287–294 [DOI] [PMC free article] [PubMed] [Google Scholar]
- Dalmay T, Edwards DR 2006. MicroRNAs and the hallmarks of cancer. Oncogene 25: 6170–6175 [DOI] [PubMed] [Google Scholar]
- Fan D, Bitterman PB, Larsson O 2009. Regulatory element identification in subsets of transcripts: Comparison and integration of current computational methods. RNA 15: 1469–1482 [DOI] [PMC free article] [PubMed] [Google Scholar]
- Fasanaro P, Greco S, Lorenzi M, Pescatori M, Brioschi M, Kulshreshtha R, Banfi C, Stubbs A, Calin GA, Ivan M, et al. 2009. An integrated approach for experimental target identification of hypoxia-induced miR-210. J Biol Chem 284: 35134–35143 [DOI] [PMC free article] [PubMed] [Google Scholar]
- Frankel LB, Christoffersen NR, Jacobsen A, Lindow M, Krogh A, Lund AH 2008. Programmed cell death 4 (PDCD4) is an important functional target of the microRNA miR-21 in breast cancer cells. J Biol Chem 283: 1026–1033 [DOI] [PubMed] [Google Scholar]
- Friedman RC, Farh KK-H, Burge CB, Bartel DP 2009. Most mammalian mRNAs are conserved targets of microRNAs. Genome Res 19: 92–105 [DOI] [PMC free article] [PubMed] [Google Scholar]
- Fröhlich H, Speer N, Poustka A, Beissbarth T 2007. GOSim–an R-package for computation of information theoretic GO similarities between terms and gene products. BMC Bioinformatics 8: 166 doi: 10.1186/1471-2106-8-166 [DOI] [PMC free article] [PubMed] [Google Scholar]
- Garofalo M, Croce CM 2011. microRNAs: Master regulators as potential therapeutics in cancer. Annu Rev Pharmacol Toxicol 51: 25–43 [DOI] [PubMed] [Google Scholar]
- Georges SA, Biery MC, Kim S-Y, Schelter JM, Guo J, Chang AN, Jackson AL, Carleton MO, Linsley PS, Cleary MA, et al. 2008. Coordinated regulation of cell cycle transcripts by p53-inducible microRNAs, miR-192 and miR-215. Cancer Res 68: 10105–10112 [DOI] [PubMed] [Google Scholar]
- Goodarzi H, Elemento O, Tavazoie S 2009. Revealing global regulatory perturbations across human cancers. Mol Cell 36: 900–911 [DOI] [PMC free article] [PubMed] [Google Scholar]
- Grimson A, Farh KK-H, Johnston WK, Garrett-Engele P, Lim LP, Bartel DP 2007. MicroRNA targeting specificity in mammals: Determinants beyond seed pairing. Mol Cell 27: 91–105 [DOI] [PMC free article] [PubMed] [Google Scholar]
- Hanahan D, Weinberg RA 2000. The hallmarks of cancer. Cell 100: 57–70 [DOI] [PubMed] [Google Scholar]
- Hanahan D, Weinberg RA 2011. Hallmarks of cancer: The next generation. Cell 144: 646–674 [DOI] [PubMed] [Google Scholar]
- Hausser J, Berninger P, Rodak C, Jantscher Y, Wirth S, Zavolan M 2009. MirZ: An integrated microRNA expression atlas and target prediction resource. Nucleic Acids Res 37: W266–W272 [DOI] [PMC free article] [PubMed] [Google Scholar]
- He L, He X, Lim LP, de Stanchina E, Xuan Z, Liang Y, Xue W, Zender L, Magnus J, Ridzon D, et al. 2007. A microRNA component of the p53 tumour suppressor network. Nature 447: 1130–1134 [DOI] [PMC free article] [PubMed] [Google Scholar]
- Hendrickson DG, Hogan DJ, Herschlag D, Ferrell JE, Brown PO 2008. Systematic identification of mRNAs recruited to argonaute 2 by specific microRNAs and corresponding changes in transcript abundance. PLoS ONE 3: e2126 doi: 10.1371/journal.pone.0002126 [DOI] [PMC free article] [PubMed] [Google Scholar]
- Jiang Q, Wang Y, Hao Y, Juan L, Teng M, Zhang X, Li M, Wang G, Liu Y 2009. miR2Disease: A manually curated database for microRNA deregulation in human disease. Nucleic Acids Res 37: D98–D104 [DOI] [PMC free article] [PubMed] [Google Scholar]
- Johnson CD, Esquela-Kerscher A, Stefani G, Byrom M, Kelnar K, Ovcharenko D, Wilson M, Wang X, Shelton J, Shingara J, et al. 2007. The let-7 microRNA represses cell proliferation pathways in human cells. Cancer Res 67: 7713–7722 [DOI] [PubMed] [Google Scholar]
- Karginov FV, Conaco C, Xuan Z, Schmidt BH, Parker JS, Mandel G, Hannon GJ 2007. A biochemical approach to identifying microRNA targets. Proc Natl Acad Sci 104: 19291–19296 [DOI] [PMC free article] [PubMed] [Google Scholar]
- Kertesz M, Iovino N, Unnerstall U, Gaul U, Segal E 2007. The role of site accessibility in microRNA target recognition. Nat Genet 39: 1278–1284 [DOI] [PubMed] [Google Scholar]
- Kozomara A, Griffiths-Jones S 2011. miRBase: Integrating microRNA annotation and deep-sequencing data. Nucleic Acids Res 39: D152–D157 [DOI] [PMC free article] [PubMed] [Google Scholar]
- Lal A, Thomas MP, Altschuler G, Navarro F, O'Day E, Li XL, Concepcion C, Han Y-C, Thiery J, Rajani DK, et al. 2011. Capture of microRNA-bound mRNAs identifies the tumor suppressor miR-34a as a regulator of growth factor signaling. PLoS Genet 7: e1002363 doi: 10.1371/journal.pgen.1002363 [DOI] [PMC free article] [PubMed] [Google Scholar]
- Landi MT, Zhao Y, Rotunno M, Koshiol J, Liu H, Bergen AW, Rubagotti M, Goldstein AM, Linnoila I, Marincola FM, et al. 2010. MicroRNA expression differentiates histology and predicts survival of lung cancer. Clin Cancer Res 16: 430–441 [DOI] [PMC free article] [PubMed] [Google Scholar]
- Lim LP, Lau NC, Garrett-Engele P, Grimson A, Schelter JM, Castle J, Bartel DP, Linsley PS, Johnson JM 2005. Microarray analysis shows that some microRNAs downregulate large numbers of target mRNAs. Nature 433: 769–773 [DOI] [PubMed] [Google Scholar]
- Linhart C, Halperin Y, Shamir R 2008. Transcription factor and microRNA motif discovery: The Amadeus platform and a compendium of metazoan target sets. Genome Res 18: 1180–1189 [DOI] [PMC free article] [PubMed] [Google Scholar]
- Linsley PS, Schelter J, Burchard J, Kibukawa M, Martin MM, Bartz SR, Johnson JM, Cummins JM, Raymond CK, Dai H, et al. 2007. Transcripts targeted by the microRNA-16 family cooperatively regulate cell cycle progression. Mol Cell Biol 27: 2240–2252 [DOI] [PMC free article] [PubMed] [Google Scholar]
- Liu T, Papagiannakopoulos T, Puskar K, Qi S, Santiago F, Clay W, Lao K, Lee Y, Nelson SF, Kornblum HI, et al. 2007. Detection of a microRNA signal in an in vivo expression set of mRNAs. PLoS ONE 2: e804 doi: 10.1371/journal.pone.0000804 [DOI] [PMC free article] [PubMed] [Google Scholar]
- Malzkorn B, Wolter M, Liesenberg F, Grzendowski M, Stühler K, Meyer HE, Reifenberger G 2010. Identification and functional characterization of microRNAs involved in the malignant progression of gliomas. Brain Pathol 20: 539–550 [DOI] [PMC free article] [PubMed] [Google Scholar]
- Muniyappa MK, Dowling P, Henry M, Meleady P, Doolan P, Gammell P, Clynes M, Barron N 2009. MiRNA-29a regulates the expression of numerous proteins and reduces the invasiveness and proliferation of human carcinoma cell lines. Eur J Cancer 45: 3104–3118 [DOI] [PubMed] [Google Scholar]
- Nana-Sinkam SP, Croce CM 2011. MicroRNAs as therapeutic targets in cancer. Transl Res 157: 216–225 [DOI] [PubMed] [Google Scholar]
- Ozen M, Creighton CJ, Ozdemir M, Ittmann M 2008. Widespread deregulation of microRNA expression in human prostate cancer. Oncogene 27: 1788–1793 [DOI] [PubMed] [Google Scholar]
- Pavesi G, Mereghetti P, Zambelli F, Stefani M, Mauri G, Pesole G 2006. MoD Tools: Regulatory motif discovery in nucleotide sequences from co-regulated or homologous genes. Nucleic Acids Res 34: W566–W570 [DOI] [PMC free article] [PubMed] [Google Scholar]
- Plaisier CL, Bare JC, Baliga NS 2011. miRvestigator: Web application to identify miRNAs responsible for co-regulated gene expression patterns discovered through transcriptome profiling. Nucleic Acids Res 39: W125–W131 [DOI] [PMC free article] [PubMed] [Google Scholar]
- Reiss DJ, Baliga NS, Bonneau R 2006. Integrated biclustering of heterogeneous genome-wide datasets for the inference of global regulatory networks. BMC Bioinformatics 7: 280 doi: 10.1186/1471-2105-7-280 [DOI] [PMC free article] [PubMed] [Google Scholar]
- Ritchie W, Rajasekhar M, Flamant S, Rasko JEJ 2009. Conserved expression patterns predict microRNA targets. PLoS Comput Biol 5: e1000513 doi: 10.1371/journal.pcbi.1000513 [DOI] [PMC free article] [PubMed] [Google Scholar]
- Robin X, Turck N, Hainard A, Tiberti N, Lisacek F, Sanchez J-C, Müller M 2011. pROC: An open-source package for R and S+ to analyze and compare ROC curves. BMC Bioinformatics 12: 77 doi: 10.1186/1471-2105-12-77 [DOI] [PMC free article] [PubMed] [Google Scholar]
- Rothschild SI, Tschan MP, Federzoni EA, Jaggi R, Fey MF, Gugger M, Gautschi O 2012. MicroRNA-29b is involved in the Src-ID1 signaling pathway and is dysregulated in human lung adenocarcinoma. Oncogene doi: 10.1038/onc.2011.578 [DOI] [PubMed] [Google Scholar]
- Ruan K, Fang X, Ouyang G 2009. MicroRNAs: Novel regulators in the hallmarks of human cancer. Cancer Lett 285: 116–126 [DOI] [PubMed] [Google Scholar]
- Selbach M, Schwanhäusser B, Thierfelder N, Fang Z, Khanin R, Rajewsky N 2008. Widespread changes in protein synthesis induced by microRNAs. Nature 455: 58–63 [DOI] [PubMed] [Google Scholar]
- Sengupta S, den Boon JA, Chen I-H, Newton MA, Stanhope SA, Cheng Y-J, Chen C-J, Hildesheim A, Sugden B, Ahlquist P 2008. MicroRNA 29c is down-regulated in nasopharyngeal carcinomas, up-regulating mRNAs encoding extracellular matrix proteins. Proc Natl Acad Sci 105: 5874–5878 [DOI] [PMC free article] [PubMed] [Google Scholar]
- Sethupathy P, Megraw M, Hatzigeorgiou AG 2006. A guide through present computational approaches for the identification of mammalian microRNA targets. Nat Methods 3: 881–886 [DOI] [PubMed] [Google Scholar]
- Sing T, Sander O, Beerenwinkel N, Lengauer T 2005. ROCR: Visualizing classifier performance in R. Bioinformatics 21: 3940–3941 [DOI] [PubMed] [Google Scholar]
- Tan LP, Seinen E, Duns G, de Jong D, Sibon OCM, Poppema S, Kroesen B-J, Kok K, van den Berg A 2009. A high throughput experimental approach to identify miRNA targets in human cells. Nucleic Acids Res 37: e137 doi: 10.1093/nar/gkp715 [DOI] [PMC free article] [PubMed] [Google Scholar]
- Tsai W-C, Hsu PW-C, Lai T-C, Chau G-Y, Lin C-W, Chen C-M, Lin C-D, Liao Y-L, Wang J-L, Chau Y-P, et al. 2009. MicroRNA-122, a tumor suppressor microRNA that regulates intrahepatic metastasis of hepatocellular carcinoma. Hepatology 49: 1571–1582 [DOI] [PubMed] [Google Scholar]
- Vaira V, Faversani A, Dohi T, Montorsi M, Augello C, Gatti S, Coggi G, Altieri DC, Bosari S 2012. miR-296 regulation of a cell polarity-cell plasticity module controls tumor progression. Oncogene 31: 27–38 [DOI] [PMC free article] [PubMed] [Google Scholar]
- Valastyan S, Reinhardt F, Benaich N, Calogrias D, Szász AM, Wang ZC, Brock JE, Richardson AL, Weinberg Robert A 2009. A pleiotropically acting microRNA, miR-31, inhibits breast cancer metastasis. Cell 137: 1032–1046 [DOI] [PMC free article] [PubMed] [Google Scholar] [Retracted]
- Wang X, Wang X 2006. Systematic identification of microRNA functions by combining target prediction and expression profiling. Nucleic Acids Res 34: 1646–1652 [DOI] [PMC free article] [PubMed] [Google Scholar]
- Wang L, Oberg AL, Asmann YW, Sicotte H, McDonnell SK, Riska SM, Liu W, Steer CJ, Subramanian S, Cunningham JM, et al. 2009. Genome-wide transcriptional profiling reveals microRNA-correlated genes and biological processes in human lymphoblastoid cell lines. PLoS ONE 4: e5878 doi: 10.1371/journal.pone.0005878 [DOI] [PMC free article] [PubMed] [Google Scholar]
- Wang W-X, Wilfred BR, Hu Y, Stromberg AJ, Nelson PT 2010. Anti-argonaute RIP-Chip shows that miRNA transfections alter global patterns of mRNA recruitment to microribonucleoprotein complexes. RNA 16: 394–404 [DOI] [PMC free article] [PubMed] [Google Scholar]
- Weber F, Teresi RE, Broelsch CE, Frilling A, Eng C 2006. A limited set of human MicroRNA is deregulated in follicular thyroid carcinoma. J Clin Endocrinol Metab 91: 3584–3591 [DOI] [PubMed] [Google Scholar]
- Welsh JB, Zarrinkar PP, Sapinoso LM, Kern SG, Behling CA, Monk BJ, Lockhart DJ, Burger RA, Hampton GM 2001. Analysis of gene expression profiles in normal and neoplastic ovarian tissue samples identifies candidate molecular markers of epithelial ovarian cancer. Proc Natl Acad Sci 98: 1176–1181 [DOI] [PMC free article] [PubMed] [Google Scholar]
- Yanaihara N, Caplen N, Bowman E, Seike M, Kumamoto K, Yi M, Stephens RM, Okamoto A, Yokota J, Tanaka T, et al. 2006. Unique microRNA molecular profiles in lung cancer diagnosis and prognosis. Cancer Cell 9: 189–198 [DOI] [PubMed] [Google Scholar]
- Zen K, Zhang C-Y 2012. Circulating MicroRNAs: A novel class of biomarkers to diagnose and monitor human cancers. Med Res Rev 32: 326–348 [DOI] [PubMed] [Google Scholar]