Abstract
Structural data about the human lung fine structure are mainly based on stereological methods applied to serial sections. As these methods utilize 2D images, which are often not contiguous, they suffer from inaccuracies which are overcome by analysis of 3D micro-CT images of the never-sectioned specimen. The purpose of our study was to generate a complete data set of the intact 3-dimensional architecture of the human acinus using high-resolution synchrotron-based micro-CT (synMCT). A human lung was inflation-fixed by formaldehyde ventilation and then scanned in a 64-slice CT over its apex to base extent. Lung samples (8-mm diameter, 10-mm height, n = 12) were punched out, stained with osmium tetroxide, and scanned using synMCT at (4μm)3 voxel size. The lung functional unit (acinus, n = 8) was segmented from the 3D tomographic image using an automated tree-analysis software program. Morphometric data of the lung were analyzed by ANOVA. Intraacinar airways branching occurred over 11 generations. The mean acinar volume was 131.3 ± 29.2 mm3 (range 92.5 – 171.3 mm3) and the mean acinar surface was calculated with 1012 ± 26 cm2. The airway internal diameter (starting from the bronchiolus terminalis) decreases distally from 0.66 ± 0.04 mm to 0.34 ± 0.06 mm (p < 0.001) and remains constant after the 7th generation (p < 0.5). The length of each generation ranges between 0.52 – 0.93 mm and did not show significant differences between the second and 11th generation. The branching angle between daughter branches varies between 113–134° without significant differences between the generations (p < 0.3). This study demonstrates the feasibility of quantitating the 3D structure of the human acinus at the spatial resolution readily achievable using synMCT.
Keywords: Imaging, Human Lung, Acinus, Micro-CT
INTRODUCTION
By forming about 300 million alveoli as outpocketings of the most peripheral airways, a very large inner surface is established in the lung parenchyma (Weibel, 1997a). The functional units of gas exchange consist of alveoli which are organized in acini (Loeschke, 1921). It is estimated that the human lung consists of about 30,000 of these units (Weibel, 1997b). The human airway can be considered as a branching tree (Weibel, 1997b) which branches by irregular dichotomy and is divided into the conducting airways (carrying air to the lung parenchyma) and the intra-acinar airways (the gas exchange region of the lung). The branching architecture of the conductive airways is well-described (Haefeli-Bleuer and Weibel, 1988; Weibel, 1981; Raskin, 1982). At the end of each conducting airway is the terminal bronchiole (branching generation #14). The complex of alveolated airways connected distal to the first-order respiratory (or transitional) bronchiole forms the acinus. It starts with the first bronchiole carrying alveolar outpockets in its wall (anatomically the respiratory bronchiole followed by several more generations of airways out to the periphery (Rodriguez, Bur, Favre, and Weibel, 1987).
In the human lung some 10,000 alveoli are contained in one acinus. The intra-acinar airways branch by irregular dichotomy over an average of nine generations but with a range of between six and the twelve generations (Weibel, 1997b). The arrangement in three-dimensional space is such that the alveolar membrane forms a highly irregular surface (Felici, Filoche, and Sapoval, 2003). In contrast to the conducting airways, the intra-acinar airways are formed by entrance rings of alveoli opening into a common passageway (Tsuda, Filipovic, Haberthur, Dickie, Matsui, Stampanoni, and Schittny, 2008). It is the lung unit that provides the gas exchange.
Detailed 3D anatomical data about the human lung fine structure are difficult to obtain because of the complex 3D geometry and fragile thin alveolar walls which can result in tears and distortions during histological sectioning. As a consequence the accurate registration of contiguous slices is impaired and can result in distortions and incomplete imaging of the deduced 3D micro- anatomy. Micro-CT imaging has overcome most of these limitations. Recently, using rats, Schittny, Tsuda and co-workers demonstrated the potential of synchrotron-based micro-CT to quantitate the formation of alveolar septa (Schittny, Mund, and Stampanoni, 2008; Tsuda, Filipovic, Haberthur, Dickie, Matsui, Stampanoni, and Schittny, 2008). Recently, micro-CT’s feasibility has been demonstrated to visualize and quantify structural alterations in the mouse (Parameswaran, Bartolak-Suki, Hamakawa, Majumdar, Allan, and Suki, 2009), pig (Litzlbauer, Neuhaeuser, Moell, Greschus, Breithecker, Franke, Kummer, and Rau, 2006) and human lung (Watz, Breithecker, Rau, and Kriete, 2005), although the latter did not involve any quantitative analysis.
MATERIAL and METHODS
Lung Preparation
The human lung was obtained by autopsy from a male patient (age 40 years) who died of sudden heart arrest. The patient was a non-smoker and had no pulmonary history. Lung tissue, obtained for diagnostic purposes from approved autopsy was studied. The study fulfilled the requirements of the State Ministry of Science and Arts and the Heads of the Departments of Radiology and Pathology approved the study.
In gross pathology the lung showed areas of cardiogenic pulmonary edema and areas of normal lung.
The human lung was connected to a tube of a modified Engstrom-type respirator. After inflation to a peak airway pressure of 40 cmH2O for 40 s, the lung was ventilated in a volume-controlled, pressure-limited mode with a positive end-expiratory pressure of 5 cmH2O. The peak pressure was limited to 35 cmH2O. Tidal volume was adjusted to reach full lung inflation, respiration rate was set at 12/min, and the inspiratory-to-expiratory ratio was 1:2. Fixation occurred by ventilating the lung with formaldehyde vapor. The fixation process lasted 6 h. It resulted in an air-filled lung preparation with inflated alveoli. This system was described in detail recently (Litzlbauer, Neuhaeuser, Moell, Greschus, Breithecker, Franke, Kummer, and Rau, 2006).
64-slice CT and Assembling of Tissue Specimens
After fixation, the entire lung was scanned using a 64-slice CT scanner (Definition, Siemens, Erlangen, Germany) to allow selection of areas without edema for further preparation. Lungs were cut into parallel transverse slices of 10-mm thick. With the use of a sharp mechanical hollow punch cylindrical samples (n = 12; diameter 8 mm, height 10 mm) were removed from subpleural locations in areas without visible edema on CT images. The CT finding of normal lung was corroborated by histology.
Micro-Computed Tomography (Micro-CT)
For analysis of the lung fine structure, samples were scanned at the micro-CT scanner at the X2B beamline of the National Synchrotron Light Source (NSLS) at the Brookhaven National Laboratories (Ritman, Jorgenson, Lund, Thomas, Dunsmuir, Romero, Turner, and Bolander, 1997). All samples were scanned under identical conditions at 16 KeV photon energy with 50 eV bandwidth. The 3-D images consisted of approximately 3000 2-D slices each with a 2000 × 2000 in-plane data matrix, yielding a 3.9 μm isotropic voxel resolution with 16-bit gray levels.
3D airway analysis
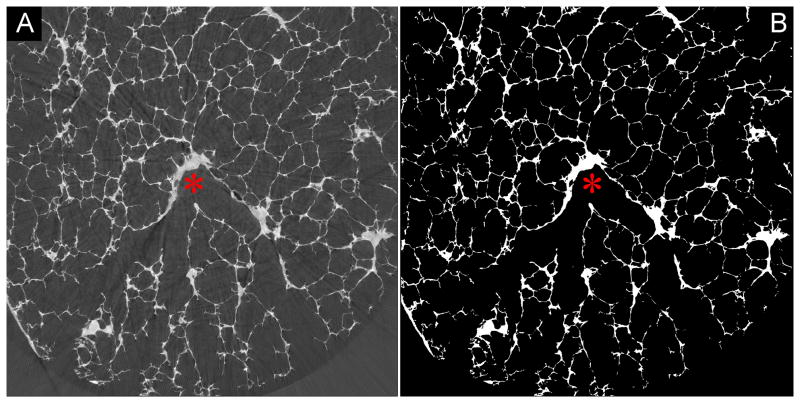
The first step involved creating a binary representation of the 3D image. Simple thresholding was deemed appropriate to generate these files. We used the CT value at the nadir between the two peaks as an objective selection criterion for the grey scale threshold separating the parenchyma from the air. Figure I (supplemental material, Figure I) shows that the selection of threshold CT value can greatly influence the estimate of parenchymal volume (and by implication the surface area and linear dimensions such as alveolare wall thickness). The dark grey corresponding to CT values less than the threshold separating the two peaks were set to zero, CT values greater than this threshold were set to ones. The resulting binary grey-scale image is shown in Figure 1. Due to the alveolar walls being only a few voxels thick, the grey scale of the wall can locally be decreased due to the partial volume effect, ie a voxel straddles the air adjacent to the wall and the wall,. Thus the selected threshold value may cause false “holes” to appear in the binary image of the parenchyma. These holes were sealed by adding a single binary voxel to the surface of the parenchyma, thereby closing most of those false holes. Subsequent erosion of the image returned the surface to its original location and left “holes” less than 3 voxels diameter closed.
Figure 1.
Full gray-scale synchrotron-based micro-CT image showing a branching conductive airway (red asterix). From that starting point, the slices were binarized (B) and the branching acinus segmented.
The outside surface of the binary files were next subjected to a “shrink-wrap” algorithm, so as to seperate the inner air pathway from the air outside of the lung disuse in the 3D image. This was followed by a centerline extraction algorithm (Kline, Ritman, 2009). The centerline allowed the acinus to be characterized in terms of a hierarchical branching structure, delineating individual segments at bifurcations.
Micro-CT image analysis
The branching angle, longitudinal length and number of segments of each generation of the centerline and also individual segment volumes, surface areas, lengths, and diameters were measured applying the ANALYZE software program (ANALYZE 9.0, Mayo Clinic College of Medicine, Rochester, USA) to the binarized volume data sets. The surface area was calculated by computing the distance between adjacent airway surface voxel indices (airway voxels touching lung tissue voxels and thus located on the airway segments surface).
Histology
On completion of the micro-CT scans all samples were embedded in paraffin for subsequent histology. Tissue blocks were sectioned at 2 mm intervals to provide 6 μm thick sections which were then stained with hematoxylin and eosin.
Statistical Analysis
Statistical analysis was performed with JMP 6.0. Differences between the measurements between the segments of the 8 analyzed acini were performed by using One-way ANOVA and Tukey-Kramer test. Statistical significance was considered for values of p < 0.05. Results illustrated in figures 4,5 and 7 are represented as box plots, displaying the mean of the data and the range (25th, 50th and 75th percentiles and the minimum and maximum value. For more information on this methology presenting the data, please refer to: http://www.math.sfu.ca/~cschwarz/Stat-301/Handouts/node35.html).
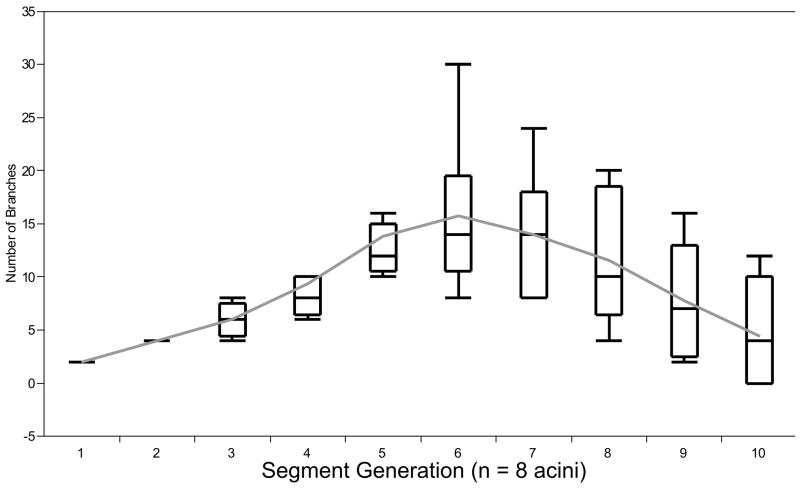
Figure 4.
Distribution of the number of branches in relation to the acinar segments. Note that the number of branches increases up to the 6th segment and then continuously decreases to the 10th segment (Box plot; please refer to Statistics).
RESULTS
Branching Pattern and Morphometric Data of Acinar Airways
Using the binarized 3D synchrotron-based micro-CT slices, the acinus was segmented starting at the transitional bronchiole. Figure 3 demonstrates the segmentation of the acinus from the volume data sets.
Figure 3.
A, Axial single-slice micro-CT at (4 μm)3 voxel size with a bronchiolus terminalis (red star). B, After binarization, the connected space (B) (acinus) was segmented from the volume data set (C).
Acinar volume, acinar surface and number of branching segments
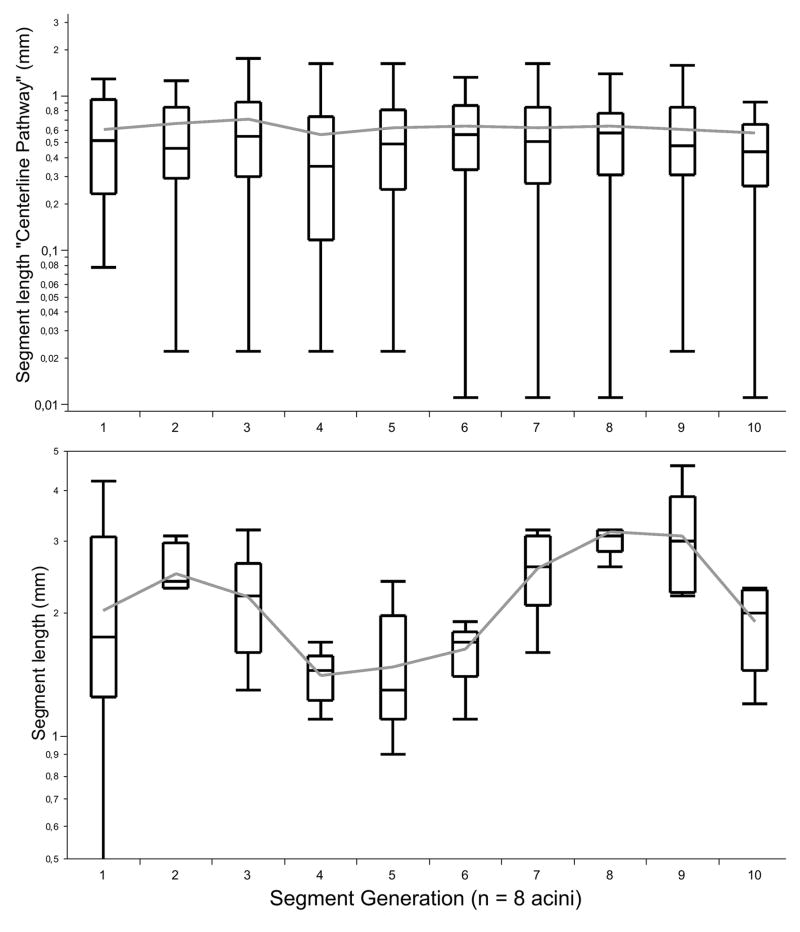
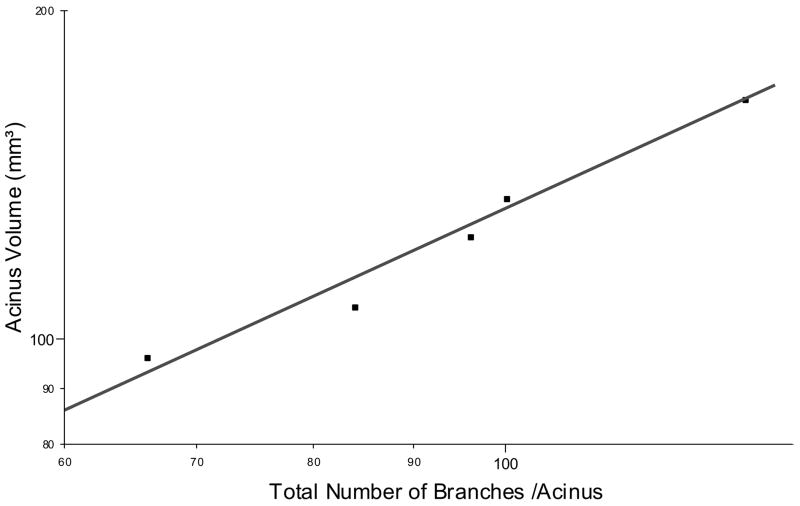
The mean acinar volume was measured to be 131.3 ± 29.2 mm3 (range 92.5 – 171.3 mm3) and the mean acinar surface area was calculated to be 112 ± 26 cm2. The mean number of segments in each acinus was 43 ± 10. The number of branches shows significant variations between the segments. Between segments # 3 to 9 a steady increase of branches is present in our reconstructed acini (Figure 4). This finding is independent of the segment length (p < 0.3; Figure 5). The number of segments is related to volume of the acinus (r2 = 0.96; Fig 6).
Figure 5.
Differences in the segment length and each branching generation in the human acinus (Box plot; please refer to Statistics).
Figure 6.
This is a log/log plot showing the number of branches related to the acinus volume (n = 8, r = 0.96).
Longitudinal pathway length
The longitudinal pathway length is the distance from the start of alveolization in the first respiratory bronchiole to the end of the alveolar sacs, including the last alveoli, measured along the branching tree (along the centerline). It is obtained by summing all the segment lengths that are connected along the centerline. The mean longitudinal pathway length has to be different depending on the acinar volume.
The mean longitudinal pathway length (within each segment) was calculated with 0.638 ± 0.55 mm (range 0.02 – 3.75 mm). By adding all analysed mean longitudinal pathway lengths, we calculated each complete pathway to be 7.45 ± 0.63 mm long.
Segment length and branching angles
The length of each segment ranges between 0.52 – 0.93 mm and did not show significant differences between the segments (p < 0.2; Table 1, Figure 4). The branching angle varied between 113°–134° without significant differences between each segment (Table 1; p < 0.3).
Table 1.
Branching Dimensions of the Segmented Acinus
|
|
||||
|---|---|---|---|---|
| Generation | Length (mm) | Surface (mm2) | Angle | Mean Number of Branches |
| 1 (Bronchus terminalis) | 0.93 ± 0.43 | 0.53 ± 0.3 | 113.1± 37.5 | - |
| 2 | 0.61 ± 0.41 | 0,4 ± 0.19 | 125.2 ± 42.9 | 2 |
| 3 | 0.66 ± 0.61 | 0,39 ± 0.18 | 126.4 ± 24.5 | 4 |
| 4 | 0.71 ± 0.49 | 0,28 ± 0.16 | 128.1 ± 31.8 | 6 |
| 5 | 0.55 ± 0.58 | 0,23 ± 0,18 | 125.7 ± 32.1 | 9.3 |
| 6 | 0.62 ± 0.51 | 0,22 ± 0,17 | 124.6 ± 25.5 | 13.7 |
| 7 | 0.64 ± 0.47 | 0.2 ± 0.15 | 129.4 ± 30.4 | 15.7 |
| 8 | 0.52 ± 0.51 | 0,19 ± 0.1 | 127.5 ± 29.3 | 14 |
| 9 | 0.64 ± 0.47 | 0.2 ± 0.12 | 129.8 ± 26.3 | 11.5 |
| 10 | 0.61 ± 0.45 | 0.18 ± 0.11 | 125.5 ± 29.4 | 7.7 |
| 11 | 0.58 ± 0.49 | 0.15 ± 0.11 | 134.2 ± 19.3 | 4.5 |
Inner and outer diameter of the segments - inner surface of the segments
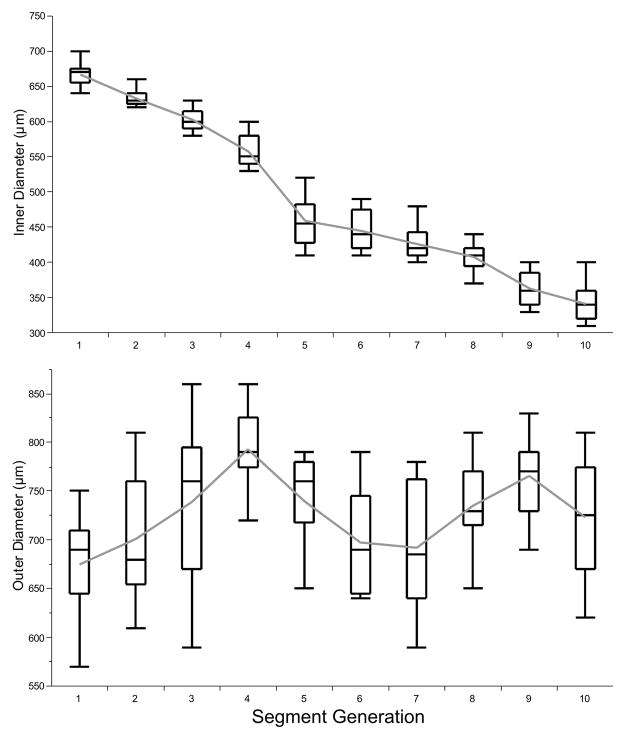
The internal airway diameter (starting from the transitional bronchiole) decreased from 0.66 ± 0.04 mm to 0.34 ± 0.06 mm (p < 0.001) and remained constant after the 7th segment (p < 0.5, Figure 5). The outer diameter was calculated with a mean of 0.75 mm (range from 0.67 to 0.79 mm) and did not show a linear relation to the segments (Figure 7).
Figure 7.
Relation inner- and outer diameter showing significant differences between the segments (Box plot; please refer to Statistics).
DISCUSSION
Our results on acinus dimensions agree reasonably well with the published histology-based estimates. Consequently our findings support our contention that micro-CT can provide such data in a more routine fashion so that variation within a lung as well as between lungs can be examined quantitatively and thereby facilitate discovery of systematic features in airway geometry related to various disease processes or susceptibilities.
Histology, a standard method to study lung architecture has several limitations, i.e. serial sectioning of multiple thin slices from tissue specimen is slow, expensive and can distort the micro-anatomy. Once sliced, the intact volume is lost so that further examinations by other methods are difficult or impossible. Although histology can be used to provide three-dimensional views of lung micro-architecture by assembling the contiguous serial sections, the anatomic registration of adjacent sections can be difficult. None-the-less, Weibel and coworkers quantified the branching pattern of the human acinus using serial-slicing histology (Weibel, 1979; Weibel, 1983; Weibel, 1986). A common method for studying the pattern of airway branching involved generating a resin or silicon rubber cast of the airway (Weibel, 1979; Haefeli-Bleuer and Weibel, 1988; Phalen, Oldham, Beaucage, Crocker, and Mortensen, 1985). These casts were examined by microscopy or electron microscopy. The instillation of silicon rubber often results in incomplete filling, especially of the distal airways. Thus filling of the acini and the alveoli using this approach often is inadequate. To dissect the acini correctly from the conductive airways it is crucial to identify the first alveolar outpockets in the bronchiolar walls. After dissecting the elements the further preparation for scanning electron microscopy in order to perform morphometric measurements is difficult and is comprised by mechanical alteration and tissue destruction caused by the preparation. However, there is no question that formaldehyde fixation also alters lung tissue, despite constant total lung volumes in our study. Proteins (e.g., collagen, elastin) are denaturated and the tissue is dehydrated. As a consequence, lung tissue loses elasticity, and an average volume loss of up to 20% has been attributed to formaldehyde fixation (Lum and Mitzner, 1985).
The quality of morphometric analysis using micro-CT is affected by the spatial resolution and the segmentation of the grey-scale images, such as converting it to a binary representation of the tissue. This is achieved by a grey-scale thresholding procedure which is affected by the partial-volume effect. Due to the irregular dichotomy of the airway, the dimensions of the daughter branches differ so that the terminations occur at different generations along different pathways. The inequality of dimensions is also associated with variation on branching angles. The branching angle, from the “mother’ segment, is found to be proportional to the diameter of the daughter: a very small branch will take off at almost a right angle from the parent, whereas the other daughter, whose diameter remains large, deviates only slightly from the direction of the parent (Phalen, Yeh, Schum, and Raabe, 1978).
The analysis of airway branching within the acinus proceeds much along the same pattern (Haefeli-Bleuer and Weibel, 1988).
Studying silicon rubber casts Haefeli-Bleuer and Weibel found a mean volume of the human acinus of 187 ± 79 mm3 (variation between 50 to 400 mm3) (3). Using serial reconstructions Hansen and Ampaya calculated a very similar acinar volume of 182.8 mm3 (Hansen and Ampaya, 1975). In our study the volume of the acinus was slightly lower (between 96 and 166 mm3, averaging 125 ± 27 mm3). However, the surface of the acinus (109 ± 23 cm2) was higher compared to histomorphometric analysis (69 ± 23 cm2).
So far, quantitative analysis of the human lung typically is done by means of light microscopy on thin histological sections. One problem with this approach is the difficulty in obtaining adjacent slices and distortions that occur during the sectioning process. Histologic microscopy is also limited in that it does not provide three-dimensional information and - as a dissecting technique – it does not allow continuous measurements, limiting tissue quantification to a small number of two-dimensional sections. Additionally, only a few micrometers of the lung can be analysed histologically. With micro-CT imaging, a complete digital data set of the human lung specimen is now available. As a non-destructive approach, micro-CT allows analysis of the acinus characteristics such as volume, branching, segment length and surface, over the entire length of the investigated segment.
Intra-acinar airways branch by irregular dichotomy over an average of 9 generations. Within an average acinus the branching terminates in between sixth and twelfth generations. With progressive branching, the inner diameter of the acinar airways (the duct without the alveoli) decreases gradually from 500 to 300 μm whereas the outer diameter (including the alveoli) is around 700 μm and does not decrease to the periphery (Haefeli-Bleuer and Weibel, 1988). In our study the inner diameter starts at 665 ± 18 μm (generation 1) and decreased to 343 ± 26 μm (generation 10). The outer diameter varied between 650 and 800 μm.
One way of characterizing variability of acinar airway dimensions is to estimate the distribution of longitudinal path lengths from the initial segment to the terminal sacs (Paiva and Engel, 1984). The length varies between 5 and 13 mm (with an average of 8 mm). The mean longitudinal pathway length was calculated to be 7.21 ± 0.48 mm (0.627 ± 0.51 mm for each segment; range 0.02 – 3.75 mm).
An alternative model for describing the airway tree is that it is designed according to the laws of fractal geometry, as introduced by Mandelbrot (Mandelbrot, 1983). Comparing the large branches with the small branches it becomes quite evident, that in spite of irregularities, the branching pattern is quite similar at all levels (Weibel, 1989). Although length and diameter of airways vary considerably when measurements are averaged for each generation, we find that the proportions are constant.
The length to diameter ratio is invariant at 3.25. The branching ratios (the reduction factor with each successive generation) are 0.86 for diameter and 0.62 for length.
These findings support the notion that the airway tree has the basic property of self-similarity, in spite of irregularities (Nonnenmacher, Los, and Weibel, 1994).
Limitations
The complete volume of our lung was calculated with 1155 ml using our clinical 64-slice CT scanner. The volume is lower compared to the in-vivo lung volume. One reason is that due to our preparation technique, the upper lobe of the lung was not inflated. For that, sample acquisition was only performed in the lower lobe. Moreover, using formalin vapor, shrinkage with decrease in volume has been described recently (Litzlbauer, Neuhaeuser, Moell, Greschus, Breithecker, Franke, Kummer, and Rau, 2006).
Conclusions
Our study presents the first x-ray based three-dimensional segmentation of the human acinus using synchrotron-based micro-CT. Moreover, using a modified tree-analysis program, the acinus branching geometry can be quantified. Therefore, micro-CT imaging can be used as an additional/alternative method to study the human lung fine-structure and its dimensions.
Supplementary Material
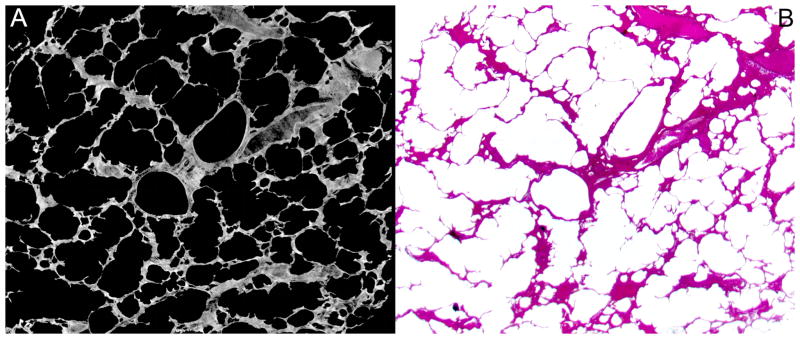
Figure 2.
A, Synchrotron-based micro-CT single-slice image at (4 μm)3 voxel size demonstrate well-extended alveolar walls. B, Matching microphotograph showing pulmonary parenchyma with slim alveolar walls (stain, hematoxylin-eosin; magnification x 20).
Acknowledgments
Use of the National Synchrotron Light Source, Brookhaven National Laboratory, was supported by the U.S. Department of Energy, Office of Science, Office of Basic Energy Sciences, under Contract No. DE-AC02-98CH10886. The image analysis was supported in part by NIH grant EB000305.
Literature Cited
- Felici M, Filoche M, Sapoval B. Diffusional screening in the human pulmonary acinus. J Appl Physiol. 2003;94:2010–2016. doi: 10.1152/japplphysiol.00913.2002. [DOI] [PubMed] [Google Scholar]
- Haefeli-Bleuer B, Weibel ER. Morphometry of the human pulmonary acinus. Anat Rec. 1988;220:401–414. doi: 10.1002/ar.1092200410. [DOI] [PubMed] [Google Scholar]
- Hansen JE, Ampaya EP. Human air space shapes, sizes, areas, and volumes. J Appl Physiol. 1975;38:990–995. doi: 10.1152/jappl.1975.38.6.990. [DOI] [PubMed] [Google Scholar]
- Kline TL, Ritman EL. Paths of least flow-resistance: characterization for the optimization of synthetic tissue scaffold design. Proc ISBI. 2009:606–609. [Google Scholar]
- Litzlbauer HD, Neuhaeuser C, Moell A, Greschus S, Breithecker A, Franke FE, Kummer W, Rau WS. Three-dimensional imaging and morphometric analysis of alveolar tissue from microfocal X-ray-computed tomography. Am J Physiol Lung Cell Mol Physiol. 2006;291:L535–L545. doi: 10.1152/ajplung.00088.2005. [DOI] [PubMed] [Google Scholar]
- Loeschke H. Die Morphologie des normalen und emphysematösen Acinus der Lunge. Beitr Path Anatom. 1921;68:213–223. [Google Scholar]
- Lum H, Mitzner W. Effects of 10% formalin fixation on fixed lung volume and lung tissue shrinkage. A comparison of eleven laboratory species. Am Rev Respir Dis. 1985;132:1078–1083. doi: 10.1164/arrd.1985.132.5.1078. [DOI] [PubMed] [Google Scholar]
- Mandelbrot B. The fractal geometry of nature. New York: Freeman; 1983. [Google Scholar]
- Nonnenmacher TF, Los GA, Weibel ER. Fractals in biology and medicine. Birkenhäuser; 1994. Design of biological organisms and fractal geometry; pp. 68–85. [Google Scholar]
- Paiva M, Engel LA. Model analysis of gas distribution within human lung acinus. J Appl Physiol. 1984;56:418–425. doi: 10.1152/jappl.1984.56.2.418. [DOI] [PubMed] [Google Scholar]
- Parameswaran H, Bartolak-Suki E, Hamakawa H, Majumdar A, Allan PG, Suki B. Three-dimensional measurement of alveolar airspace volumes in normal and emphysematous lungs using micro-CT. J Appl Physiol. 2009;107:583–592. doi: 10.1152/japplphysiol.91227.2008. [DOI] [PMC free article] [PubMed] [Google Scholar]
- Phalen RF, Oldham MJ, Beaucage CB, Crocker TT, Mortensen JD. Postnatal enlargement of human tracheobronchial airways and implications for particle deposition. Anat Rec. 1985;212:368–380. doi: 10.1002/ar.1092120408. [DOI] [PubMed] [Google Scholar]
- Phalen RF, Yeh HC, Schum GM, Raabe OG. Application of an idealized model to morphometry of the mammalian tracheobronchial tree. Anat Rec. 1978;190:167–176. doi: 10.1002/ar.1091900202. [DOI] [PubMed] [Google Scholar]
- Raskin SP. The pulmonary acinus: historical notes. Radiology. 1982;144:31–34. doi: 10.1148/radiology.144.1.7045973. [DOI] [PubMed] [Google Scholar]
- Ritman EL, Jorgenson SM, Lund P, Thomas PJ, Dunsmuir JH, Romero JC, Turner RT, Bolander ME. Synchrotron-based micro-CT of in situ biological basic functional units and their integration. 1997;3149:13–24. [Google Scholar]
- Rodriguez M, Bur S, Favre A, Weibel ER. Pulmonary acinus: geometry and morphometry of the peripheral airway system in rat and rabbit. Am J Anat. 1987;180:143–155. doi: 10.1002/aja.1001800204. [DOI] [PubMed] [Google Scholar]
- Schittny JC, Mund SI, Stampanoni M. Evidence and structural mechanism for late lung alveolarization. Am J Physiol Lung Cell Mol Physiol. 2008;294:L246–L254. doi: 10.1152/ajplung.00296.2007. [DOI] [PubMed] [Google Scholar]
- Tsuda A, Filipovic N, Haberthur D, Dickie R, Matsui Y, Stampanoni M, Schittny JC. Finite element 3D reconstruction of the pulmonary acinus imaged by synchrotron X-ray tomography. J Appl Physiol. 2008;105:964–976. doi: 10.1152/japplphysiol.90546.2008. [DOI] [PMC free article] [PubMed] [Google Scholar]
- Watz H, Breithecker A, Rau WS, Kriete A. Micro-CT of the human lung: imaging of alveoli and virtual endoscopy of an alveolar duct in a normal lung and in a lung with centrilobular emphysema--initial observations. Radiology. 2005;236:1053–1058. doi: 10.1148/radiol.2363041142. [DOI] [PubMed] [Google Scholar]
- Weibel ER. Morphometry of the human lung: the state of the art after two decades. Bull Eur Physiopathol Respir. 1979;15:999–013. [PubMed] [Google Scholar]
- Weibel ER. Morphometry of distal airways and the estimation of pulmonary gas exchange function. Kokyu To Junkan. 1981;29:503–510. [PubMed] [Google Scholar]
- Weibel ER. Is the lung built reasonably? The 1983 J. Burns Amberson Lecture. Am Rev Respir Dis. 1983;128:752–760. doi: 10.1164/arrd.1983.128.4.752. [DOI] [PubMed] [Google Scholar]
- Weibel ER. How much lung is good enough? Eur J Respir Dis Suppl. 1986;146:37–45. [PubMed] [Google Scholar]
- Weibel ER. Design of microvasculature and gas exchange. Prog Clin Biol Res. 1989;295:147–155. [PubMed] [Google Scholar]
- Weibel ER. Design and morphometry of the pulmonary gas exchanger. In: Crystall RG, West RB, Weibel ER, Barnes PJ, editors. The Lung. Lippincott-Raven; 1997a. pp. 1147–1157. [Google Scholar]
- Weibel ER. Design of airways and blood vessels considered as branching trees. In: Crystall RG, West RB, Weibel ER, Barnes PJ, editors. The Lung. Lippincott-Raven; 1997b. pp. 1061–1071. [Google Scholar]
Associated Data
This section collects any data citations, data availability statements, or supplementary materials included in this article.


