

Abstract
Ductal carcinoma in situ (DCIS) is a precursor lesion of invasive ductal carcinoma (IDC) of the breast. To understand the dynamics of genomic alterations in this progression, we used four multicolor fluorescence in situ hybridization probe panels consisting of the oncogenes COX2, MYC, HER2, CCND1, and ZNF217 and the tumor suppressor genes DBC2, CDH1, and TP53 to visualize copy number changes in 13 cases of synchronous DCIS and IDC based on single-cell analyses. The DCIS had a lower degree of chromosomal instability than the IDC. Despite enormous intercellular heterogeneity in DCIS and IDC, we observed signal patterns consistent with a nonrandom distribution of genomic imbalances. CDH1 was most commonly lost, and gain of MYC emerged during progression from DCIS to IDC. Four of 13 DCISs showed identical clonal imbalances in the IDCs. Six cases revealed a switch, and in four of those, the IDC had acquired a gain of MYC. In one case, the major clone in the IDC was one of several clones in the DCIS, and in another case, the major clone in the DCIS became one of the two major clones in the IDC. Despite considerable chromosomal instability, in most cases the evolution from DCIS to IDC is determined by recurrent patterns of genomic imbalances, consistent with a biological continuum.
Ductal carcinoma in situ (DCIS) is considered a precursor lesion for invasive breast cancer, and it is found synchronously in ∼45% of patients with invasive ductal carcinoma (IDC).1 DCIS is the last step in a continuum of noninvasive stages of increased cellular atypia that are believed to develop from flat epithelial atypia and atypical ductal hyperplasia.2 During the past decades, the observed incidence of DCIS has increased dramatically, which is likely attributable to more frequent screening and improved imaging methods.3 DCIS and IDC occur with an estimated incidence of 35 and 155 per 100,000 women in the United States, respectively.4 As the name suggests, the defining difference between these two entities is the lack of invasion and the maintenance of basement membrane integrity in DCIS. This particular feature has a profound effect on the prognosis for the patient. Patients with DCIS not accompanied by invasive disease have a 5-year survival of nearly 100%, but that rate drops with the diagnosis of IDC, which varies depending on tumor stage.5
The crucial clinical difference between DCIS and IDC has prompted considerable research activity aimed at identifying the relationship between the two. Histomorphologic and epidemiologic studies showed similarities between these lesions.6 Furthermore, genetic and molecular cytogenetic approaches, namely, studies of loss of heterozygosity, mutation analyses, gene expression profiling, comparative genomic hybridization (CGH), fluorescence in situ hybridization (FISH), and other assays for determining genomic copy number changes, supported the interpretation that DCIS is a precursor of IDC.7–23
However, the precise sequence of genetic events that causes the progression is not known. Most studies queried aberration profiles in the tumor cell population as a whole. The analysis of average changes in the entire tumor population makes it more difficult to ask the following two-part question: Does linear clonal evolution exist during transition from preinvasive to invasive disease, and, if so, which patterns of genomic imbalances drive this process? To address this issue, we used interphase cytogenetics on intact nuclei of the DCIS and the IDC component of primary tumor samples with probe cocktails targeting genes frequently affected by copy number changes in this disease. In particular, the genes that were included are described in the following paragraphs.
COX2 (cyclooxygenase 2, located on 1q31.1) is up-regulated in human breast cancer and encodes a key enzyme in the production of prostaglandins, which stimulate cell proliferation, inhibit apoptosis, and promote metastasis and angiogenesis in mammary tumor cells.24 DBC2 (deleted in breast cancer, located on 8p21.3), also known as RhoBTB2, belongs to the RhoBTB subfamily of Rho GTPases and inhibits cellular proliferation.25 This activity is proposed to occur through an uncharacterized mechanism wherein RhoBTB2 down-regulates the expression of cyclin D1.26 MYC (c-MYC, located on 8q24.21) is a regulator gene coding for a transcription factor that can activate and modify the expression of numerous genes, thereby driving cell proliferation and regulating cell growth, apoptosis, differentiation, and stem cell self-renewal. MYC is a strong proto-oncogene and is up-regulated in many types of cancers.27 CCND1 (cyclin D1, located on 11q13.3) is the regulatory subunit of a holoenzyme that phosphorylates and inactivates the RB protein and promotes progression through the G1-S phase of the cell cycle in a manner dependent on CDKs.28 Amplification or overexpression of CCND1 plays a pivotal role in the development of several human cancers, breast cancer included.
CDH1 (cadherin1, also known as epithelial cadherin, located on 16q22.1) encodes a calcium ion–dependent cell adhesion molecule whose reduced expression is regarded as one of the main molecular events involved in dysfunction of the cell-cell adhesion system, triggering cancer invasion and metastasis.29 HER2 (human epidermal growth factor receptor 2, located on17q12), also known as NEU or ERBB2, encodes a tyrosine kinase receptor that mediates critical signaling functions.30 Amplification or overexpression of the HER2 gene occurs in approximately 30% of breast cancers and is strongly associated with increased disease recurrence and worse prognosis.31 TP53 (tumor protein p53, located on 17p13.1) is a short-lived transcription factor that plays a critical role in eliminating tumor cells by coordinating changes in gene expression, leading to cell cycle arrest, senescence, or apoptosis.32,33 TP53 has, therefore, been described as the “guardian of the genome.”34 TP53 activity is frequently lost in human cancers.35
ZNF217 (zinc finger protein 217, located on 20q13.2) emerged as a strong candidate oncogene in the region of amplification on chromosome 20q13.2 for breast and other cancers. It is a member of the C2H2 family of transcription factors and is believed to intervene in the processes of transcriptional repression and attenuation of the apoptotic signal.36
By analyzing these eight gene probes along with two centromeric control probes (centromeres 4 and 10) in the same cells using subsequent hybridization and relocation schemes, we were able to reconstruct patterns of genome dynamics that govern the evolution of breast cancer.
Materials and Methods
Clinical Samples
The samples were collected from women enrolled between 2000 and 2006 in an ongoing, Institutional Review Board–approved, hospital-based epidemiologic study assessing biomarkers of breast cancer risk. Clinical data were collected at the time of participant entry with no longitudinal follow-up. Included were English-speaking women ≥18 years of age who had a previous diagnosis of IDC or DCIS at any age or no history of any form of cancer, excluding nonmelanoma skin cancers and in situ cervical cancer. The study nurse identified patients with synchronous DCIS and IDC from the database of enrolled women, and the representative paraffin blocks were selected. The clinical data available for the 13 patients analyzed are summarized in Table 1. Owing to updates to the consensus staging criteria for breast cancer that occurred during the enrollment period, the staging provided in Table 1 is based on the current American Joint Committee on Cancer cancer staging system.37
Table 1.
Clinical Data Available for the 13 Patients Analyzed
| Case No. | Age (years) | Race | Tumor grade | Tumor size (cm) | Lymph nodes (No. pos./total No.) | Tumor stage | ER status | PR status | HER2 IHC study | G/P/AB | DCIS component |
|
|---|---|---|---|---|---|---|---|---|---|---|---|---|
| Grade | Histologic features | |||||||||||
| 1 | 50.0 | Hispanic | 3 | 1.2 | 2/9 | IIIC | 0 | 0 | 1+ | G4P3AB1 | Intermediate high | Cribriform |
| 2 | 47.3 | White | 1 | 0.9 | 0/20 | IA | 75 | 85 | ND | G3P3AB0 | Intermediate | Cribriform-solid |
| 3 | 73.9 | White | 3 | 3.5 | 2/17 | IIB | 75 | 100 | ND | G2P2AB0 | High | Cribriform-solid |
| 4 | 53.0 | White | 1 | 1.3 | 0/1 | IA | 90 | 100 | 1+ | G1P1AB0 | Intermediate | Cribriform-solid |
| 5 | 62.7 | White | 2 | 3.6 | 0/9 | IIA | 100 | 95 | 2+ | G5P3AB2 | Intermediate | Cribriform-solid |
| 6 | 33.3 | White | 2 | 4.5 | 3/13 | IIB | 90 | 40 | 1+ | G4P3AB1 | Intermediate | Cribriform-solid |
| 7 | 56.0 | White | 3 | 0.6 | 0/37 | IA | 0 | 0 | 0 | G0P0AB0 | High | Cribriform-solid |
| 8 | 59.7 | White | 2 | 1.8 | 1/27 | IIA | <5 | 95 | 0 | G4P2AB2 | Intermediate | Cribriform-solid |
| 9⁎ | 66.1 | African American | 2 | 1.9 | 2/20 | IV | 100 | 50 | 2+ | G2P0AB2 | Intermediate | Cribriform-comedo |
| 10 | 42.8 | Hispanic | 3 | 1.3 | 0/9 | IA | 0 | 0 | 0 | G3P0AB3 | High | Cribriform-solid |
| 11 | 49.6 | Asian | 3 | 2.7 | 0/2 | IIA | 90 | 80 | 3+ | G2P2AB0 | High | Cribriform-solid |
| 12 | 37.0 | White | 2 | 0.8 | 0/2 | IA | 0 | 0 | 3+ | G2P2AB0 | High | Cribriform-solid |
| 13 | 37.8 | White | 3 | 1.8 | 8/14 | IIIA | 95 | 90 | 2+ | Missing | High | Cribriform |
ER, estrogen receptor (>0 is a positive test result); G/P/AB, gravida/para/abortus; IHC, immunohistochemical; ND, not determined; PR, progesterone receptor (>0 is a positive test result).
Case 9 was the only case with distant metastasis.
Preparation of Cytospins from Archival Formalin-Fixed, Paraffin-Embedded Specimens
Nuclei from archived paraffin blocks were prepared using the cutting scheme presented in Figure 1, A. First, a 4-μm-thick section was cut and stained with H&E and the histomorphologic features of each lesion were assessed by a pathologist (R.C.). The second and third sections were 6-μm-thick (for potential FISH or immunohistochemical studies on tissue sections), and the fourth and fifth sections were 50 μm thick. The sixth section was 4-μm-thick and was again stained with H&E. Figure 1B shows the H&E staining for the DCIS and the IDC for case 5 as an example.
Figure 1.

A: Sample preparation for FISH analysis. First, a 4-μm-thick section was cut and stained with H&E for the identification of regions containing DCIS and IDC. The second and third sections were 6 μm thick (for potential FISH or immunohistochemical studies), and the fourth and fifth sections were 50 μm thick and were used for the preparation of nuclei for FISH analysis. The sixth section was 4 μm thick and was also stained with H&E. After macrodissection and protease digestion, single-cell suspensions were transferred to slides as cytospin preparations and fixed for FISH analysis. B: Examples of H&E-stained sections of DCIS and IDC, shown here from case 5.
Using the two H&E-stained sections for guidance, the pathologist (R.C.) outlined the DCIS and IDC areas in the unstained 50-μm-thick sections. The tissue of each area of interest was removed using a scalpel and was placed in an Eppendorf tube with xylene for 20 minutes. The tube was then centrifuged for 3 minutes at 750 × g, and the xylene was removed. The xylene wash was repeated an additional two times. The tissue was then rehydrated in an ethanol series of 100% (×2), 90%, 70%, and 50%. After 5 minutes, the sample was centrifuged at 4°C for 15 minutes at 16,000 × g. The ethanol was removed, and 1 mL of sterile water was added. After 20 minutes at room temperature, the sample was centrifuged at 4°C for 15 minutes at 16,000 × g. After removing the water, 250 to 500 μL of 0.1% protease (type XXIV; P-8038; Sigma-Aldrich, St. Louis, MO) in 1× PBS was added. The tube was then placed in an Eppendorf thermomixer at 45°C, shaking for 40 to 60 minutes.
The disintegration of the tissue sample was monitored under microscopic control every 15 to 20 minutes. The degree of disintegration was determined by placing 10 μL of the protease digest on a slide and staining it with 10 μL of DAPI-sulforhodamine solution (SR101; S-7635; Sigma-Aldrich). Optimal disintegration was determined by the quantity of nuclei (∼30 per 16× objective field view) and by the lack of cytoplasm and the intensity of the DAPI stain. Once the disintegration was optimal, the reaction was stopped with 500 μL of 1× PBS, and the sample was centrifuged for 5 minutes at 530 × g. The concentration of the nuclei was adjusted so that 80 μL of the cell suspension centrifuged in a Shandon Cytospin 3 centrifuge (Thermo Scientific, Asheville, NC) for 5 minutes at 180 × g resulted in a medium-dense, monolayered cytospin. The slides were dehydrated in 70% and 90% ethanol for 5 minutes and in 100% ethanol for 10 minutes, air-dried, and stored at 4°C.
FISH
Eight bacterial artificial chromosome contigs centering around the following genes were assembled: COX2 (1q31.1), DBC2 (8p21.3), MYC (8q24.21), CCND1 (11q13.3), CDH1 (16q22.1), HER2 (17q12), TP53 (17p13.1), and ZNF217 (20q13.2). The bacterial artificial chromosome clones for COX2, CCND1, CDH1, and TP53 were labeled with Orange-dUTP (Abbott Molecular Inc., Des Plaines, IL), and those for MYC, DBC2, HER2, and ZNF217 were labeled in green with DY-505-dUTP (Dyomics, Jena, Germany). Two centromere probes (CEP4 and CEP10) labeled with Aqua-dUTP (Abbott Molecular Inc.) were hybridized in addition to the eight gene probes.
The FISH probes were combined into four panels, with CCND1 and ZNF217 as the first panel. The second panel contained MYC, COX2, and CEP10. HER2, TP53, and CEP4 were in the third panel. The fourth panel contained DBC2 and CDH1. The four probe panels were consecutively hybridized onto the same cytospin, allowing for counts of all 10 probes in the same nuclei. Before hybridizations, the samples were pretreated with 0.05% pepsin (P-6887; Sigma-Aldrich). The slides were then dehydrated in an ethanol series (70%, 90%, and 100%) for 5 minutes each and allowed to air-dry. The slides were denatured in 70% formamide/standard saline citrate for 2 minutes at 80°C using a ThermoBrite StatSpin system (Abbott Molecular Inc.) and were dehydrated in a cold ethanol series (70%, 90%, and 100%) for 3 minutes each and allowed to air-dry. The probes were denatured for 5 minutes and preannealed for 1 to 2 hours before being hybridized onto the samples. Coverslips were then added and sealed with rubber cement. The slides were placed into a humid hybridization chamber and incubated at 37°C overnight.
After hybridization, slides were washed twice in 2× standard saline citrate at room temperature for 2 minutes with gentle agitation. The slides were then dehydrated (in 70%, 90%, and 100% ethanol for 2 minutes each), air-dried, and covered with Vectashield mounting medium containing a DAPI counterstain (Vector Laboratories, Burlingame, CA) before the slides were analyzed using a Leica DMRXA epifluorescence microscope with an automated stage (Leica Microsystems GmbH, Wetzlar, Germany) equipped with custom optical filters for DAPI, Spectrum Aqua, Spectrum Green, and Spectrum Orange (Chroma Technology Corp., Bellows Falls, VT) with a 40× plan apochromat (numerical aperture, 1.25) objective. The microscope was connected to a CoolSNAPfx CCD camera (Roper Scientific GmbH, Ottobrunn, Germany). Leica CW4000 FISH software (Leica Microsystems) was used to acquire 25 to 30 images with each filter. Stage relocation was used so that the same cells could be imaged with all four probe panels. Once the samples had been imaged with the first panel, the first probe panel was washed off in 50% formamide/standard saline citrate at 80°C for 1 to 2 minutes and then dehydrated in an ethanol series (70%, 90%, and 100% for 2 minutes each). Once dry, the slides were denatured in 70% formamide/standard saline citrate for 2 minutes at 80°C using the ThermoBrite StatSpin and dehydrated in a cold ethanol series (70%, 90%, and 100% for 3 minutes each). The denatured and preannealed probes containing the gene probes were then mixed with the denatured centromere probes and hybridized overnight at 37°C. The probe signals were developed according to the protocol used for the first probe panel, and images were taken for the same cells as imaged in the first panel using the relocation software. The previously described protocol was then repeated for the third and fourth panels. All the samples were analyzed for the eight gene probes and the two centromere probes, with a final count of 76 to 220 interphase nuclei for each sample. Only nuclei with clearly visible signals for all four subsequently hybridized probe panels were included in the final count. The nuclei were checked after each hybridization and were excluded if damaged or incomplete. This was easily assessed by comparison with images of the previous hybridizations. The counts for each cell and each probe were then recorded in Excel spreadsheets (Microsoft Corp, Redmond, WA; Table 2).
Table 2.
Examples of Signal Patterns and Ploidy Annotation for the IDC of Case 1
| CEP10 | CEP4 | COX2 | DBC2 | MYC | CCND1 | CDH1 | TP53 | HER2 | ZNF217 | Nuclei count | Assigned ploidy |
|---|---|---|---|---|---|---|---|---|---|---|---|
| 1 | 2 | 2 | 2 | 2 | 2 | 2 | 1 | 2 | 2 | 1 | 2 |
| 1 | 2 | 2 | 2 | 2 | 2 | 2 | 2 | 2 | 0 | 1 | 2 |
| 1 | 2 | 2 | 2 | 2 | 2 | 2 | 2 | 2 | 2 | 3 | 2 |
| – | – | – | – | – | – | – | – | – | – | – | – |
| 2 | 2 | 2 | 2 | 2 | 2 | 0 | 2 | 2 | 2 | 1 | 2 |
| 2 | 2 | 2 | 2 | 2 | 2 | 1 | 2 | 2 | 2 | 4 | 2 |
| – | – | – | – | – | – | – | – | – | – | – | – |
| 4 | 2 | 3 | 2 | 4 | 2 | 1 | 2 | 2 | 1 | 1 | 2 |
| 4 | 2 | 3 | 2 | 4 | 2 | 1 | 2 | 2 | 2 | 5 | 2 |
| 4 | 2 | 3 | 2 | 4 | 3 | 1 | 2 | 2 | 2 | 1 | 2 |
| 4 | 2 | 3 | 3 | 4 | 1 | 1 | 2 | 1 | 2 | 1 | 2 |
| 4 | 2 | 3 | 3 | 4 | 2 | 1 | 1 | 2 | 1 | 1 | 2 |
| 4 | 2 | 3 | 3 | 4 | 2 | 1 | 1 | 2 | 2 | 2 | 2 |
| 4 | 2 | 3 | 3 | 4 | 2 | 1 | 2 | 2 | 2 | 11 | 2 |
| 4 | 2 | 3 | 3 | 4 | 2 | 1 | 3 | 4 | 2 | 1 | 2 |
| 4 | 2 | 3 | 3 | 4 | 2 | 2 | 2 | 2 | 2 | 1 | 2 |
| 4 | 2 | 3 | 3 | 4 | 2 | 2 | 2 | 3 | 2 | 1 | 2 |
| 4 | 2 | 3 | 3 | 4 | 3 | 1 | 2 | 2 | 2 | 1 | 2 |
| 4 | 2 | 3 | 3 | 4 | 3 | 1 | 2 | 4 | 2 | 1 | 2 |
| 4 | 2 | 3 | 4 | 4 | 2 | 2 | 2 | 2 | 2 | 1 | 2 |
| 4 | 2 | 3 | 4 | 4 | 2 | 3 | 2 | 2 | 2 | 3 | 2 |
| 4 | 2 | 4 | 4 | 4 | 2 | 1 | 2 | 3 | 2 | 1 | 2 |
| – | – | – | – | – | – | – | – | – | – | – | – |
Frequent signal patterns are shown in bold. Dashes indicate places in the table where rows of the Excel file are omitted.
Raw Patient Data Files
We recorded the results of the enumeration as raw data for DCIS and IDC separately per patient and saved those as tab-delimited text files for the various analyses described later herein. Table 2 is an example of the raw data for the IDC of case 1, which shows 20 of 59 rows of the raw data file. The first 10 columns are the signal counts of two centromere probes (CEP10 and CEP4) and eight gene probes (COX2, DBC2, MYC, CCND1, CDH1, TP53, HER2, and ZNF217). The rows were sorted in lexicographic ascending order. The eight genes are in chromosome order. Each row of 10 probe signal counts is called a signal pattern. Multiple nuclei having the same signal pattern were grouped into one row. The second to last right column reports the number of distinct nuclei having the signal pattern described by that row. Nuclei with signal patterns that have a high likelihood of resulting from truncation artifacts were filtered out as described later herein.
Preprocessing Patient Data Files
The DCIS and the IDC lesions showed varying contributions of cells with diploid counts for all markers, presumably from stromal or immune cells. Cells with a count of two signals for all probes were eliminated from the subsequent data analysis.
In addition, we used two methods to filter out signal patterns that are likely contributed by sectioned nuclei. The first method is based on counting oncogene probe signals based on the intuition that oncogenes should rarely be lost and that nuclei with subdiploid signals from oncogenes are, therefore, likely to be cut. Probabilities of signal counts expressed as percentages of signal counts for all centromere and gene probes across all cells are reported in Table 3. For each signal pattern, we multiplied the probabilities of the observed signal counts for the five oncogenes to obtain a likelihood of the observed count under the null hypothesis of no cut nucleus. To make the test more cautious, we heuristically multiplied this likelihood by 10 for each oncogene probe with three or more counts. We identified any nucleus with adjusted likelihood <0.0004 as a probably cut nucleus and filtered it from the data set. This threshold was chosen because there was a large gap between the highest value below 0.0004 and the lowest value above.
Table 3.
Probabilities Expressed as Percentages of Signal Counts for Two Centromere Probes and Eight Gene Probes from 26 Patient Data Files (of DCIS and IDC Separated for 13 Patients)
| Signal count | CEP10 | CEP4 | COX2 | DBC2 | MYC | CCND1 | CDH1 | TP53 | HER2 | ZNF217 |
|---|---|---|---|---|---|---|---|---|---|---|
| 0 | 0.57 | 0.85 | 0.63 | 3.08 | 0.50 | 1.87 | 2.40 | 1.42 | 0.92 | 1.24 |
| 1 | 4.49 | 4.25 | 3.35 | 29.35 | 2.77 | 4.30 | 34.68 | 22.98 | 10.46 | 3.87 |
| ≥2 | 94.94 | 94.91 | 96.02 | 67.56 | 96.73 | 93.83 | 62.92 | 75.60 | 88.62 | 94.89 |
The probabilities for oncogene probes are shown in bold.
The second method of filtering relied on the premise that complete loss of any chromosome was likely an indication of a cut nucleus. We, therefore, filtered any cell in which either centromere probe (CEP10 or CEP4) has zero signals, which occurred with percentages of 0.57% for CEP10 and 0.85% for CEP4 (Table 3). A total of 104 cells across all data files were filtered out as being likely to reflect sectioned, incomplete nuclei.
Annotating Ploidy
To infer probe signals being gained or lost, we assigned an overall ploidy to each signal pattern. We then classified probe gain or loss relative to the estimated overall ploidy of the cell. Cells were predominantly classified as diploid (ploidy 2), triploid (ploidy 3), or tetraploid (ploidy 4). Only a few cells were assigned a ploidy >4. Ploidy values were assigned to each signal pattern by expert (K.H.-H.) annotation based on an assessment of centromere counts and gene probe counts for that pattern to generate ploidy assignments consistent with centromere counts when those were in agreement, using gene counts and knowledge of which genes were oncogenes versus tumor suppressors to reconcile disagreements in centromere counts. Table 2 provides some examples of signal patterns from the IDC of case 1 and their assigned ploidies. We additionally developed a computational maximum likelihood model for ploidy assignment, trained based on a subset of manual assignments. To infer ploidy computationally, we computed the conditional probability of each probe count (grouped into 0, 1, 2, 3, and ≥4) for each manually assigned ploidy (2, 3, or 4) across all cells and probes and assigned a weight to each probe to estimate its contribution to the overall ploidy assignment (weight 1 for COX2, CCND1, CDH1, and ZNF217; weight 0.5 for DBC2, MYC, TP53, and HER2; weight 0 for any centromere probe with signal count 1; weight 2 for any centromere probe with signal count ≥2 where both centromere probes were present; and weight 3 for a centromere probe with signal count ≥2 where it was the only centromere probe available). To assign a ploidy to a given cell, we then computed a probability of each ploidy assignment (2, 3, or 4) by computing the weighted sum over all probes of the conditional probability of the observed signal count given the putative ploidy, normalizing the resulting probabilities by the sum of all three for each cell. We then treated the most probable of these three assignments as the computationally assigned ploidy of the cell provided that its probability was above an empirically determined threshold of 0.63. If the most probable assignment was 2, that assignment had a probability between 0.63 and 0.55, and at least three probes had signal count ≥5, then we instead assigned the ploidy to be the more probable of ploidies 3 and 4. Similarly, if the most probable assignment was 2, that assignment had a probability <0.55, and at least four gene probes had signal count ≥5, then we assigned the ploidy to be the more probable of ploidies 3 and 4. The computational method was used to assist in manual ploidy assignment by checking that similar cells in different patient files were assigned the same ploidy.
Determining Gain and Loss Patterns
Because of the large number of probes and the high diversity in clonal populations, there tend to be small numbers of any particular signal pattern in any particular lesion. To better characterize the major progression steps of individual patients, we, therefore, developed a procedure to identify a subset of probes specific to each patient that best describes the major clonal evolution of that patient. By identifying only those probes relevant to the common progression steps found in a given patient and the directions of the corresponding count changes, we can consolidate distinct signal patterns common to a given pathway and, thus, identify the strongly supported pathways.
To classify progression patterns consistently across patients, we used the notion of a signal pattern comparator, which describes a possible direction of change for each probe in a given patient.38 A comparator consists of a string using four symbols— gained (G), normal (N), lost (L), and a wild card symbol (*) indicating a probe that is not considered—with one symbol assigned for each probe from the ordered set COX2, DBC2, MYC, CCND1, CDH1, TP53, HER2, and ZNF217. For example, a tumor that is characterized by gain of HER2 and loss of TP53 in a background of normal MYC would be described by the comparator **N**LG*. Such a comparator then serves as a summary for all signal patterns exhibiting normal MYC, loss of TP53, and gain of HER2 regardless of their counts for the other probes. There are 48 possible comparators for the eight-probe data used herein. We focused this analysis on the 38−1 comparators consisting of G, L, and * but not all *.
We analyzed the frequency with which each comparator was satisfied in each patient data set. To do so, we assigned each signal pattern a string of the symbols G, N, and L describing its counts of the eight probes relative to its ploidy. For example, in the major signal pattern clone of the IDC of case 1 (Table 2, fourth row with bold numbers), relative to the ploidy assignment of 2, we observe gains of COX2, DBC2, and MYC and a loss of CDH1. We, therefore, would assign that signal pattern the string GGGNLNNN. This was repeated for all signal patterns. We then asked for each patient data set what fraction of cells satisfied each of the 48 possible comparators. A cell satisfies a comparator if the cell's signal pattern agrees with the comparator in all non–wild card characters. For example, the signal pattern GGGNLNNN would match comparators GGGNLNNN, GGG*LNNN, GGG*L***, GGG*****, ********, etc. For each data set, we identified comparators containing only G, L, and * and matching ≥20% of that patient's cells. Comparators with no N's matching ≥30% of the cells in a data set were defined as major imbalance clonal patterns, and those matching ≥20% but <30% were defined as minor imbalance clonal patterns. If we did not find any major imbalance clonal pattern matched by ≥30% of the cells in a patient file, we instead identified the one most frequent imbalance clonal pattern even if its frequency was <30%.
Results
DCIS is the noninvasive precursor lesion of IDC. To explore the dynamics and the sequence of genome alterations that determine the progression from DCIS to synchronous IDC, we used 10 FISH probes to enumerate chromosomal copy number changes in single cells. This was accomplished by sequential hybridization of four FISH cocktails that contained the probes for the oncogenes COX2 (1q), MYC (8q), CCND1 (11q), HER2 (17q), and ZNF217 (20q); the tumor suppressor genes DBC2 (8p), CDH1 (16q), and TP53 (17p); and centromere enumeration probes for chromosomes 4 and 10. Chromosomes 4 and 10 were chosen as probes to assess the ploidy of the cells because these chromosomes are rarely subject to copy number changes in breast cancer.39 The probes were sequentially hybridized to interphase cells prepared as cytospins from 13 cases of synchronous DCIS and IDC from the same patients. Signal patterns were counted in 76 to 220 nuclei per sample. This procedure allowed us to establish the copy numbers of the same 10 probes in each interphase nucleus. The clinical samples were collected with informed consent as part of an Institutional Review Board–approved hospital-based observational study to assess biomarkers of breast cancer risk. Pertinent clinical parameters are summarized in Table 1.
Maintenance of Conserved Patterns of Genomic Imbalances
In general, we observed that the pattern of chromosomal gains and losses is consistent with previous cytogenetic, molecular cytogenetic (CGH), and genetic studies, which indicated that the distribution of chromosomal gains and losses defines the cancer entity.40,41 The selection of the probes was based on published data on numerical aberrations in breast cancer.39 Accordingly, the breast cancer–specific FISH markers delineating chromosome arms 1q, 8q, 11q, 17q, and 20q were frequently present in extra copy numbers, whereas 8p, 16q, and 17p were subject to copy number losses in DCIS and IDC in the present collection (Figure 2). Gains of COX2 and MYC and losses of DBC2, CDH1, and TP53 occurred in >30% of all cells, and gains of CCND1, HER2, and ZNF217 were observed in >20% of all cells. Chromosome arms that were frequently gained were rarely lost, and vice versa, except 17q (HER2), which was gained in ∼25% of cells but lost in >10% of DCIS and IDC. The HER2 loss observed was attributable to two cases (cases 6 and 10). The frequency of chromosomal gains and losses was, in general, higher in the cells of IDC compared with those of DCIS, which was particularly obvious for the MYC oncogene (15% more IDC cells with MYC gain compared with DCIS cells). Only the gains of COX2 and CCND1 were slightly (2%, not statistically significant) higher in DCIS cells (Figure 2).
Figure 2.
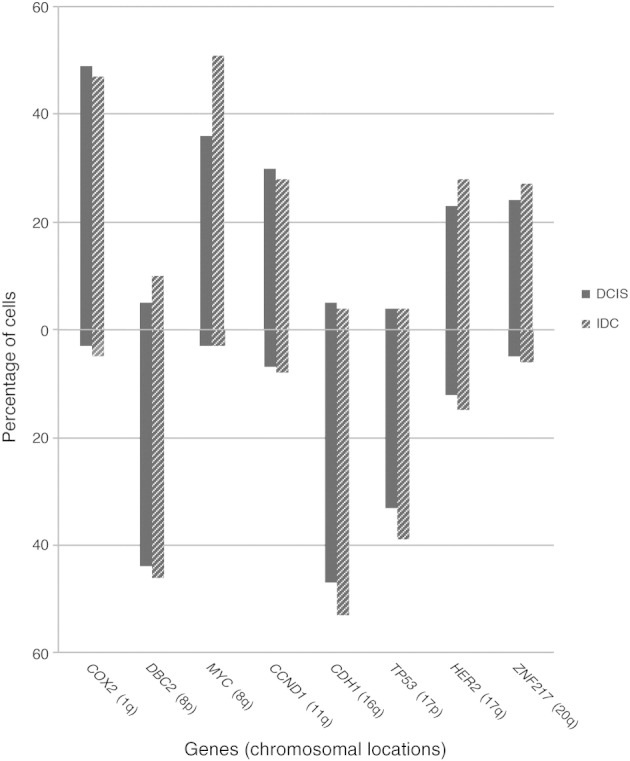
Average gain and loss frequencies for all the gene markers in cells of DCIS and IDC. Percentages of cells with gains are shown above the 0% line and with losses below the 0% line.
Figure 3 shows the number of DCIS and IDC lesions positive for a specific marker gain or loss when using a threshold of >30% of the cells of the lesion displaying the aberration. For all copy number changes, except CCND1 gain, which remained at identical levels (5 of 13 cases each), the number of samples with that change increased during the progression from DCIS to IDC. For most markers, an increase of one or two lesions was observed; however, the MYC gain was much more prominent in IDC lesions, with an increase from 6 of 13 DCIS lesions to 10 of 13 IDC lesions. MYC gains and CDH1 losses (11 of 13 IDC lesions) were the most frequent changes found in the IDC lesions analyzed in this study.
Figure 3.

Specific gene gains and losses during progression from DCIS to IDC. Note that HER2 was gained and lost. The thicknesses of the arrows reflect the percentage of change from DCIS to IDC. The increase of lesions with a gain of MYC was the most pronounced.
To arrive at a quantitative assessment of the degree of genomic instability, we calculated an instability index by dividing the number of distinct observed signal patterns by the numbers of enumerated nuclei and then multiplying by 100 to put the instability index values in the range [0,100]. DCIS had an average chromosomal instability of 62.3 (range, 14.5–93.3), and the synchronous IDC revealed an average instability of 70.6 (range, 49.7–98.0), summarized in Table 4.
Table 4.
Stable Signal Pattern Clones and Instability Indexes for the DCIS and IDC Lesions of 13 Patients
| Case No. | Lesions | Stable signal pattern clones⁎ | Instability index† |
|---|---|---|---|
| 1‡ | DCIS | 16% 33421222, 5% 32421222 | 61.1 |
| IDC | 13% 33421222, 6% 32421222 | 67.4 | |
| 2‡ | DCIS | 21% 22221222, 21% 32221222, 16% 42222223 | 14.5 |
| IDC | 14% 32221222, 7% 32221122 | 49.7 | |
| 3‡ | DCIS | 6% 42982244 | 75.7 |
| IDC | 6% 42982244, 6% 32222222 | 66.5 | |
| 4‡ | DCIS | 18% 42221222, 9% 32221222, 6% 42221122 | 43.7 |
| IDC | 10% 43321222, 8% 42221222, 7% 43321122 | 63.4 | |
| 5 | DCIS | 22% 31231132, 16% 31221132, 7% 31241132 | 47.7 |
| IDC | 11% 42332132, 6% 42342132 | 53.7 | |
| 6 | DCIS | 10% 3122212, 6% 31222222 | 56.7 |
| IDC | 16% 21222212, 8% 22222112 | 54.3 | |
| 7 | DCIS§ | No | 93.3 |
| IDC§ | No | 80.0 | |
| 8‡ | DCIS | 12% 21421222, 9% 22421222 | 68.8 |
| IDC | 9% 21421222 | 79.3 | |
| 9‡ | DCIS | 7% 72442246 | 75.8 |
| IDC | 8% 72442246 | 86.2 | |
| 10 | DCIS | 14% 22222232, 11% 22221222 | 53.9 |
| IDC | 20% 21321112 | 59.2 | |
| 11 | DCIS§ | No | 87.3 |
| IDC§ | No | 81.8 | |
| 12 | DCIS | 18% 22202222, 7% 22212222 | 56.5 |
| IDC§ | No | 98.0 | |
| 13 | DCIS§ | No | 75.0 |
| IDC§ | No | 77.9 |
Signal patterns are displayed in the following gene order: COX2, DBC2, MYC, CCND1, CDH1, TP53, HER2, ZNF217.
Average instability of DCIS vs IDC: 62.3 vs 70.6. The instability index is calculated as the number of signal patterns observed × 100/the number of nuclei counted.
Cases with identical signal pattern clones (shown in bold) in the DCIS and the IDC.
Lesions with no stable signal pattern clones: ≤4% of cells have identical patterns.
Three of the 13 samples (cases 1, 2, and 4) displayed a pattern that would be consistent with the 1q/16q pattern identified using array CGH and gene expression profiling, which defines a particular subgroup of invasive cancers.39,42 When comparing the percentages of chromosomal gains and losses and the instability index, which correlated with each other, with clinical parameters, we noticed the following relationships: DCISs that preceded grade 1 IDCs were more stable than DCISs that preceded grades 2 and 3 IDCs (P = 0.0128, Mann-Whitney/Wilcoxon test). IDCs with more imbalances and a higher instability index were preceded by DCISs that were also more unstable. Furthermore, the degree of instability increased with tumor grade, and, last, high-grade DCIS lesions were more likely to progress to grade 3 tumors. In addition, we observed a good correlation when comparing HER2 overexpression measured by immunohistochemical analysis (Table 1) with genomic gain or amplification of HER2 determined using FISH.
Chromosomal Instability and Clonal Patterns
The FISH probe panels were hybridized sequentially to individual nuclei. After repeated hybridization and relocation of the cells, this afforded us the possibility of enumerating clonal aberration patterns on a cell-to-cell basis for all eight gene probes and the two centromere probes. We then assigned the FISH signal patterns to two groups: patterns for which each cell fitting the pattern has an identical count as each other cell fitting the pattern for all eight gene signals, termed signal pattern clone, and patterns for which each cell fitting the pattern matches each other cell in the direction of change (gain, loss, or normal) of each signal but not necessarily in the exacts counts, termed imbalance clone. To visualize and compare major imbalance clones in synchronous DCIS and IDC lesions, we displayed each cell of the lesion according to its gain, loss, or unchanged (normal) status, with the gene probes sorted according to their chromosomal location from the top to the bottom of the chart and with the patterns observed displayed from left to right sorted by frequency. In addition, we calculated the frequency of gained and lost, status for each of the gene loci in percentages of the total DCIS or IDC cell population, the average ploidy of the lesion, and the average signal number for each gene locus. The results are displayed in Figure 4 for the first six cases and in Supplemental Figure S1 (available at http://ajp.amjpathol.org), for the remaining seven cases.
Figure 4.


Summary of imbalance clones in 6 of the 13 cases of DCIS and IDC (cases 1 to 6; A–F). Green, gains; red, losses; blue, unchanged. The organization of the graphs is the same for all cases and is explained for A (case 1) in detail from left to right. The “Locus” column shows the chromosome arm. Each vertical dotted line separates individual nuclei, and the vertical thin solid line discerns specific signal pattern clones among the most common imbalance clones, which are separated from each other by vertical thick solid lines. The row above the imbalance clones displays the percentages at which the clones were found (threshold ≥2%). For example, the DCIS of case 1 had 20% of cells with gains of COX2, DBC2, and MYC and a loss of CDH1, and the other markers were unchanged; among those cells, 15.8% had a signal pattern clone of 33421222 in the DCIS. In the IDC, 16.3% of cells had gains of COX2, DBC2, and MYC and a loss of CDH1, with no other changes observed; among those, 12.8% had a signal pattern clone of 33421222 (for the definitions of imbalance clone and signal pattern clone, see Materials and Methods). There were 8.4% of the cells with gains of COX2 and MYC and a loss of CDH1 as the only changes, and in this imbalance clone there were five cells with a signal pattern clone of 32421222. The “Marker” column shows the gene name. The “Gain” column shows that 51% of the cells had a gain of COX2, 36% of DBC2, and 60% of MYC in the DCIS. The “Loss” column shows that 55% of the cells had a loss of CDH1 in the DCIS. The “sig. no.” column shows that the average signal count for COX2 in the entire population was 2.53 (2.35 for DBC2, 3.06 for MYC, and 1.49 for CDH1). The percentage of gains or losses in >30% of the cells is also indicated by the color intensity. Ninety-five nuclei were counted for the DCIS of this case, and 86 for the IDC. Average ploidy values were calculated from the ploidy values assigned to each nucleus (see Materials and Methods). Columns that are presented in blue only had no copy number changes for any of the eight gene probes but signal numbers for centromere probes 4 and/or 10 that differed from the ploidy value. The remaining seven cases (cases 7 to 13) can be viewed in Supplemental Figure S1 (available at http://ajp.amjpathol.org).
The enormous degree of chromosomal instability was reflected by the fact that identical signal pattern clones were present only in <23% of the cells of each lesion and in seven lesions in ≤4% of the cells, which we defined as lesions without a stable signal pattern clone (Table 4). However, imbalance clones were detected invariably, but not in all cases was a major imbalance clone that was present in the DCIS also maintained in the matched IDC.
Table 5 summarizes the major imbalance clones in each lesion determined with the help of the gain and loss comparator described in Materials and Methods. All major imbalance clone patterns match ≥30% of the cells in a patient file except for the DCIS lesions of cases 2, 10, 12, and 13 and the IDC lesion of case 3. The imbalance clone with the largest corresponding percentage in DCIS is also the one with the largest corresponding percentage in IDC for each of four patients (cases 1, 7, 8, and 9). For example, the imbalance clone (DBC2 lost, MYC gained, CDH1 lost) matching comparator *LG*L*** with the highest percentage (32.6%) in the DCIS of case 8 was also the imbalance clone with the highest percentage (40.7%) in the IDC of that case. We infer that cells with this imbalance clone had a growth advantage in both the DCIS and IDC lesions.
Table 5.
Major and Minor Clonal Patterns Separately in DCIS and IDC for Each Patient as Matching Comparators with Their Corresponding Percentages Matched by Cells in Each Patient File in Parentheses for all 13 Patients
| Case No. | DCIS | IDC | Case No. | DCIS | IDC |
|---|---|---|---|---|---|
| 1 | G*G*L*** (40.0%) | G*G*L*** (41.9%) | 8 | *LG*L*** (32.6%) | *LG*L*** (40.7%) |
| GGG***** (33.7%) | GGG***** (40.7%) | *L*****L (21.3%) | |||
| *GG*L*** (31.6%) | *GG*L*** (31.4%) | 9 | GLGGLLGG (32.6%) | GLGGLLGG (42.3%) | |
| GGG*L*** (29.5%) | GGG*L*** (27.9%) | 10 | *L**L*** (19.7%) | *LG*LLL* (46.6%) | |
| 2 | G***L*** (28.6%) | G***L*** (45.1%) | 11 | GLG***** (37.3%) | *LG*LL** (34.3%) |
| G******G (28.6%) | ****LL** (22.3%) | G*G****G (31.4%) | G*G****G (31.3%) | ||
| *L**L*** (21.4%) | GLG****G (22.5%) | **GG**G* (31.3%) | |||
| 3 | *LGGLL** (53.7%) | *LG***** (28.4%) | GLGG**** (20.6%) | G*G**LG* (30.3%) | |
| *L**L*** (28.4%) | G**G***G (20.6%) | **GG***G (30.3%) | |||
| *LGGLL** (20.8%) | **G**LGG (30.3%) | ||||
| G*GG*L*G (20.2%) | G*G**LGG (25.3%) | ||||
| 4 | G***L*** (66.2%) | GGG*L*** (35.7%) | **GG*LGG (23.2%) | ||
| G***LL** (21.4%) | G*GG*LG* (22.2%) | ||||
| 5 | GL*GLLG* (34.9%) | G*GG*LG* (35.3%) | G*GG**GG (22.2%) | ||
| G***L*** (21.6%) | *LG*LLG* (22.2%) | ||||
| ***GL*** (21.1%) | 12 | *L**L*** (16.3%) | *LG*L*G* (38.8%) | ||
| *L***L** (20.5%) | *LG****G (35.7%) | ||||
| *L*G**** (20.0%) | **G***GG (34.7%) | ||||
| ****LLG* (20.0%) | *L**L**G (33.7%) | ||||
| 6 | GL****L* (35.1%) | *L****L* (37.9%) | *L****GG (33.7%) | ||
| 7 | GLGG***G (52.8%) | GLGG***G (48.9%) | ****L*GG (31.6%) | ||
| GLGG*L** (33.7%) | *L***L** (34.4%) | **G*L**G (30.6%) | |||
| GLG**L*G (30.7%) | G*G*L*** (30.0%) | GL****** (23.5%) | |||
| *L****G* (30.7%) | G****L** (30.0%) | G*****G* (23.5%) | |||
| GLGGL*** (30.1%) | *LG*L*** (30.0%) | *LG*L*GG (23.5%) | |||
| GLG*LL** (30.1%) | GLGGL**G (23.3%) | G*G***** (22.4%) | |||
| GLGGLL** (26.4%) | *L***LL* (23.3%) | G***L*** (22.4%) | |||
| GLGG*L*G (20.9%) | GLGG*L*G (21.1%) | G******G (20.4%) | |||
| GLGG**G* (22.1%) | GL**LL** (20.0%) | 13 | ****G**G (21.1%) | G******G (40.2%) | |
| GLGGL**G (21.5%) | G*G*LL** (20.0%) | ***L***G (23.0%) | |||
| GLG*LL*G (21.5%) | G*****L* (20.0%) | G**L**** (22.1%) | |||
| GLG***GG (21.5%) | ****LL*G (20.0%) | ****G**G (22.1%) | |||
| *L*G**GG (20.9%) | ****L*L* (20.0%) | G*G***** (21.3%) | |||
| G**G**GG (20.2%) | ******GG (20.5%) | ||||
| **GG**GG (20.2%) |
Major clonal patterns are shown in bold. The order of the probes in the comparator string is COX2, DBC2, MYC, CCND1, CDH1, TP53, HER2, ZNF217.
Clonal Evolution
In general, we discerned four categories of different progression patterns from DCIS to IDC, which are described in detail in the following paragraphs.
Category I included four cases in which the major imbalance clone in the DCIS was also dominant in the IDC. Supplemental Figure S1G (available at http://ajp.amjpathol.org), shows that the most frequent imbalance clone in the DCIS and the IDC of case 7 had gains of COX2, MYC, CCND1, and ZNF217 and a loss of DBC2, whereas CDH1, TP53, and HER2 were unchanged. In the second most frequent imbalance clone, additional losses of CDH1 and TP53 were observed for both lesions, whereas HER2 was gained in the DCIS and lost in the IDC clone. The signal patterns suggested isochromosome formation 8q for most of the DCIS and IDC cells and isochromosome 17q for a subset of the DCIS cells; however, a stable signal pattern clone was not present (Table 4). Case 9 (see Supplemental Figure S1I at http://ajp.amjpathol.org) revealed a pattern consistent with isochromosomes 8q and 17q. All oncogenes were gained and all tumor suppressor genes were lost, and we observed major, identical imbalance clones. Case 1 (Figure 4A) revealed gains of COX2, DBC2, and MYC and a loss of CDH1 and a major signal pattern clone in 16% and 13% of DCIS and IDC, respectively (pattern 33421222 in Table 4). It also had a minor signal pattern clone with a 32421222 pattern (5% and 6%, respectively; Table 4). The latter pattern would be consistent with the acquisition of isochromosome 8q, whereas the major pattern could be explained by a gain of two chromosomes 8, one of which lost DBC2. Finally, case 8 (see Supplemental Figure S1H at http://ajp.amjpathol.org) was dominated by losses of DBC2 and CDH1 and a gain of MYC, again consistent with isochromosome 8q, and contained identical signal clones (Table 4).
Category II included one case (case 2 in Figure 4B) in which one of several major imbalance clones in the DCIS later dominated the IDC. This clone displayed a gain of COX2 and a loss of CDH1. The second most frequent clone in the IDC displayed a 32221122 pattern (Table 4) corresponding to a TP53 loss in addition to the COX2 gain and CDH1 loss. This signal pattern clone was not detected in the DCIS, indicating that the TP53 loss was a late event. The frequent DCIS clone with gains of COX2 and ZNF217 was not carried over to the IDC. This particular DCIS was the most stable case (instability index, 14.5) and revealed three signal pattern clones that accounted for >50% of all the nuclei. The IDC showed markedly more instability (instability index, 49.7; Table 4).
Category III contained case 3 (Figure 4C), for which the dominant clone in the DCIS, which was defined by losses of DBC2, CDH1, and TP53 and gains of MYC and CCND1, was found among two major clones in the IDC. The second IDC clone exhibited a COX2 gain as the only change. Consequently, the percentages of MYC and CCND1 gains and DBC2, CDH1, and TP53 losses were substantially lower in the IDC than in the DCIS.
Finally, category IV comprised six cases in which we observed a switch of a major clone between the DCIS and the IDC. In four of these cases, the progression from DCIS to IDC was defined by the acquisition of extra copies of the MYC oncogene. In case 10 (see Supplemental Figure S1J at http://ajp.amjpathol.org), the major clone in the IDC showed losses of DBC2, CDH1, and the entire chromosome 17 and a gain of MYC not present in the DCIS. In case 4 (Figure 4D), the 1q/16q pattern that defined the DCIS was replaced by a clone that in addition to the COX2 gain and CDH1 loss showed gains of DBC2 (8p) and MYC (8q) that would be indicative of the gain of the entire chromosome 8, whereas in case 12 (see Supplemental Figure S1L at http://ajp.amjpathol.org), gains of MYC, HER2, and ZNF217 emerged after the transition to IDC. The dominant DCIS clone exhibiting a sole loss of CCND1 was not present in the IDC. In case 5 (Figure 4E), three frequent signal pattern clones were detected in the DCIS (22% 31231132, 16% 31221132, and 7% 31241132; Table 4), which resulted in a major imbalance clone defined by gains of COX2, CCND1, and HER2 and losses of DBC2, CDH1, and TP53. In contrast, the major imbalance clone in the IDC displayed an additional MYC gain, whereas DBC2 and CDH1 were not lost. This clone was represented by the following new signal pattern clones: 42332132 (11%) and 42342132 (6%), as shown in Table 4. The signal numbers for TP53 and HER2 were consistent with isochromosome 17q and identical between the DCIS and IDC clones, which might indicate a common origin for the evolution of these clones. The DCIS contained two cells with the exact signal pattern of the major cancer clone and one cell with the second most common cancer clone pattern. On the other hand, 13 cells (7%) in the IDC exhibited the major signal patterns of the DCIS. In case 11 (see Supplemental Figure S1K at http://ajp.amjpathol.org), losses of CDH1 and TP53 occurred only in the IDC, which also had acquired extra copies of HER2, whereas the DBC2 loss and MYC amplification were already present in the DCIS. The signal count for MYC was more stable in the IDC. In case 6 (Figure 4F), a prominent gain of COX2 was not maintained in the associated IDC; however, the DBC2 loss and an unusual HER2 loss persisted.
In one case (case 13; see Supplemental Figure S1M at http://ajp.amjpathol.org), it was difficult to determine a dominant clone because no stable signal clone evolved. With most signal counts fluctuating between two and four signals and with only COX2 and ZNF217 being more consistently in the four-signal range, this case seems to be quite different from the others. However, the IDC and DCIS cells, although the latter in a smaller fraction, showed the same kind of instability and tendency for higher copy numbers for COX2 and ZNF217, suggesting a relationship.
From these data, we inferred progression patterns from DCIS to IDC, which are presented in Figure 5, with representative examples for each of the four categories.
Figure 5.
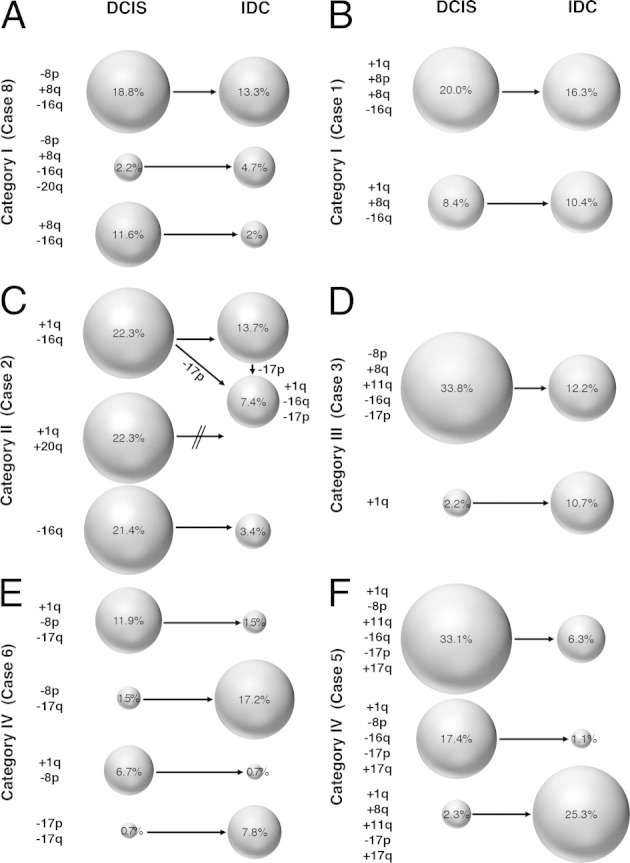
Schematic presentation of examples of clonal evolution in categories I (A and B), II (C), III (D), and IV (E and F) based on the presence of imbalance clones. These graphs were derived from the results summarized in Figure 4 and in Supplemental Figure S1 (available at http://ajp.amjpathol.org). For example, in case 8 (A), the major clone in DCIS [an 18.8% gain of MYC (+8q), losses of DBC2 (−8p) and CDH1 (−16q)] was also the major clone in IDC (13.3%). A rare clone in the DCIS (a gain of MYC, losses of DBC2, CDH1, and ZNF217) expanded to become the second largest clone, whereas the second largest clone in DCIS (a gain of MYC, a loss of CDH1) became rare in the IDC. The text on the left of each panel denotes whether specific chromosome arms are gained (+) or lost (−). The sizes of the circles reflect the frequency with which a clone occurred, which is specified by the percentages in the circles as well. In C, the clone that occurred in 7.4% in the IDC could have emerged by losses of 17p from either the major clone in the DCIS (+1q, −16q) or the IDC clone present in 13.7% of the cells. Note that one of the major clones in the DCIS (+1q, +20q) vanished in the IDC.
Conclusions
The aberration patterns of DCIS suggest that these lesions are well advanced in the progression to an invasive carcinoma because in most cases the targeted loci were already gained or lost and the instability index was high. From a mechanistic point of view, the observed patterns point to isochromosome formation for 8q and, to a lesser extent, 17q. Gains of COX2 and MYC, together with losses of DBC2, CDH1, and TP53, occurred most frequently. The relationship between DCIS and IDC was also investigated by developing rule-based models, which will be reported separately. We did not notice that certain gains and losses were correlated with each other, and neither was it such that certain gains and losses precluded the necessity to acquire additional changes. However, two of the three cases without a MYC gain in the major IDC clone presented with imbalance clones defined by only two gene changes on a diploid background; one case was consistent with the already mentioned 1q/16q pathway, and one case displayed an unusual HER2 loss combined with a DBC2 loss. The latter tumor was found in a young woman (33 years old) and presented with a size of 4.5 cm. The remaining case without a MYC gain was case 13, for which we could not establish a clear major clone pattern. The gain of MYC, in terms of cells in each of the tumors with a gain of this oncogene and in terms of cases of IDC, seems to be a marker for progression from localized to invasive disease.
Discussion
In ∼45% of breast carcinomas, the invasive lesion, IDC, is accompanied by a synchronous, noninvasive DCIS.1 A considerable body of literature suggests that there are similarities in terms of the aberration patterns between these lesions (reviewed by Sgroi2). This evidence is based on gene expression analyses,12–14,18,20,21 CGH,8–11,16,17,19,20 FISH,15,43–45 and molecular inversion probe arrays,46 which analyze DNA or RNA extracted from bulk tumor samples.
Herein, we used single-cell genetic analysis based on interphase cytogenetics to understand genome dynamics during progression. This allowed us to dissect pathways of carcinogenesis and to identify patterns of genomic imbalances and clonal evolution. We used four FISH probe panels that target eight chromosomal arms frequently subject to copy number changes in breast cancer (plus two centromere probes). The sequential hybridization of these panels to nuclei prepared from synchronous DCIS and IDC enabled us to enumerate all probe counts in single, individual cells to determine nonrandom chromosomal gains and losses, to assess the degree of intratumor heterogeneity, and to reconstruct clonal relationships between these lesions.
We observed an astonishingly high degree of chromosomal instability from one cell to another, which was reflected in the fact that identical signal clones were present in <20% of the cells, except for three samples (Figure 4 and Table 4; see also Supplemental Figure S1 at http://ajp.amjpathol.org). Despite this instability, in most cases, the distribution of gains and losses was consistent with the genomic aberration profile described previously for breast cancer,47,48 specifically, the relative gains of chromosome arms 1q, 8q, 11q, 17q, and 20q, accompanied by losses of chromosome arms 8p, 16q, and 17p. This was also reflected by the aberration patterns of the four cases subsumed in category I. In these cases, it seemed likely that the DCIS and the IDC are related since the same major imbalance clone(s) was found in the DCIS and the adjacent IDC. All these cases showed a prominent gain of MYC and a loss of CDH1, frequently also accompanied by a gain of COX2 and a loss of DBC2. We interpreted this finding to indicate, in accordance with the results shown in Figure 4 and Supplemental Figure S1 (available at http://ajp.amjpathol.org), that copy number changes of these loci, once acquired in DCIS, continue to be strongly selected for during the progression to invasive disease. It also means that alterations to an established breast cancer–specific imbalance pattern were not likely to change during progression to an invasive phenotype. A pictorial presentation of clonal progression patterns in two cases in category I is presented in Figure 5, A and B.
An obvious degree of relatedness was also observed in categories II and III. In category II, which is represented by case 2, only one of three major clones in DCIS (gain of COX2 and loss of CDH1) was dominant in the IDC (Figure 4B). The most frequently observed clone in the DCIS (gains of COX2 and ZNF217) was not present in the IDC, and the clone defined by the sole loss of CDH1 in the DCIS was significantly less abundant in the IDC. We interpret this finding to indicate that the loss of cell adhesion alone, as reflected by a copy number loss of CDH1, is not sufficiently competitive during progression. However, the sole gain of two oncogenes in the absence of loss of CDH1 also does not prevail, but rather the combination of CDH1 loss and COX2 gain. The emergence of a frequent clone with the additional loss of TP53 after transition to IDC suggests that this loss is a late event (Figure 5C). In case 3, in category III, a clearly dominant clone in DCIS (gains of MYC and CCND1 and losses of DBC2, CDH1, and TP53) was one of two clones in IDC, albeit considerably less frequent (Figure 4C). The second most common clone, characterized by the sole gain of COX2, was present in only three cells in the DCIS. Despite the relatedness of the most common clone, this observation would indicate a parallel evolution during disease progression. Also, a clone with a single aberration would compete against one with imbalances in five of eight genes associated with breast tumorigenesis (Figure 5D).
In 6 of 13 cases (category IV), the imbalance clones shifted during the progression from DCIS to IDC, which triggered the interpretation that even if genomic gains and losses that favor tumor progression were acquired in DCIS, they were not necessarily maintained in the matched IDC. For example, in case 6, the clone defining the IDC (losses of DBC2 and HER2) was present in only two cells in the DCIS. The major clone in DCIS, which contained in addition to losses of DBC2 and HER2 a gain of COX2, did not prevail in the IDC (Figure 5E). In four of the six cases in category IV, the clonal switch from DCIS to IDC was associated with the gain of MYC in >50% of the cells. This gain could occur either as a gain of the entire chromosome 8 (case 4) or as an isochromosome 8q (case 12; see Supplemental Figure S1L at http://ajp.amjpathol.org). Case 5 (Figure 4E) serves as an example of a MYC gain during progression. None of the major clones in the DCIS that did not carry a gain of MYC were still present in substantial numbers in the IDC, yet the major IDC clone was defined by gains of MYC even in the absence of losses of two tumor suppressor genes (DBC2 and CDH1), although these losses were part of the major DCIS clone. Thus, it seems that extra copies of MYC are important for the acquisition of an invasive phenotype (Figure 5F).
In two cases, the shift of the major clone did not depend on the acquisition of a MYC gain in the IDC. Case 6 has already been discussed. In the other case (case 11; see Supplemental Figure S1K at http://ajp.amjpathol.org), the amplification of MYC and the loss of DBC2 that were already present in the DCIS were maintained in the IDC; however, new aberrations, such as CDH1 loss, TP53 loss, and HER2 gain, consistent with an isochromosome 17q formation, emerged as additional changes.
Intuitively, the relatedness of DCIS and IDC with respect to disease progression would be reflected in a pattern in which clones that emerged in the preinvasive lesion prevailed in the IDC. This pattern would be consistent with the hypothesis that the cells in a precursor lesion such as DCIS are continuously evolving, resulting in clonal expansion of the most successful combination of traits. Such an evolutionary progression, in which each intermediate step of gains and losses would be represented in the sample, was not always observed. This gap might indicate that the pressure that forces the selection of a certain imbalance clone can change during progression, eg, from a primarily growth-promoting incentive in the DCIS to an environment in which invasiveness and perhaps avoidance of programmed cell death become more important. The gain of MYC, or the expansion of clones that carry MYC gains, seems to play a major role in this transition in the present samples; this is consistent with the prominent role that MYC plays as a regulator of epithelial/mesenchymal transition, invasion, and metastasis.27
The fact that despite the high degree of genomic instability in most instances, imbalance patterns consistent with those observed in the IDC were already present in the DCIS indicates that DCIS and IDC are genetically related lesions, not unlike preinvasive precursor lesions in cervical and colorectal tumorigenesis.49–51 However, the DCIS lesions are, according to their aberration patterns, far further advanced than, eg, colorectal polyps or cervical dysplasias, in which the genome remains more stable, and gains and losses of single chromosomes, often in a diploid genome, are more common.50,51 Chromosomal instability, defined herein as a variability in the signal patterns from one cell to another in a tumor cell population, is predominant in DCIS and IDC; hence, both can be considered late events in breast tumorigenesis. The considerable degree of intercellular heterogeneity in the DCIS convincingly attests to the fact that chromosomal instability precedes the transition to invasive disease. This result would be consistent with the interpretation that chromosomal instability per se is a necessary condition for the acquisition of an imbalance spectrum that is required for cancer progression and invasiveness. This nimbleness of cancer cells, reflected by the considerable instability index, might allow adaptation to environmental stressors that are associated with hypoxia, the process of invasion and metastasis, and treatment interventions, all of which are challenges that a carcinoma as a novel species has to overcome when evolving from local to advanced and disseminated disease.52–54
The high degree of aneuploidy and chromosomal instability further corroborate the central role of these genome mutations in cancer and support the interpretation that genomic instability alone can serve as a potent biomarker for progression risk and clinical outcome.55–57 In a previous FISH study of breast carcinomas, we showed that this degree of genomic instability and intratumor heterogeneity, as determined by quantitative measurement of the DNA content and by FISH, determined outcome.58 Aubele et al59,60 demonstrated elegantly the important role of intratumoral heterogeneity in breast lesions using laser-capture microdissection and CGH on ductal hyperplasia, DCIS, and invasive carcinomas. Recently, Gerlinger et al61 revealed considerable fluctuation in the mutation spectrum in individual tumors by applying exome sequence analysis, chromosome aberration analysis, and ploidy profiling to multiple microdissected regions of renal cell carcinomas and their metastases. This heterogeneity was attributable to a distinct clonal mutation spectrum and to aneuploidy. Arguably, measuring potentially relevant biomarkers for a bulk tumor sample would underestimate the degree of clonal variability. This is supported by the present findings.
From a clinical point of view, the high degree of chromosomal instability and the advanced aberration profile of DCIS make it unlikely that progression to invasive disease can be prevented with measures other than surgery and radiation. It is difficult to imagine that the enormous number of genomic imbalances and the sheer number of independent clones could be reversed by interventions that would be accepted in the realm of cancer prevention, not cancer therapy. It also seems reasonable to infer that among the many independent imbalance composition clones, some that are equipped with an aberration pattern required for metastases already exist in the DCIS.52,62
For patients with cancer, the transition from locally controlled disease to a disseminated stage and metastases is perhaps the most critical threshold because that transition makes surgical intervention with curative intent considerably less likely to succeed. We could now show that preinvasive DCIS, which is associated with excellent 5-year survival rates, is defined by chromosomal aberration patterns and degrees of genomic instability similar to invasive disease. This, of course, raises the following question: What precisely determines this critical transition between preinvasive and invasive disease? It is now established that chromosomal imbalances directly affect the transcription of genes that reside on chromosomes or chromosomal regions affected by copy number changes.63 The enormous amount of chromosomal gains and losses in DCIS and IDC, therefore, results in a massive deregulation of the cancer transcriptome, which is a direct reflection of the distribution of genomic imbalances. Consequently, the idiosyncrasies of aneuploidy-dependent transcriptional changes of individual tumors might hamper attempts to dissect gene expression profiles that distinguish the noninvasive from the invasive and metastatic phenotype. We submit that careful cataloguing of differences in the transcriptome of DCIS and IDC, in particular in cases in which a major aberrant clone is present in both entities, such as in the cases compiled in category I, could have the potential of identifying a gene expression signature that is ultimately responsible for invasion and disease progression.
Acknowledgments
We thank Semhar Tewelde and Starsha Valentine for expert technical assistance, Buddy Chen for help with the illustrations, Dr. Reinhard Ebner for critical reading of the manuscript, and Dr. Gert Auer for continuing valuable discussions.
Footnotes
Supported in part by the Intramural Research Program of the NIH, National Cancer Institute, and National Library of Medicine and by NIH grants 1R01CA140214 (R.S. and S.A.C.) and 1R01AI076318 (R.S.).
Supplemental material for this article can be found at http://ajp.amjpathol.org or at http://dx.doi.org/10.1016/j.ajpath.2012.07.012.
Current address of R.C., Norton Healthcare, CPA Laboratory, Louisville, Kentucky; and of P.W.S., Department of Surgery, Naval Medical Center San Diego, San Diego, California.
Supplementary data
Summary of imbalance clones in the remaining 7 of the 13 cases of DCIS and IDC (cases 7 to 13, G–M). Green, gains; red, losses; blue, unchanged. The organization of the graphs is the same for all the cases and is explained in the legend for Figure 4 (using case 1 as an example).
References
- 1.von Minckwitz G., Darb-Esfahani S., Loibl S., Huober J., Tesch H., Solbach C., Holms F., Eidtmann H., Dietrich K., Just M., Clemens M.R., Hanusch C., Schrader I., Henschen S., Hoffmann G., Tiemann K., Diebold K., Untch M., Denkert C. Responsiveness of adjacent ductal carcinoma in situ and changes in HER2 status after neoadjuvant chemotherapy/trastuzumab treatment in early breast cancer: results from the GeparQuattro study (GBG 40) Breast Cancer Res Treat. 2012;132:863–870. doi: 10.1007/s10549-011-1621-0. [DOI] [PubMed] [Google Scholar]
- 2.Sgroi D.C. Preinvasive breast cancer. Annu Rev Pathol. 2010;5:193–221. doi: 10.1146/annurev.pathol.4.110807.092306. [DOI] [PMC free article] [PubMed] [Google Scholar]
- 3.Virnig B.A., Tuttle T.M., Shamliyan T., Kane R.L. Ductal carcinoma in situ of the breast: a systematic review of incidence, treatment, and outcomes. J Natl Cancer Inst. 2010;102:170–178. doi: 10.1093/jnci/djp482. [DOI] [PubMed] [Google Scholar]
- 4.Jemal A., Bray F., Center M.M., Ferlay J., Ward E., Forman D. Global cancer statistics. CA Cancer J Clin. 2011;61:69–90. doi: 10.3322/caac.20107. [DOI] [PubMed] [Google Scholar]
- 5.Howlader N, Noone AM, Krapcho M, Neyman N, Aminou R, Altekruse SF, Kosary CL, Ruhl J, Tatalovich Z, Cho H, Mariotto A, Eisner MP, Lewis DR, Chen HS, Feuer EJ, Cronin KA (eds). SEER Cancer Statistics Review, 1975–2009 (Vintage 2009 Populations), National Cancer Institute. Bethesda, MD. Available at http://seer.cancer.gov/csr/1975_2009_pops09, based on November 2011 SEER data submission, posted online April 2012
- 6.Park S.Y., Gönen M., Kim H.J., Michor F., Polyak K. Cellular and genetic diversity in the progression of in situ human breast carcinomas to an invasive phenotype. J Clin Invest. 2010;120:636–644. doi: 10.1172/JCI40724. [DOI] [PMC free article] [PubMed] [Google Scholar]
- 7.O'Connell P., Pekkel V., Fuqua S.A., Osborne C.K., Clark G.M., Allred D.C. Analysis of loss of heterozygosity in 399 premalignant breast lesions at 15 genetic loci. J Natl Cancer Inst. 1998;90:697–703. doi: 10.1093/jnci/90.9.697. [DOI] [PubMed] [Google Scholar]
- 8.Buerger H., Otterbach F., Simon R., Schäfer K.L., Poremba C., Diallo R., Brinkschmidt C., Dockhorn-Dworniczak B., Boecker W. Different genetic pathways in the evolution of invasive breast cancer are associated with distinct morphological subtypes. J Pathol. 1999;189:521–526. doi: 10.1002/(SICI)1096-9896(199912)189:4<521::AID-PATH472>3.0.CO;2-B. [DOI] [PubMed] [Google Scholar]
- 9.Buerger H., Otterbach F., Simon R., Poremba C., Diallo R., Decker T., Riethdorf L., Brinkschmidt C., Dockhorn-Dworniczak B., Boecker W. Comparative genomic hybridization of ductal carcinoma in situ of the breast: evidence of multiple genetic pathways. J Pathol. 1999;187:396–402. doi: 10.1002/(SICI)1096-9896(199903)187:4<396::AID-PATH286>3.0.CO;2-L. [DOI] [PubMed] [Google Scholar]
- 10.Aubele M., Mattis A., Zitzelsberger H., Walch A., Kremer M., Welzl G., Hofler H., Werner M. Extensive ductal carcinoma in situ with small foci of invasive ductal carcinoma: evidence of genetic resemblance by CGH. Int J Cancer. 2000;85:82–86. doi: 10.1002/(sici)1097-0215(20000101)85:1<82::aid-ijc15>3.0.co;2-s. [DOI] [PubMed] [Google Scholar]
- 11.Buerger H., Mommers E.C., Littmann R., Simon R., Diallo R., Poremba C., Dockhorn-Dworniczak B., van Diest P.J., Boecker W. Ductal invasive G2 and G3 carcinomas of the breast are the end stages of at least two different lines of genetic evolution. J Pathol. 2001;194:165–170. doi: 10.1002/path.875. [DOI] [PubMed] [Google Scholar]
- 12.Porter D.A., Krop I.E., Nasser S., Sgroi D., Kaelin C.M., Marks J.R., Riggins G., Polyak K. A SAGE (serial analysis of gene expression) view of breast tumor progression. Cancer Res. 2001;61:5697–5702. [PubMed] [Google Scholar]
- 13.Ma X.-J., Salunga R., Tuggle J.T., Gaudet J., Enright E., McQuary P., Payette T., Pistone M., Stecker K., Zhang B.M., Zhou Y.-M., Varnholt H., Smith B., Gadd M., Chatfield E., Kessler J., Baer T.M., Erlander M.G., Sgroi D.C. Gene expression profiles of human breast cancer progression. Proc Natl Acad Sci U S A. 2003;100:5974–5979. doi: 10.1073/pnas.0931261100. [DOI] [PMC free article] [PubMed] [Google Scholar]
- 14.Porter D., Lahti-Domenici J., Keshaviah A., Bae Y.K., Argani P., Marks J., Richardson A., Cooper A., Strausberg R., Riggins G.J., Schnitt S., Gabrielson E., Gelman R., Polyak K. Molecular markers in ductal carcinoma in situ of the breast. Mol Cancer Res. 2003;1:362–375. [PubMed] [Google Scholar]
- 15.Robanus-Maandag E.C., Bosch C.A.J., Kristel P.M., Hart A.A.M., Faneyte I.F., Nederlof P.M., Peterse J.L., van de Vijver M.J. Association of C-MYC amplification with progression from the in situ to the invasive stage in C-MYC-amplified breast carcinomas. J Pathol. 2003;201:75–82. doi: 10.1002/path.1385. [DOI] [PubMed] [Google Scholar]
- 16.Hwang E.S., DeVries S., Chew K.L., Moore D.H., II, Kerlikowske K., Thor A., Ljung B.-M., Waldman F.M. Patterns of chromosomal alterations in breast ductal carcinoma in situ. Clin Cancer Res. 2004;10:5160–5167. doi: 10.1158/1078-0432.CCR-04-0165. [DOI] [PubMed] [Google Scholar]
- 17.Yao J., Weremowicz S., Feng B., Gentleman R.C., Marks J.R., Gelman R., Brennan C., Polyak K. Combined cDNA array comparative genomic hybridization and serial analysis of gene expression analysis of breast tumor progression. Cancer Res. 2006;66:4065–4078. doi: 10.1158/0008-5472.CAN-05-4083. [DOI] [PubMed] [Google Scholar]
- 18.Allred D.C., Wu Y., Mao S., Nagtegaal I.D., Lee S., Perou C.M., Mohsin S.K., O'Connell P., Tsimelzon A., Medina D. Ductal carcinoma in situ and the emergence of diversity during breast cancer evolution. Clin Cancer Res. 2008;14:370–378. doi: 10.1158/1078-0432.CCR-07-1127. [DOI] [PubMed] [Google Scholar]
- 19.Iakovlev V.V., Arneson N.C.R., Wong V., Wang C., Leung S., Iakovleva G., Warren K., Pintilie M., Done S.J. Genomic differences between pure ductal carcinoma in situ of the breast and that associated with invasive disease: a calibrated aCGH study. Clin Cancer Res. 2008;14:4446–4454. doi: 10.1158/1078-0432.CCR-07-4960. [DOI] [PubMed] [Google Scholar]
- 20.Vincent-Salomon A., Lucchesi C., Gruel N., Raynal V., Pierron G., Goudefroye R., Reyal F., Radvanyi F., Salmon R., Thiery J.P., Sastre-Garau X., Sigal-Zafrani B., Fourquet A., Delattre O. Integrated genomic and transcriptomic analysis of ductal carcinoma in situ of the breast. Clin Cancer Res. 2008;14:1956–1965. doi: 10.1158/1078-0432.CCR-07-1465. [DOI] [PubMed] [Google Scholar]
- 21.Miron A., Varadi M., Carrasco D., Li H., Luongo L., Kim H.J., Park S.Y., Cho E.Y., Lewis G., Kehoe S., Iglehart J.D., Dillon D., Allred D.C., Macconaill L., Gelman R., Polyak K. PIK3CA mutations in in situ and invasive breast carcinomas. Cancer Res. 2010;70:5674–5678. doi: 10.1158/0008-5472.CAN-08-2660. [DOI] [PMC free article] [PubMed] [Google Scholar]
- 22.Moelans C.B., de Weger R.A., Monsuur H.N., Maes A.H., van Diest P.J. Molecular differences between ductal carcinoma in situ and adjacent invasive breast carcinoma: a multiplex ligation-dependent probe amplification study. Anal Cell Pathol (Amst) 2010;33:165–173. doi: 10.3233/ACP-CLO-2010-0546. [DOI] [PMC free article] [PubMed] [Google Scholar]
- 23.Hernandez L., Wilkerson P.M., Lambros M.B., Campion-Flora A., Rodrigues D.N., Gauthier A., Cabral C., Pawar V., Mackay A., A'Hern R., Marchio C., Palacios J., Natrajan R., Weigelt B., Reis-Filho J.S. Genomic and mutational profiling of ductal carcinomas in situ and matched adjacent invasive breast cancers reveals intra-tumour genetic heterogeneity and clonal selection. J Pathol. 2012;227:42–52. doi: 10.1002/path.3990. [DOI] [PMC free article] [PubMed] [Google Scholar]
- 24.Howe L.R., Subbaramaiah K., Brown A.M.C., Dannenberg A.J. Cyclooxygenase-2: a target for the prevention and treatment of breast cancer. Endocr Relat Cancer. 2001;8:97–114. doi: 10.1677/erc.0.0080097. [DOI] [PubMed] [Google Scholar]
- 25.Hamaguchi M., Meth J.L., von Klitzing C., Wei W., Esposito D., Rodgers L., Walsh T., Welcsh P., King M.-C., Wigler M.H. DBC2, a candidate for a tumor suppressor gene involved in breast cancer. Proc Natl Acad Sci U S A. 2002;99:13647–13652. doi: 10.1073/pnas.212516099. [DOI] [PMC free article] [PubMed] [Google Scholar]
- 26.Yoshihara T., Collado D., Hamaguchi M. Cyclin D1 down-regulation is essential for DBC2's tumor suppressor function. Biochem Biophys Res Commun. 2007;358:1076–1079. doi: 10.1016/j.bbrc.2007.05.037. [DOI] [PMC free article] [PubMed] [Google Scholar]
- 27.Wolfer A., Ramaswamy S. MYC and metastasis. Cancer Res. 2011;71:2034–2037. doi: 10.1158/0008-5472.CAN-10-3776. [DOI] [PMC free article] [PubMed] [Google Scholar]
- 28.Fu M., Wang C., Li Z., Sakamaki T., Pestell R.G. Minireview: cyclin D1: normal and abnormal functions. Endocrinology. 2004;145:5439–5447. doi: 10.1210/en.2004-0959. [DOI] [PubMed] [Google Scholar]
- 29.Birchmeier W., Behrens J. Cadherin expression in carcinomas: role in the formation of cell junctions and the prevention of invasiveness. Biochim Biophys Acta. 1994;1198:11–26. doi: 10.1016/0304-419x(94)90003-5. [DOI] [PubMed] [Google Scholar]
- 30.Yarden Y., Sliwkowski M.X. Untangling the ErbB signalling network. Nat Rev Mol Cell Biol. 2001;2:127–137. doi: 10.1038/35052073. [DOI] [PubMed] [Google Scholar]
- 31.Tan M., Yu D. Molecular mechanisms of erbB2-mediated breast cancer chemoresistance. Adv Exp Med Biol. 2007;608:119–129. doi: 10.1007/978-0-387-74039-3_9. [DOI] [PubMed] [Google Scholar]
- 32.Riley T., Sontag E., Chen P., Levine A. Transcriptional control of human p53-regulated genes. Nat Rev Mol Cell Biol. 2008;9:402–412. doi: 10.1038/nrm2395. [DOI] [PubMed] [Google Scholar]
- 33.Vousden K.H., Prives C. Blinded by the light: the growing complexity of p53. Cell. 2009;137:413–431. doi: 10.1016/j.cell.2009.04.037. [DOI] [PubMed] [Google Scholar]
- 34.Read A.P., Strachan T. Human Molecular Genetics. Wiley-Liss; New York: 1999. Cancer Genetics; pp. 427–442. [Google Scholar]
- 35.Vousden K.H., Lane D.P. p53 in health and disease. Nat Rev Mol Cell Biol. 2007;8:275–283. doi: 10.1038/nrm2147. [DOI] [PubMed] [Google Scholar]
- 36.Nonet G.H., Stampfer M.R., Chin K., Gray J.W., Collins C.C., Yaswen P. The ZNF217 gene amplified in breast cancers promotes immortalization of human mammary epithelial cells. Cancer Res. 2001;61:1250–1254. [PubMed] [Google Scholar]
- 37.Edge S.B., Byrd D.R., Compton C.C., editors. AJCC Cancer Staging Manual. 7th ed. Springer; New York, NY: 2010. Breast; pp. 347–376. [Google Scholar]
- 38.Wangsa D., Heselmeyer-Haddad K., Ried P., Eriksson E., Schäffer A.A., Morrison L.E., Luo J., Auer G., Munck-Wikland E., Ried T., Lundqvist E.Å. Fluorescence in situ hybridization markers for prediction of cervical lymph node metastases. Am J Pathol. 2009;175:2637–2645. doi: 10.2353/ajpath.2009.090289. [DOI] [PMC free article] [PubMed] [Google Scholar]
- 39.Bergamaschi A., Kim Y.H., Wang P., Sørlie T., Hernandez-Boussard T., Lonning P.E., Tibshirani R., Børresen-Dale A.L., Pollack J.R. Distinct patterns of DNA copy number alteration are associated with different clinicopathological features and gene-expression subtypes of breast cancer. Genes Chromosomes Cancer. 2006;45:1033–1040. doi: 10.1002/gcc.20366. [DOI] [PubMed] [Google Scholar]
- 40.Ried T. Homage to Theodor Boveri (1862–1915): Boveri's theory of cancer as a disease of the chromosomes, and the landscape of genomic imbalances in human carcinomas. Environ Mol Mutagen. 2009;50:593–601. doi: 10.1002/em.20526. [DOI] [PubMed] [Google Scholar]
- 41.Beroukhim R., Mermel C.H., Porter D., Wei G., Raychaudhuri S., Donovan J. The landscape of somatic copy-number alteration across human cancers. Nature. 2010;463:899–905. doi: 10.1038/nature08822. [DOI] [PMC free article] [PubMed] [Google Scholar]
- 42.Kwei K.A., Kung Y., Salari K., Holcomb I.N., Pollack J.R. Genomic instability in breast cancer: pathogenesis and clinical implications. Mol Oncol. 2010;4:255–266. doi: 10.1016/j.molonc.2010.04.001. [DOI] [PMC free article] [PubMed] [Google Scholar]
- 43.Aulmann S., Bentz M., Sinn H.P. C-myc oncogene amplification in ductal carcinoma in situ of the breast. Breast Cancer Res Treat. 2002;74:25–31. doi: 10.1023/a:1016061327812. [DOI] [PubMed] [Google Scholar]
- 44.Chin K., de Solorzano C.O., Knowles D., Jones A., Chou W., Rodriguez E.G., Kuo W.-L., Ljung B.-M., Chew K., Myambo K., Miranda M., Krig S., Garbe J., Stampfer M., Yaswen P., Gray J.W., Lockett S.J. In situ analyses of genome instability in breast cancer. Nat Genet. 2004;36:984–988. doi: 10.1038/ng1409. [DOI] [PubMed] [Google Scholar]
- 45.Park K., Han S., Kim H.J., Kim J., Shin E. HER2 status in pure ductal carcinoma in situ and in the intraductal and invasive components of invasive ductal carcinoma determined by fluorescence in situ hybridization and immunohistochemistry. Histopathology. 2006;48:702–707. doi: 10.1111/j.1365-2559.2006.02403.x. [DOI] [PubMed] [Google Scholar]
- 46.Johnson C.E., Gorringe K.L., Thompson E.R., Opeskin K., Boyle S.E., Wang Y., Hill P., Mann G.B., Campbell I.G. Identification of copy number alterations associated with the progression of DCIS to invasive ductal carcinoma. Breast Cancer Res Treat. 2011;133:889–898. doi: 10.1007/s10549-011-1835-1. [DOI] [PubMed] [Google Scholar]
- 47.Kallioniemi A., Kallioniemi O.P., Piper J., Tanner M., Stokke T., Chen L., Smith H.S., Pinkel D., Gray J.W., Waldman F.M. Detection and mapping of amplified DNA sequences in breast cancer by comparative genomic hybridization. Proc Natl Acad Sci U S A. 1994;91:2156–2160. doi: 10.1073/pnas.91.6.2156. [DOI] [PMC free article] [PubMed] [Google Scholar]
- 48.Ried T., Just K.E., Holtgreve-Grez H., du Manoir S., Speicher M.R., Schröck E., Latham C., Blegen H., Zetterberg A., Cremer T., Auer G. Comparative genomic hybridization of formalin-fixed, paraffin-embedded breast tumors reveals different patterns of chromosomal gains and losses in fibroadenomas and diploid and aneuploid carcinomas. Cancer Res. 1995;55:5415–5423. [PubMed] [Google Scholar]
- 49.Heselmeyer-Haddad K., Janz V., Castle P.E., Chaudhri N., White N., Wilber K., Morrison L.E., Auer G., Burroughs F.H., Sherman M.E., Ried T. Detection of genomic amplification of the human telomerase gene (TERC) in cytologic specimens as a genetic test for the diagnosis of cervical dysplasia. Am J Pathol. 2003;163:1405–1416. doi: 10.1016/S0002-9440(10)63498-0. [DOI] [PMC free article] [PubMed] [Google Scholar]
- 50.Andersson S., Sowjanya P., Wangsa D., Hjerpe A., Johansson B., Auer G., Gravitt P.E., Larsson C., Wallin K.-L., Ried T., Heselmeyer-Haddad K. Detection of genomic amplification of the human telomerase gene TERC, a potential marker for triage of women with HPV-positive, abnormal Pap smears. Am J Pathol. 2009;175:1831–1847. doi: 10.2353/ajpath.2009.090122. [DOI] [PMC free article] [PubMed] [Google Scholar]
- 51.Habermann J.K., Brucker C.A., Freitag-Wolf S., Heselmeyer-Haddad K., Krüger S., Barenboim L., Downing T., Bruch H.-P., Auer G., Roblick U.J., Ried T. Genomic instability and oncogene amplifications in colorectal adenomas predict recurrence and synchronous carcinoma. Mod Pathol. 2011;24:542–555. doi: 10.1038/modpathol.2010.217. [DOI] [PMC free article] [PubMed] [Google Scholar]
- 52.Bernards R., Weinberg R.A. A progression puzzle. Nature. 2002;418:823. doi: 10.1038/418823a. [DOI] [PubMed] [Google Scholar]
- 53.Talmadge J.E., Fidler I.J. AACR centennial series: the biology of cancer metastasis: historical perspective. Cancer Res. 2010;70:5649–5669. doi: 10.1158/0008-5472.CAN-10-1040. [DOI] [PMC free article] [PubMed] [Google Scholar]
- 54.Duesberg P., Mandrioli D., McCormack A., Nicholson J.M. Is carcinogenesis a form of speciation? Cell Cycle. 2011;10:2100–2114. doi: 10.4161/cc.10.13.16352. [DOI] [PubMed] [Google Scholar]
- 55.Auer G.U., Eriksson E., Azavedo E., Caspersson T., Wallgren A. Prognostic significance of nuclear DNA content in mammary adenocarcinomas in humans. Cancer Res. 1984;44:394–396. [PubMed] [Google Scholar]
- 56.Carter S.L., Eklund A.C., Kohane I.S., Harris L.N., Szallasi Z. A signature of chromosomal instability inferred from gene expression profiles predicts clinical outcome in multiple human cancers. Nat Genet. 2006;38:1043–1048. doi: 10.1038/ng1861. [DOI] [PubMed] [Google Scholar]
- 57.Habermann J.K., Doering J., Hautaniemi S., Roblick U.J., Bündgen N.K., Nicorici D., Kronenwett U., Rathnagiriswaran S., Mettu R.K.R., Ma Y., Krüger S., Bruch H.-P., Auer G., Guo N.L., Ried T. The gene expression signature of genomic instability in breast cancer is an independent predictor of clinical outcome. Int J Cancer. 2009;124:1552–1564. doi: 10.1002/ijc.24017. [DOI] [PMC free article] [PubMed] [Google Scholar]
- 58.Heselmeyer-Haddad K., Chaudhri N., Stoltzfus P., Cheng J.C., Wilber K., Morrison L., Auer G., Ried T. Detection of chromosomal aneuploidies and gene copy number changes in fine needle aspirates is a specific, sensitive, and objective genetic test for the diagnosis of breast cancer. Cancer Res. 2002;62:2365–2369. [PubMed] [Google Scholar]
- 59.Aubele M., Mattis A., Zitzelsberger H., Walch A., Kremer M., Hutzler P., Hofler H., Werner M. Intratumoral heterogeneity in breast carcinoma revealed by laser-microdissection and comparative genomic hybridization. Cancer Genet Cytogenet. 1999;110:94–102. doi: 10.1016/s0165-4608(98)00205-2. [DOI] [PubMed] [Google Scholar]
- 60.Aubele M., Cummings M., Walsch A., Zitzelsberger H., Nahrig J., Hofler H., Werner M. Heterogeneous chromosomal aberrations in intraductal breast lesions adjacent to invasive carcinoma. Anal Cell Pathol. 2000;20:17–24. doi: 10.1155/2000/930246. [DOI] [PMC free article] [PubMed] [Google Scholar]
- 61.Gerlinger M., Rowan A.J., Horswell S., Larkin J., Endesfelder D., Gronroos E., Martinez P., Matthews N., Stewart A., Tarpey P., Varela I., Phillimore B., Begum S., McDonald N.Q., Butler A., Jones D., Raine K., Latimer C., Santos C.R., Nohadani M., Eklund A.C., Spencer-Dene B., Clark G., Pickering L., Stamp G., Gore M., Szallasi Z., Downward J., Futreal P.A., Swanton C. Intratumor heterogeneity and branched evolution revealed by multiregion sequencing. N Engl J Med. 2012;366:883–892. doi: 10.1056/NEJMoa1113205. [DOI] [PMC free article] [PubMed] [Google Scholar]
- 62.Stoecklein N.H., Klein C.A. Genetic disparity between primary tumours, disseminated tumour cells, and manifest metastasis. Int J Cancer. 2010;126:589–598. doi: 10.1002/ijc.24916. [DOI] [PubMed] [Google Scholar]
- 63.Ried T., Hu Y., Difilippantonio M.J., Ghadimi B.M., Grade M., Camps J. The consequences of chromosomal aneuploidy on the transcriptome of cancer cells. Biochim Biophys Acta. 2012;1819:784–793. doi: 10.1016/j.bbagrm.2012.02.020. [DOI] [PMC free article] [PubMed] [Google Scholar]
Associated Data
This section collects any data citations, data availability statements, or supplementary materials included in this article.
Supplementary Materials
Summary of imbalance clones in the remaining 7 of the 13 cases of DCIS and IDC (cases 7 to 13, G–M). Green, gains; red, losses; blue, unchanged. The organization of the graphs is the same for all the cases and is explained in the legend for Figure 4 (using case 1 as an example).