

Abstract
Background. The objective was to determine whether relationships exist between the methylene-tetrahydrofolate reductase (MTHFR) polymorphisms and risk of colorectal cancer (CRC) and examine whether the risk is modified by level of folate intake. Methods. MEDLINE, Embase, and SCOPUS were searched to May 2012 using the terms “folic acid,” “folate,” “colorectal cancer,” “methylenetetrahydrofolate reductase,” “MTHFR.” Observational studies were included which (1) assessed the risk of CRC for each polymorphism and/or (2) had defined levels of folate intake for each polymorphism and assessed the risk of CRC. Results. From 910 references, 67 studies met our criteria; hand searching yielded 10 studies. The summary risk estimate comparing the 677CT versus CC genotype was 1.02 (95% CI 0.95–1.10) and for 677TT versus CC was 0.88 (95% CI 0.80–0.96) both with heterogeneity. The summary risk estimates for A1298C polymorphisms suggested no reduced risk. The summary risk estimate for high versus low total folate for the 677CC genotype was 0.70 (95% CI 0.56–0.89) and the 677TT genotype 0.63 (95% CI 0.41–0.97). Conclusion. These results suggest that the 677TT genotype is associated with a reduced risk of developing CRC, under conditions of high total folate intake, and this associated risk remains reduced for both MTHFR 677 CC and TT genotypes.
1. Introduction
Worldwide, colorectal cancer (CRC) is the third most frequently diagnosed cancer in males and the second in females [1]. Australia and New Zealand, Europe and North America have the highest incidence rates of CRC worldwide, and Africa and South-Central Asia, the lowest [1, 2]. Over 75% of CRCs occur sporadically, with only 25% of patients having a family history of CRC [3].
Folate insufficiency has been suggested as one of the possible mechanism for CRC development and progression. DNA strand breaks, impaired DNA methylation and repair have been associated with folate deficiency and CRC [4–7]. There are many enzymes involved with folates and one-carbon metabolism; however, the methylene tetrahydrofolate reductase (MTHFR) enzyme is a key enzyme responsible for determining whether reduced folates are directed towards DNA methylation pathways or pyrimidine or purine synthesis [8]. In 1995, a variant of MTHFR enzyme was identified which causes a substitution of C to T at nucleotide 677 [9]. The MTHFR C677T homozygous variant (TT genotype) is thermolabile, and its activity is reduced by 70% compared to the wild type (CC genotype) [10]. This reduced enzyme activity causes an accumulation of plasma homocysteine and higher rates of thymidylate synthesis [10, 11].
The distribution of the TT genotype varies from country to country. In Europe, there would appear to be a north-south gradient with the distribution of the TT genotype lowest in the north [12, 13] while in Asia, the frequency is highest in China and lowest in India [12, 14–18]. In North America, African Americans have a much lower TT genotype frequency versus Caucasians [19]. Individuals with this variant are thought to be at greater risk for a number of diseases including cardiovascular disease, acute lymphocytic leukemia, and neural tube defects [10]. Some published studies have suggested that those with the TT genotype have a reduced risk of CRC versus those with the CC genotype (wild type) [20–28]; however, other studies have found an increased risk [29–31].
A second variant of the MTHFR enzyme, with a substitution of A to C at nucleotide 1298, has also been identified. Unlike the MTHFR C677T polymorphism, the enzyme activities of the variants of MTHFR A1298C polymorphism are not thermolabile, but the enzyme activity is reduced by approximately 40% of the wild type (AA genotype) in the variant genotype. Altered homocysteine levels have not been found in individuals with these variants [32]. The prevalence of the 1298CC genotype varies, with the homozygous genotype found in 7–12% of Caucasians, in Europeans, 4–12%, while in China, Japan, and Hawaiian studies the prevalence ranged between 1 and 4% [32, 33].
The objective of this effort was to conduct a systematic review and meta-analysis of the published data to determine whether relationships exist between the various MTHFR polymorphisms and the incidence of CRC. A secondary objective was to examine whether there exists a relationship between the level of folate intake for each MTHFR genotype and the risk of CRC.
2. Methods and Materials
2.1. Inclusion Criteria
We selected observational studies reporting on the polymorphisms of the MTHFR C677T and/or A1298C genes and the associated risk of CRC, colon, or rectal cancer in adult populations. Studies were also included if they reported on folate exposure (dietary or total) with at least two levels of folate intake and the associated rates of colorectal, colon and/or rectal cancer by genotype. Studies were excluded if they did not provide the information necessary to determine an odds ratio and 95% confidence interval for each genotype. No restrictions were placed on language of publication or country of study.
2.2. Search Strategy
The databases MEDLINE, Embase, and Scopus on the OVID platform were searched from inception to May 2012. Both database-specific subject headings and text words were searched using the terms “folic acid” OR “folate” and “colorectal cancer” and “colorectal neoplasms” AND “methylenetetrahydrofolate reductase or MTHFR or C667T” limiting the results to humans only. The results of the search in each of the three databases were placed in a bibliography tool, and, in order to ensure blinding, an extract of author, title, and year information was made and uploaded into a spreadsheet for the purposes of title review. Title review was conducted by one reviewer (DAK) blinded to the journal of publication, place of research, and results, to determine which study articles to retrieve. The methods section of the selected journal articles were retrieved by other team members (MS and IM) not responsible for reviewing the journal articles. The method sections were reviewed by two independent reviewers (DAK, SJS) blinded to the journal of publication, place of research, and results as to their meeting the inclusion criteria. In case of disagreement between the two reviewers, a third reviewer served as a tiebreaker (GK). Previous reviews were also hand searched to identify other relevant publications to include.
2.3. Data Extraction
Data extraction was carried out by one reviewer and independently checked for accuracy by a second reviewer. Data collected included the type of study, location, study inclusion and exclusion criteria, case and comparator group size, folate intake levels, odds ratio or risk ratio, the number, for both case and control, and percentage frequency of each genotype, relevant adjustments, and conclusions. The genotype distribution of the control group was evaluated for agreement with the Hardy-Weinberg equilibrium (HWE) using chi-squared with a significant level of 0.05 and the results incorporated into Table 1.
Table 1.
(a) Characteristic of studies included in the systematic review and meta analysis.
| Study | Country | Year | Study design | Source of controls | Recruitment period | Cancer | Sex | Case/control | Distribution of MTHFR C677T genotype in controls | HWE (yes/no) |
Distribution of MTHFR A1298C genotype in controls |
HWE (yes/no) | Adjustments | ||||
|---|---|---|---|---|---|---|---|---|---|---|---|---|---|---|---|---|---|
| CC (%) | CT (%) | TT (%) | AA (%) | AC (%) | CC (%) | ||||||||||||
| Park et al. [34] | South Korea | 1999 | Case control | Healthy persons | Not reported | CRC | Both | 200/460 | 30.4 | 53.5 | 16.1 | No | Calculated OR, no adjustments | ||||
|
| |||||||||||||||||
| Delgado-Enciso et al. [15] | Mexico | 2001 | Case control | Not reported | 1997 | CRC | Both | 74/110 | 30.9 | 47.3 | 21.8 | Yes | Calculated OR, no adjustments | ||||
|
| |||||||||||||||||
| Keku et al. [35] | USA | 2002 | Case control | Healthy persons | 1996–2000 | Colon-Cauc | Both | 555/875 | 49.2 | 41.4 | 9.4 | Yes | 52.5 | 38.5 | 9.3 | Yes | Adjusted for sampling fraction, age, gender, and energy intake |
|
| |||||||||||||||||
| Le Marchand et al. [23] | USA | 2002 | Matched case control | Healthy persons | 1994–1998 | CRC | Both | 727/727 | 39.2 | 45 | 15.8 | Yes | 58.2 | 36.0 | 5.8 | No | Adjusted for age, gender, ethnicity, pack years of cigarette smoking, lifetime recreational physical activity, lifetime aspirin use, BMI 5 years ago, years of schooling, and intakes of nonstarch polysaccharides from vegetables and calcium from foods and supplements |
|
| |||||||||||||||||
| Matsuo et al. [16] |
Japan | 2002 | Case control | Hospital patients | 1999 | CRC colon rectal |
Both | 142/241 72/241 70/241 |
33.6 | 51.5 | 14.9 | Yes | 65.1 | 31.1 | 3.7 | Yes | Adjusted for age |
|
| |||||||||||||||||
| Shannon et al. [36] |
Australia | 2002 | Case control | Healthy persons | 1985–1998 | CRC | Both | 501/ 1,207 |
44.2 | 46.4 | 9.4 | Yes | Calculated OR, no adjustments | ||||
|
| |||||||||||||||||
| Plaschke et al. [37] |
Germany | 2003 | Case control | Healthy persons | Not reported | CRC | Both | 287/346 | 43.1 | 45.9 | 11 | Yes | 44.5 | 43.6 | 11.8 | Yes | Adjusted for gender |
|
| |||||||||||||||||
| Pufulete et al. [38] |
United Kingdom | 2003 | Case control | Hospital patients | 2000-2001 | CRC | Both | 304/352 | 54 | 38 | 8 | Yes | 61.8 | 34.2 | 3.9 | Yes | Adjusted for age, gender, BMI, smoking, and ROH intake. |
|
| |||||||||||||||||
| Toffoli et al. [39] |
Italy | 2003 | Case control | Healthy persons | 1999-2000 | Colon | Both | 276/279 | 29.7 | 50.2 | 20.1 | Yes | 47.7 | 43.4 | 9 | Yes | Calculated OR, no adjustments |
|
| |||||||||||||||||
| Jiang et al. [40] | China | 2004 | Case control | Healthy person | 1990–2002 | CRC | Both | 126/343 | 39.1 | 42.4 | 18.5 | No | 67.6 | 30.7 | 1.8 | Yes | Adjusted for age and sex |
|
| |||||||||||||||||
| Miao et al. [41] | China | 2005 | Case control | Healthy persons | 1999–2002 | CRC | Both | 198/420 | 31.7 | 47.9 | 20.5 | Yes | 67.1 | 31.4 | 1.4 | No | None reported |
|
| |||||||||||||||||
| Ulvik et al. [20] | Norway | 2004 | Nested case control | Healthy persons | 1992-1991 | CRC | Both | 2,168/ 2,168 |
49.9 | 40.4 | 9.7 | Yes | Adjusted for age and gender | ||||
|
| |||||||||||||||||
| Yin et al. [21] | Japan | 2004 | Case control | Hospital patients | 2000–2003 | CRC | Both | 685/778 | 35.7 | 47.2 | 17.1 | Yes | 66.2 | 31.4 | 2.4 | Yes | Adjusted for gender. 5-year age class, area and alcohol use |
|
| |||||||||||||||||
| Jiang et al. [42] |
China | 2005 | Nested case control | Healthy persons | 1989-1990 | Colon rectal |
Both | 52/338 72/338 |
39.5 | 42.2 | 18.3 | No | 67.5 | 30.7 | 1.8 | No | Adjusted for gender, age, folate, methionine, total energy intake, smoking status, and drinking status |
|
| |||||||||||||||||
| Landi et al. [43] | Spain | 2005 | Case control | Hospital patients | 1996–1998 | CRC | Both | 359/320 | 35.3 | 45 | 19.7 | Yes | 53.3 | 39.8 | 6.9 | Yes | Adjusted for age and sex |
|
| |||||||||||||||||
| Matsuo et al. [44] |
Japan | 2005 | Matched case control | Hospital patients | 2001–2004 | CRC | Both | 257/771 | 37.5 | 45.1 | 17.3 | Yes | 62.5 | 33.5 | 4.0 | Yes | Adjusted for age, sex, referral patterns, smoking BMI, physical, exercise and family history of CRC |
|
| |||||||||||||||||
| Otani et al. [45] | Japan | 2005 | Matched case control | Hospital patients | 1998–2002 | CRC | Both | 107/224 | 23 | 51.4 | 25.6 | Yes | 69.6 | 28.1 | 2.2 | Yes | Matching factors and adjusted for smoking, alcohol consumption, BMI, and total dietary fiber intake |
|
| |||||||||||||||||
| Le Marchand et al. [46] |
USA (Hawaii and California) |
2005 | Nested case control | Healthy persons | 1993–1996 | CRC colon rectal |
Both | 822/ 2,021 |
48.9 | 38.5 | 12.6 | No | Adjusted for age, gender, and ethnicity | ||||
|
| |||||||||||||||||
| Battistelli et al. [47] | Italy | 2006 | Case control | Healthy controls | Not reported | CRC | Both | 93/100 | 30 | 51 | 29 | Yes | Calculated OR, no adjustments | ||||
|
| |||||||||||||||||
| Van Guelpen et al. [24] |
Sweden | 2006 | Nested case control | Healthy persons | 1985–2002 | CRC | Both | 226/437 | 52.8 | 38.7 | 8.5 | Yes | 45.9 | 42.0 | 12.1 | Yes | Adjusted for BMI, smoking, recreational and occupational physical activity, and alcohol intake |
|
| |||||||||||||||||
| Wang et al. [48] | India | 2006 | Case control | Healthy persons | 1999–2001 | CRC colon rectal |
Both | 435/340 | 87.6 | 12.4 | 0 | Yes | 36.1 | 46.4 | 17.5 | Yes | Adjusted for gender, age household income, education, religion, mother tongue, smoking, drinking, chewing, and vegetarianism |
|
| |||||||||||||||||
| Lima et al. [49] |
Brazil | 2007 | Case control | Healthy persons | 1999–2001 | CRC | Both | 102/300 | 47.7 | 42.3 | 10 | Yes | 63.7 | 31.0 | 5.3 | Yes | Adjusted for age, gender, and race |
|
| |||||||||||||||||
| Chang et al. [50] |
Taiwan | 2007 | Matched case control | Hospital patients | 2000-2001 | CRC | Both | 195/195 | 47.2 | 44.6 | 8.2 | Yes | 61.5 | 33.3 | 5.1 | Yes | Matched on age and gender. |
|
| |||||||||||||||||
| Curtin et al. [51] |
USA | 2007 | Matched case control | Healthy persons | 1991–1994 | Colon | Both | 916/ 1,972 |
45.0 | 43.5 | 11.5 | Yes | 47.1 | 41.9 | 11 | Yes | Calculated OR, no adjustments |
|
| |||||||||||||||||
| Hubner et al. [52] | United Kingdom | 2007 | Case control | Healthy controls | Not reported | CRC | Both | 1,685/ 2,695 |
43.6 | 44.3 | 12.1 | Yes | Adjusted for age, sex, family history, cancer location, stage, and grade | ||||
|
| |||||||||||||||||
| Jin et al. [53] | China | 2007 | Case control | Healthy controls | 2002–2005 | CRC | Both | 449/672 | 31.4 | 48.4 | 20.2 | Yes | Adjusted for age, sex, drinking, BMI, smoking, and family history | ||||
|
| |||||||||||||||||
| Murtaugh et al. [54] |
USA | 2007 | Matched case control | Healthy persons | 1997–2001 | Rectal-Men Rectal-Women |
Both Men Women |
751/979 | 48.2 47.5 |
40.1 41.4 |
11.7 11.1 |
No | 44.9 | 43.7 | 11.3 | Yes | Adjusted for age, BMI, activity, energy, fiber, calcium, ibuprofen use, smoking, and other MTHFR genotype |
|
| |||||||||||||||||
| Osian et al. [55] | Romania | 2007 | Matched case control | Hospital patients | 2003–2005 | CRC | Both | 69/67 | 70.2 | 25.4 | 4.5 | Yes | 61.1 | 37.3 | 1.5 | Yes | Matched on age and sex |
|
| |||||||||||||||||
| Zeybek et al. [17] |
Turkey | 2007 | Case control | Hospital patients | 2003–2005 | CRC | Both | 52/144 | 44.4 | 45.1 | 10.4 | Yes | Calculated OR, no adjustments | ||||
|
| |||||||||||||||||
| Cao et al. [56] | China | 2008 | Matched case control | Healthy persons | 2000–2002 | CRC | Both | 315/371 | 32.7 | 49.5 | 17.8 | Yes | 64.4 | 32.1 | 3.5 | Yes | Matched on ethnicity, sex, and age |
|
| |||||||||||||||||
| Küry et al. [57] | France | 2008 | Matched case control | Healthy persons | 2002–2006 | CRC | Both | 1,023/1,121 | 40.8 | 45.9 | 13.3 | Yes | 51.5 | 39.5 | 9 | Yes | Matched on age and sex |
|
| |||||||||||||||||
| Lightfoot et al. [58] |
United Kingdom | 2008 | Matched case control | Hospital patients | 1997–2000 | CRC | Both | 468/734 | 45.8 | 46 | 8.3 | Yes | 48.6 | 43.7 | 7.8 | Yes | Adjusted for gender and age |
|
| |||||||||||||||||
| Mokarram et al. [59] |
Iran | 2008 | Case control | Not reported | 2003–2005 | Colon | Both | 151/81 | 49.4 | 38.3 | 12.3 | Yes | Calculated OR, no adjustments | ||||
|
| |||||||||||||||||
| Sharp et al. [60] |
United Kingdom (Scotland) |
2008 | Matched case control | Healthy persons | 1998–2000 | CRC | Both | 264/408 | 43.2 | 44.9 | 11.9 | Yes | 44.9 | 39.8 | 15.2 | No | Adjusted for age, gender, family history of CRC, physical activity, NAAID use, total energy intake, and type of dietary supplements |
|
| |||||||||||||||||
| Theodoratou et al. [61] |
Scotland | 2008 | Case control | Healthy persons | 1999–2006 | CRC | Both | 2,028/ 2,722 |
45.3 | 45.0 | 11.5 | Yes | 45.8 | 44.1 | 10.1 | Yes | Adjusted for age, sex, deprivation score, and family history risk |
|
| |||||||||||||||||
| Zhang et al. [62] |
China | 2008 | Matched case control | Hospital patients | 2003–2005 | CRC | Both | 300/300 | 30.4 | 46.5 | 23.1 | Yes | 65.3 | 29.7 | 5 | Yes | Adjusted for age, sex, education, family history, smoking, and drinking. |
|
| |||||||||||||||||
| El Awady et al. [63] |
Egypt | 2009 | Case control | Healthy persons | 2004–2007 | CRC | Both | 35/68 | 65 | 29 | 6 | Yes | 38 | 54 | 8 | Yes | None reported |
|
| |||||||||||||||||
| Gallegos-Arreola et al. [30] |
Mexico | 2009 | Case control | Healthy persons | 2006–2008 | CRC | Both | 369/170 | 33.6 | 34.1 | 32.2 | No | Calculated OR, no adjustments | ||||
|
| |||||||||||||||||
| Haghighi et al. [22] |
Iran | 2009 | Case control | Hospital patients | 2004–2007 | CRC | Both | 234/257 | 36.6 | 31.1 | 32.3 | Yes | None reported | ||||
|
| |||||||||||||||||
| Iacopetta et al. [18] |
Australia | 2009 | Matched case control | Healthy persons | 2005–2007 | Proximal distal CRC | Both | 850/958 | 45 | 45 | 10 | Yes | Matched on gender, age, socioeconomic status, country of birth, educational level, and smoking status | ||||
|
| |||||||||||||||||
| Chandy et al. [14] |
India | 2010 | Matched case control | Healthy persons | 2006–2008 | CRC | Both | 100/86 | 76.7 | 22.1 | 1.2 | Yes | 25.6 | 58.1 | 16.3 | Yes | Matched on age and gender |
|
| |||||||||||||||||
| Cui et al. [28] | South Korea | 2010 | Case control | Hospital patients | 2004–2008 | CRC | Both | 1,829/ 1,700 |
31.8 | 50.7 | 17.5 | Yes | Adjusted for age and sex | ||||
|
| |||||||||||||||||
| Eussen et al. [64] | EPIC | 2010 | Nested case control | Healthy persons | 1992–1998 | CRC | Both | 1,367/ 2,325 |
43.1 | 45.5 | 11.5 | Yes | 46.5 | 42.6 | 11.0 | Yes | Calculated OR, no adjustments |
|
| |||||||||||||||||
| Fernández-Peralta et al. [65] | Spain | 2010 | Matched case control | Healthy persons | 1992–1996 | CRC | Both | 143/103 | 42.7 | 48.6 | 8.7 | Yes | 55.3 | 42.7 | 1.9 | No | Matched on age and sex |
|
| |||||||||||||||||
| Karpinski et al. [66] |
Poland | 2010 | Case control | Healthy persons | Not reported | CRC | Both | 186/140 | 51 | 39 | 10 | Yes | Adjusted for age and sex | ||||
|
| |||||||||||||||||
| Komlósi et al. [67] | Hungary | 2010 | Case control | Healthy persons | 2001–2007 | Colon rectal |
Both Both |
476/461 479/478 |
47 47 |
40 41 |
13 12 |
Yes Yes |
Adjusted for sex, age, and BMI Adjusted for sex, age, and BMI |
||||
|
| |||||||||||||||||
| Naghib alhossaini et al. [68] |
Iran | 2010 | Case control | Not reported | Not reported | CRC | Both | 151/230 | 42.4 | 53 | 4.6 | Yes | 42.5 | 45.7 | 11.8 | Yes | Adjusted for age, sex, and smoking status |
|
| |||||||||||||||||
| Promthet et al. [69] |
Thailand | 2010 | Matched case control | Healthy persons | 2002–2006 | Colon | Both | 130/130 | 72.3 | 23.8 | 3.9 | Yes | 41.5 | 54.6 | 3.9 | No | Matched on age and sex |
|
| |||||||||||||||||
| Wettergren et al. [70] |
Sweden | 2010 | Case control | Healthy persons | 1994–2004 | CRC | Both | 181/300 | 55.9 | 35.8 | 8.4 | Yes | Calculated OR, no adjustments | ||||
|
| |||||||||||||||||
| Abuli et al. [71] | Spain | 2011 | Matched case control | Healthy person | 2000-2001 | CRC | Both | 515/515 | 38.1 | 48 | 13.9 | Yes | Matched on age and sex | ||||
|
| |||||||||||||||||
| Guimarães et al. [72] | Brazil | 2011 | Case control | Healthy persons | 1992–2003 | CRC | Both | 113/188 | 48.9 | 42.0 | 9 | Yes | 67.6 | 26.1 | 6.4 | No | Adjusted for age, sex, and ethnic origin |
|
| |||||||||||||||||
| Jokić et al. [73] | Croatia | 2011 | Case control | Healthy persons | Not reported | Colon | Both | 300/300 | 47.3 | 43.3 | 9.3 | Yes | 46.7 | 42.7 | 10.6 | Yes | |
|
| |||||||||||||||||
| Pardini et al. [25] |
Czech Republic | 2011 | Case control | Hospital patients | 2004–2006 | CRC | Both | 666/ 1,377 |
44.5 | 45.6 | 9.9 | Yes | 42.3 | 46.3 | 11.3 | Yes | Adjusted for age and gender |
|
| |||||||||||||||||
| Kim et al. [26] | South Korea | 2011 | Case control | Hospital patients | Not reported | CRC | Both | 67/53 | 28.3 | 39.6 | 32.1 | Yes | 67.9 | 30.2 | 1.9 | Yes | None reported |
|
| |||||||||||||||||
| Sameer et al. [74] |
Kashmiri (India) |
2011 | Matched case control | Healthy persons | 2008-2009 | CRC | Both | 86/160 | 75.6 | 16.9 | 7.5 | No | None reported | ||||
|
| |||||||||||||||||
| Prasad and Wilkhoo [75] | India | 2011 | Case control | Healthy person | Not reported | CRC | Both | 110/241 | 94.6 | 5.0 | 0.4 | Yes | None reported | ||||
|
| |||||||||||||||||
| Zhu et al. [29] | China | 2011 | Case control | Healthy persons | 2006–2008 | CRC | Both | 86/100 | 49.0 | 41.0 | 10 | Yes | None reported | ||||
|
| |||||||||||||||||
| Kim et al. [27] | South Korea | 2012 | Case control | Hospital patients | 1998–2004 | CRC | Both | 787/656 | 31.3 | 44.1 | 24.7 | No | Adjusted for age, sex, family history, multivitamin use, BMI, smoking status, and total energy | ||||
|
| |||||||||||||||||
| Lee et al. [76] | USA | 2012 | Nested case control | Healthy persons | Health professionals follow-up study | CRC | Men | 173/345 | 44 | 39.9 | 16 | Yes | 47.7 | 42.6 | 10.3 | Yes | RR's reported, so OR's are calculated, no adjustments |
|
| |||||||||||||||||
| Lee et al. [76] | USA | 2012 | Nested Case Control | Healthy persons | Physicians' health study | CRC | Men | 240/408 | 47.7 | 37.2 | 15 | Yes | 45.8 | 42.2 | 12.1 | Yes | RR's reported, so OR's are calculate, no adjustments |
|
| |||||||||||||||||
| Lee et al. [76] | USA | 2012 | Nested Case Control | Healthy persons | Nurse Health Study | CRC | Women | 189/377 | 46.7 | 39.7 | 13.6 | Yes | 51 | 38.3 | 10.7 | Yes | RR's reported, so OR's are calculated no adjustments |
AA: African American, BMI: body mass index, Cauc: Caucasian CRC: colorectal cancer, HWE: Hardy Weinberg equilibrium, NSAID: nonsteroidal anti-inflammatory drug, OCP: oral contraceptive pill.
(b) Summary of cohorts studies.
| Incidence rate ratio (RR) of CRC (95% CI) | ||||||||||||||
|---|---|---|---|---|---|---|---|---|---|---|---|---|---|---|
| Study | Country | Year | Study design | Source of control | Recruitment period | Cancer | Sex | Case/control | Follow-up period | CT versus CC | TT versus CC | AC versus AA | CC versus AA | |
| De Vogel et al. [77] | Netherlands | 2009 | Cohort | Healthy persons | Recruited in 1986 | CRC | Both | 689/1,793 | 7.3 years | 1.23 (1.02–1.50) | 0.80 (0.56–1.15) |
0.89 (0.72–1.09) |
1.05 (0.79–1.38) |
Adjusted for age and sex |
|
| ||||||||||||||
| Heijmans et al. [78] | Netherlands | 2003 | Cohort | Elderly healthy men | Recruited in 1985 | CRC | Both | 18/793 | 10 years | 1.16 (0.41–3.30) | 3.65 (1.97–12.5) |
Adjusted for age | ||
The Downs and Black scoring instrument was used to determine the quality of the studies included in this paper. The Down and Black scoring tool provides a means to assess the quality of a study based on 5 subscales (1) reporting of the study results, (2) external validity for the purposes of assessing generalizability of the findings, (3) bias in measurement and outcomes, (4) bias in the selection of study subjects, and (5) the power of the study [79]. The score was independently calculated for each study by two team members. Disagreements were resolved by consensus. The last question on the Downs and Black tool relates to the power of the study. If a priori power calculation was reported in the paper, this question was scored with a one, otherwise, zero was scored.
2.4. Statistical Analysis
The meta-analysis for the genotype risk comparisons was performed using the inverse variance method under a random effects model, odds ratios (ORs) along with 95% confidence intervals (CIs) were used for the case control studies according to the DerSimonian and Laird method [80]. All identified studies with available data were included in the summary effect estimate for each genotype combination. For the meta-analysis of the risk of CRC associated with genotype, the wild type (677CC or 1298AA) was used as the reference group, and comparisons were made to either the heterozygous (677CT or 1298AC) or homozygous variant type (677TT or 1298CC). If studies grouped genotypes together for comparison purposes, or did not report ORs and 95% confidence intervals and the raw numbers were available in the paper, unadjusted ORs and associated 95% confidence intervals were calculated according to the method described by Silman and MacFarlane [81]. These are identified in Table 1 as “OR calculated, no adjustments” in the column titled Adjustments. The meta-analyses were performed using Review Manager 5.1 Software [82].
The meta-analyses for the comparison of high versus low folate intake and the associated risk of CRC were performed using the inverse variance method under a random effects model, odds ratios (ORs) along with 95% confidence intervals (CIs) were calculated according to the DerSimonian and Laird method [80]. All identified studies with available data were included in the summary effect estimate for each high versus low folate intake within a genotype. For those studies that compared folate intake by “quantile” and assessed the risk of CRC by genotype, many used the 677CC or 677CC/CT lowest folate intake quantile as the reference group to determine the OR for all genotypes and folate intake levels. For the purposes of this analysis, however, the desire was to compare the risk of CRC between the highest folate intake to lowest folate intake within a genotype. The method described by Hamling et al. and the associated MS Excel spreadsheet, which recalculates the adjusted odds ratios permitting alternative comparisons, were used to derive the ORs of highest compared to the lowest folate intake within the genotype [83, 84]. This analysis was performed using Microsoft Excel (Microsoft Corporation (2007), Redmond, WA, USA). An analysis of folate intake and CRC risk for the MTHFR A1298C gene was not possible due to an insufficient number of studies reporting on this data. In performing this analysis, the result from the highest “quantile” identified in the study was used to compare the lowest “quantile” in the study. Dietary folate intake for the lowest “quantile” ranged from a low of less than 115.6 to 406 mcg/day; the range for the highest was from 320 to 485 mcg/day or more. Although these ranges do overlap, they represent the highest and the lowest folate intake for the study population upon which the specific study odds ratios were derived. The meta-analyses were performed using Review Manager 5.1 Software [82].
Publication bias was assessed via the Begg and Mazumdar's rank correlation test, Egger's linear regression, and the Trim and Fill methods [85–87]. The assessment of publication bias was performed using the Comprehensive Meta-analysis (CMA) software (Biostat, Version 2.2, Englewood, NJ, USA) [88]. Summary effect estimates from CMA were compared with the RevMan results to ensure that they were both in agreement prior to executing the tests for publication bias.
Assessment of heterogeneity was performed using both Cochran's χ2 and I2. The Cochran's χ2 test assesses whether the differences in results are due to chance only [89]. Heterogeneity exists when the P value is low, that is, P < 0.10 [89]. The I2 statistic is the percentage of variability in the effect estimates that is due to heterogeneity rather than chance. An I2 statistic value over 50% indicates that substantial heterogeneity may be present [89]. The analysis was performed using Review Manager 5.1 software [82].
Kruskal-Wallis was performed on the quality of the studies to determine whether there were differences in the quality of the studies based on the directionality of the outcome. For the purposes of this analysis, directionality was assessed as positive (statistical significant OR > 1), neutral (nonsignificant OR), or negative (statistical significant OR ≤ 1). IBM's SPSS for Windows version 17 was used for the analysis (IBM SPSS, Version 17, Chicago, IL, USA).
The Forest plots of the MTHFR C677T and A1298C (Figures 2through 5) were sorted according to the percentage of the comparator genotype (either 677CT, 677TT, 1298AC, or 1298CC) in the control group, from highest to lowest, while the remaining Forest plots (Figure 6) were organized by increasing year of publication.
Figure 2.

Forest plot of the risk of colorectal cancer for MTHFR 677CT versus CC.
Figure 5.

Forest plot of the risk of colorectal cancer for MTHFR 1298CC versus AA.
Figure 6.
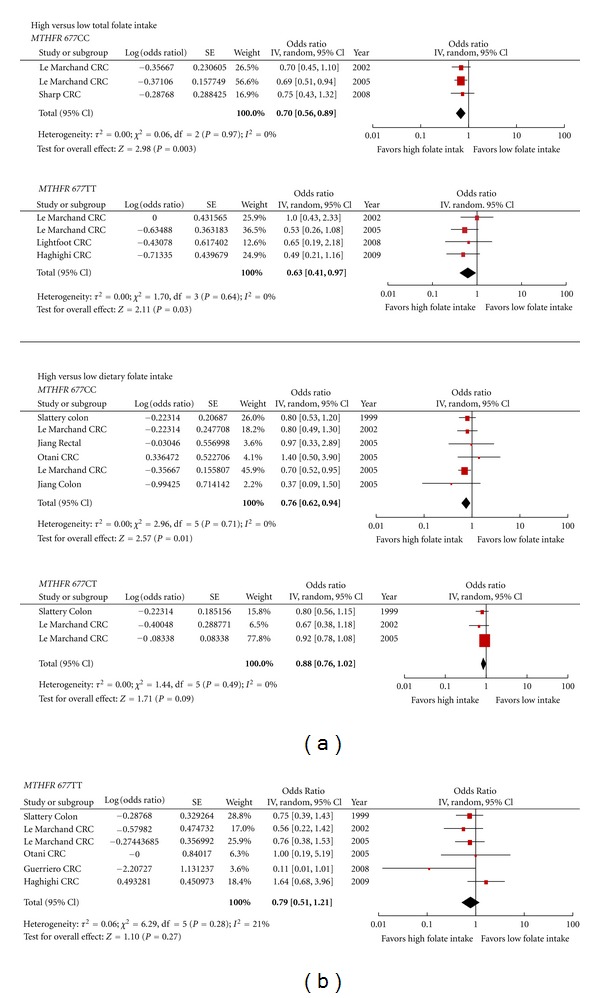
Forest plot of the risk of colorectal cancer comparing high versus low folate intake within each MTHFR C677T polymorphism.
3. Results
The pooled search resulted in 910 records. Of these 67 met our inclusion criteria, 10 studies were found on hand searching (Figure 1). Four identified studies were not included in the paper. In two studies, newborns comprised either all or part of the control group, which suggested that these studies were related to the determination of the prevalence of genotypes rather than risk of CRC since few newborns have had the opportunity to develop colorectal cancer [8, 92]. The remaining two studies did not report the separate case control numbers for each genotype; therefore, ORs could not be calculated for all genotypes; however the folate intake results, reported on in one of these studies, are included in the high versus low folate intake analysis [31, 93]. The majority of the studies included in the systematic review and meta-analysis were case control or nested case control studies, two cohort studies were identified (Table 1). The meta-analysis results presented here update two previously published meta-analyses on MTHFR polymorphisms and the risk of colorectal cancer, that of Taioli et al. 2009 meta-analysis on the MTHFR C677T polymorphisms and Kono and Chen's 2005 meta-analysis on the MTHFR A1298C polymorphisms [94, 95]. All case control studies, with available data, were included in the meta-analysis, regardless of the quality score.
Figure 1.
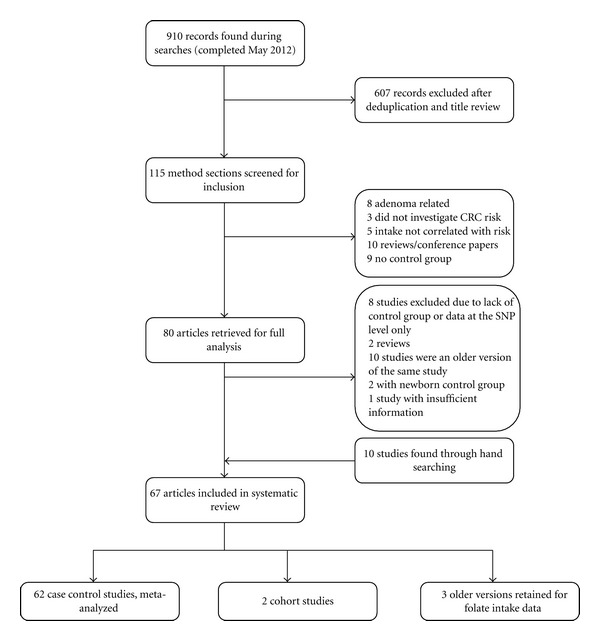
Search strategy flow chart.
Study results were reported from twenty-five countries: Asia (China, India, Japan, South Korea, Taiwan, and Thailand), Australia, Europe (EPIC Cohort (10 European Centers), Czech Republic, Croatia, France, Germany, Hungary, Italy, Norway, Poland, Romania, Spain, Sweden, and United Kingdom), Latin America (Mexico), Middle East (Egypt, Iran, and Turkey), South America (Brazil), and USA. Six papers were written in another language with an English abstract: five in Chinese: the other in Spanish [31, 40, 41, 53, 62, 93]. When duplicate studies were found, for example, Nurses' Health study and Health Professionals study, only the most recently published results were used in this analysis. There were five studies whose recruitment period was during the early days of folate fortification in USA; otherwise none of the studies were conducted in an environment of food fortification [35, 54, 76]. A blood sample was the most often used medium to assess genotype. There were two studies that used buccal samples as the tissue source for genotyping [18, 60].
3.1. Colorectal Cancer Risk and MTHFR C677T Genotype
For the comparison of 677CT versus 677CC, the summary risk estimate of the adjusted ORs was 1.02 (95% CI 0.95–1.10), χ² = 210.34, df = 63, P < 0.00001, I² = 70% with significant heterogeneity (Figure 2). For the comparison of 677TT versus 677CC genotype, the summary risk estimate was 0.88 (95% CI 0.80–0.96) χ² = 132.66, df = 61, P = 0.00001, I² = 54% with significant heterogeneity (Figure 3). Two studies, Wang et al and Promthet et al., did not have any case participants with a TT genotype [48, 69].
Figure 3.

Forest plot of the risk of colorectal cancer for MTHFR 677TT versus CC.
3.1.1. Subgroup Analysis
Subgroup analysis was performed on sex. The pooled summary risk estimate of the studies reporting on sex for 677CT versus 677CC was 1.04 (95% CI 0.94–1.16), χ² = 14.28, df = 10, P = 0.16, I² = 30% and 677TT versus 677CC was 0.87 (95% CI 0.75–1.01), χ² = 14.01, df = 10, P = 0.17, I² = 29% with heterogeneity (Table 2). The summary risk estimates for CRC risk between 677CT versus 677CC for men only were 1.12 (95% CI 0.94–1.34), χ² = 18.68, df = 8, P = 0.02, I2 = 57% with significant heterogeneity (Table 2) and for women only 0.98 (95% CI 0.85–1.12), χ² = 7.63, df = 7, P = 0.37, I2 = 8% (Table 2). The summary risk estimates for 677TT versus 677CC for men were 0.87 (95% CI 0.74–1.02), χ² = 8.36, df = 8, P = 0.40, I2 = 4% (Table 2) and for women only were 0.92 (95% CI 0.65–1.31), χ² = 20.74, df = 7, P = 0.004, I2 = 66% with significant heterogeneity (Table 2).
Table 2.
Subgroup analysis for the MTHFR C677T polymorphism.
| Number of studies | Number of participants in case/control | Summary effect estimate | 95% CI | Tests for heterogeneity | |||
|---|---|---|---|---|---|---|---|
| CC genotype | Comparator genotype | ||||||
| Subgroup by sex | |||||||
|
| |||||||
| Pooled studies for sex | I 2 (%) | ||||||
| CT versus CC | 11 | 1,650/1,833 | 1,420/1,523 | 1.04 | 0.94–1.16 | χ² = 14.28, df = 10 (P = 0.16) | 30 |
| TT versus CC | 11 | 1,650/1,833 | 326/425 | 0.87 | 0.75–1.01 | χ² = 14.01, df = 10 (P = 0.17) | 29 |
| Men | |||||||
| CT versus CC | 9 | 1,257/1,436§ | 1,081/1,199§ | 1.12 | 0.94–1.34 | χ² = 18.68, df = 8 (P = 0.02) | 57 |
| TT versus CC | 9 | 1,257/1,436§ | 271/346§ | 0.87 | 0.74–1.02 | χ² = 8.36, df = 8 (P = 0.40) | 4 |
| Women | |||||||
| CT versus CC | 8 | 755/897§ | 627/773§ | 0.98 | 0.85–1.12 | χ² = 7.63, df = 7 (P = 0.37) | 8 |
| TT versus CC | 8 | 755/897§ | 162/217§ | 0.92 | 0.65–1.31 | χ² = 20.74, df = 7 (P = 0.004) | 66 |
|
| |||||||
| Subgroup by cancer type | |||||||
|
| |||||||
| Pooled studies | |||||||
| CT versus CC | 27 | 3,735/6,767 | 3,403/6,307 | 1.01 | 0.95–1.08 | χ² = 23.65, df = 26 (P = 0.60) | 0 |
| TT versus CC | 24* | 3,735/6,767 | 886/2,117 | 0.80 | 0.71–0.89 | χ² = 31.45, df = 23 (P = 0.11) | 27 |
| Colon cancer studies | |||||||
| CT versus CC | 16 | 2,096/4,463 | 1,933/4,090 | 1.01 | 0.93–1.10 | χ² = 11.23, df = 15 (P = 0.74) | 0 |
| TT versus CC | 14** | 2,096/4,463 | 452/1,352 | 0.76 | 0.64–0.91 | χ² = 22.79, df = 13 (P = 0.04) | 43 |
| Rectal cancer studies | |||||||
| CT versus CC | 11 | 1,639/3,291 | 1,470/2,996 | 1.10 | 0.92–1.31 | χ² = 27.95, df = 10 (P = 0.002) | 64 |
| TT versus CC | 10 | 1,639/3,291 | 386/1,020 | 0.82 | 0.72–0.94 | χ² = 8.38, df = 9 (P = 0.50) | 0 |
|
| |||||||
| Subgroup by location | |||||||
|
| |||||||
| Asian countries | |||||||
| CT versus CC | 22 | 2,640/3,401 | 2,985/3,903 | 0.98 | 0.89–1.06 | χ² = 23.98, df = 21 (P = 0.29) | 12 |
| TT versus CC | 20** | 2,640/3,401 | 1,001/1,565 | 0.83 | 0.69–1.01 | χ² = 49.66, df = 19 (P = 0.0001) | 62 |
| European countries | |||||||
| CT versus CC | 22 | 5,480/6,960 | 5,374/6,857 | 1.00 | 0.87–1.13 | χ² = 109.92, df = 21 (P < 0.00001) | 81 |
| TT versus CC | 22 | 5,480/6,960 | 1,294/1,793 | 0.92 | 0.80–1.06 | χ² = 43.74, df = 21 (P = 0.003) | 52 |
| USA | |||||||
| CT versus CC | 8 | 2,011/3,355 | 1,932/2,997 | 0.98 | 0.90–1.07 | χ² = 6.07, df = 7 (P = 0.53) | 0 |
| TT versus CC | 8 | 2,011/3,355 | 436/1,055 | 0.73 | 0.63–0.84 | χ² = 1.91, df = 7 (P = 0.96) | 0 |
| Middle Eastern countries | |||||||
| CT versus CC | 5 | 277/374 | 274/302 | 1.46 | 0.62–3.46 | χ² = 45.30, df = 4 (P < 0.00001) | 91 |
| TT versus CC | 5 | 277/374 | 72/105 | 0.69 | 0.42–1.13 | χ² = 5.56, df = 4 (P = 0.23) | 28 |
|
| |||||||
| Subgroup by control | |||||||
|
| |||||||
| Healthy person controls | |||||||
| CT versus CC | 45 | 8,706/12,958 | 8,043/12,044 | 1.02 | 0.94–1.11 | χ² = 154.26, df = 44 (P < 0.00001) | 71 |
| TT versus CC | 43** | 8,706/12,958 | 2,136/3,636 | 0.90 | 0.81–1.00 | χ² = 88.37, df = 42 (P = 0.0001) | 52 |
| Hospital patient controls | |||||||
| CT versus CC | 16 | 2,418/2,863 | 2,932/3,619 | 0.93 | 0.83–1.05 | χ² = 27.35, df = 15 (P = 0.03) | 45 |
| TT versus CC | 16 | 2,418/2,863 | 939/1,254 | 0.82 | 0.68–1.00 | χ² = 36.07, df = 15 (P = 0.002) | 58 |
§Not all studies reported both case and control numbers.
*There were two studies without TT genotype information, one study with rectal cancer data, and two studies with colon cancer data.
**There were two studies that had 0 people for the TT genotype.
CRC: colorectal cancer.
Separate estimates for colon cancer and rectal cancer were also evaluated. For the summary risk estimates related to colon or rectal cancer, only those studies that reported separate results for either colon or rectal cancer were included. The pooled summary risk estimate of the studies reporting on either colon or rectal cancer only for 677CT versus 677CC was 1.01 (95% CI 0.95–1.08) χ² = 23.65, df = 26, P = 0.60, I² = 0% and 677TT versus 677CC was 0.80 (95% CI 0.71–0.89) χ² = 31.45, df = 23, P = 0.11, I² = 27% with some heterogeneity evident (Table 2). The summary risk estimates for 677CT versus 677CC colon cancer only were 1.01 (95% CI 0.93–1.10), χ² = 11.23, df = 15, P = 0.74, I2 = 0% (Table 2) and 677TT versus 677CC colon cancer only 0.76 (95% CI 0.64–0.91 χ² = 22.79, df = 13, P = 0.03, I2 = 43% (Table 2). The summary risk estimates for 677CT versus 677CC rectal cancer only were 1.10 (95% CI 0.92–1.31), χ² = 27.95, df = 10, P = 0.002, I2 = 64% (Table 2) and 677TT versus 677CC rectal cancer only 0.82 (95% CI 0.72–0.94), χ² = 8.38, df = 9, P = 0.50, I2 = 0% (Table 2).
3.1.2. Sensitivity Analysis
In an attempt to identify the studies contributing to the heterogeneity in the genotype summary risk effect results, sensitivity analysis was performed according the sequential algorithm proposed by Patsopoulos and colleagues [96]. This method involves sequentially dropping one study from the meta-analysis to determine the impact on the I2 statistic with the objective of identifying the study or studies that will reduce the I2 below a set threshold. Using this method, we were not successful in reducing the heterogeneity below the threshold value of an I2 value of less than 25%, which would have suggested that there was minimal heterogeneity in the results.
Given that the typical diets of Asian cultures can be substantially different from that of Europe and North America, separate analyses were conducted including just the studies in the Asian locations (China, India, Japan, South Korea, and Taiwan), separate from the European locations (Czech Republic, Croatia, European EPIC study, France, Germany, Hungary, Italy, Norway, Poland, Romania, Spain, Sweden, and United Kingdom), USA, and Middle East (Egypt, Iran, and Turkey) (Table 2). The protective effect of the 677TT genotype was sustained in each geography; however, only in the USA was the risk reduction significant with no heterogeneity.
A further analysis was performed by comparing the results based on the source of controls: either hospital patients or healthy persons. The heterogeneity was sustained (Table 2).
3.1.3. Publication Bias
Publication bias was assessed using three different tests: Begg and Mazumdar's rank correlation test, Egger's linear regression, and the Trim and Fill methods. For the MTHFR 677CT genotype there may be some evidence for publication bias. The Begg and Mazumdar test returned a P value = 0.03, Egger's a P value = 0.005, and Trim and Fill found that an additional 12 studies would be necessary to form a symmetrical funnel plot. Whereas, for the MTHFR 677TT genotype, the Begg and Mazumdar test returned a P value = 0.33, Egger's a P value = 0.38, and Trim and Fill found that additional 4 studies would be necessary to form a symmetrical funnel plot, suggesting that publication bias may not be significant concern.
3.1.4. Correlation between Study Quality versus Results
There was no statistically significant difference found in the quality of the studies based on outcome (positive versus neutral versus negative) (P = 0.310).
3.2. Colorectal Cancer Risk and MTHFR A1298C Genotype
For the comparison of 1298AC versus 1298AA, the summary risk estimate was 1.03 (95% CI 0.96–1.10), χ² = 54.54, df = 39, P = 0.05, I² = 28% with some heterogeneity (Figure 4). For the comparison of 1298CC versus 1298AA genotype, the summary risk estimate was 0.93 (95% CI 0.82–1.06), χ² = 62.14, df = 38, P = 0.008, I² = 39% with heterogeneity (Figure 5).
Figure 4.

Forest plot of the risk of colorectal cancer for MTHFR 1298AC versus AA.
3.2.1. Sensitivity Analysis
In an attempt to identify the studies contributing to the heterogeneity in the genotype summary risk effect results for 1298CC, the previously described process for sensitivity analysis was performed. The resulting summary effects estimate for 1298CC versus 1298AA was 1.04 (95% CI 0.94–1.14) χ2 = 32.17, df = 32, P = 0.46, I² = 1% with no significant heterogeneity (data not shown). In this analysis, the studies contributing to the heterogeneity were conducted in Germany, India, and the USA [35, 37, 48, 54, 76].
3.2.2. Subgroup Analysis
There were an insufficient number of studies that reported CRC risk by sex; however, subgroups, by geography, and source of controls were performed.
Subgroup analysis by geography was performed for the MTHFR A1298C polymorphism according to the country groups previously described. There were an insufficient number of studies from the Middle East to include this location in the analysis. The subgroup analysis revealed that for European countries there was an associated, significant increased risk of CRC for those with the 1298CC genotype, while Asian and USA studies suggest a significant associated decrease in risk (Table 3). This variability in the associated risk of the 1298CC genotype by geography was also noted by Kono and Chen in their meta-analysis [95].
Table 3.
Subgroup analysis for the MTHFR A1298C polymorphism.
| Number of studies | Number of participants in case/control | Summary effect estimate | 95% CI | Tests for heterogeneity | |||
|---|---|---|---|---|---|---|---|
| AA genotype | Comparator genotype | ||||||
| Subgroup by location | |||||||
|
| |||||||
| Asian countries | I (%) | ||||||
| AC versus AA | 15 | 1,727/3,047 | 991/1,615 | 0.99 | 0.84–1.16 | χ² = 26.56, df = 14 (P = 0.02) | 47 |
| CC versus AA | 14* | 1,727/3,047 | 116/178 | 0.72 | 0.55–0.93 | χ² = 14.37, df = 13 (P = 0.35) | 10 |
| European countries | |||||||
| AC versus AA | 14 | 2,971/4,119 | 2,404/3,746 | 1.05 | 0.97–1.14 | χ² = 14.78, df = 13 (P = 0.32) | 12 |
| CC versus AA | 14 | 2,971/4,119 | 683/908 | 1.14 | 1.01–1.28 | χ² = 13.13, df = 13 (P = 0.44) | 1 |
| USA | |||||||
| AC versus AA | 7 | 1,678/2,694 | 1,365/2,244 | 0.99 | 0.88–1.11 | χ² = 7.96, df = 6 (P = 0.24) | 25 |
| CC versus AA | 7 | 1,678/2,694 | 247/559 | 0.73 | 0.57–0.92 | χ² = 10.20, df = 6 (P = 0.12) | 41 |
|
| |||||||
| Subgroup by control | |||||||
|
| |||||||
| Hospital controls | |||||||
| AC versus AA | 12 | 1,872/2,795 | 1,258/1,874 | 1.05 | 0.95–1.16 | χ² = 4.42, df = 11 (P = 0.96) | 0 |
| CC versus AA | 12 | 1,872/2,795 | 232/311 | 1.12 | 0.88–1.42 | χ²= 13.22, df = 11 (P = 0.28) | 17 |
| Healthy controls | |||||||
| AC versus AA | 27 | 5,083/7,939 | 3,926/6,325 | 1.02 | 0.93–1.11 | χ²= 48.87, df = 26 (P = 0.004) | 47 |
| CC versus AA | 26* | 5,083/7,939 | 912/1,439 | 0.88 | 0.76–1.03 | χ²= 45.33, df = 25 (P = 0.008) | 45 |
*There was one study that had no results for this genotype.
A further analysis was performed by comparing the results based on the source of controls; either hospital patients or healthy persons. For the CC variant, the healthy controls had a nonsignificant reduced risk associated with CRC versus hospital control, within some increase in heterogeneity (Table 3).
3.2.3. Publication Bias
The results of the statistical test for publication bias for the MTHFR A1298C polymorphisms suggest that publication bias may not be a concern. For MTHFR 1298AC, the Begg and Mazumdar test returned a P value = 0.24, Egger's a P value = 0.398, and Trim and Fill found that an additional 5 studies would be necessary to form a symmetrical funnel plot whereas, for the 1298CC genotype, the Begg and Mazumdar test returned a P value = 0.88, Egger's a P value = 0.74, and Trim and Fill found that no additional studies would be necessary to form a symmetrical funnel plot.
3.3. Colorectal Cancer Risk and Combinations of the MTHFR C677T and A1298C Genotypes
The combinations of variants of the MTHFR C677T and A1298C genotypes are in linkage disequilibrium such that rarely are there individuals with the 677TT/1298AC and 677TT/1298CC combinations [95]. The results of the summary risk estimates for the remaining combinations are presented in Table 4. The combination of 677TT/1298AA was associated with lowest risk of CRC with a summary risk estimate of 0.77 (95% CI 0.58–1.03), χ2 = 19.00, df = 11, P = 0.06, I² = 42% with significant heterogeneity.
Table 4.
Summary effect estimate results for the MTHFR C677T and A1298C polymorphism combinations.
| Comparator genotype | Number of studies | Number of participants in case/control | Summary effect estimate | 95% CI | Tests for heterogeneity | ||
|---|---|---|---|---|---|---|---|
| CC/AA genotype | Comparator genotype§ | ||||||
| I (%) | |||||||
| CC/AC | 12 | 609/775 | 677/870 | 0.96 | 0.82–1.11 | χ² = 7.56, df = 11 (P = 0.75) | 0 |
| CC/CC | 12 | 609/775 | 180/312 | 0.90 | 0.64–1.27 | χ² = 21.33, df = 11 (P = 0.03) | 48 |
| CT/AA | 12 | 609/775 | 753/912 | 0.99 | 0.86–1.15 | χ² = 9.63, df = 11 (P = 0.56) | 0 |
| CT/AC | 12 | 609/775 | 491/678 | 1.06 | 0.79–1.44 | χ² = 30.68, df = 11 (P = 0.001) | 64 |
| CT/CC | 5 | 609/775 | 18/36 | 1.40 | 0.33–6.03 | χ² = 7.78, df = 4 (P = 0.10) | 49 |
| TT/AA | 12 | 609/775 | 311/465 | 0.77 | 0.58–1.03 | χ² = 19.00, df = 11 (P = 0.06) | 42 |
| TT/AC | 4 | 609/775 | 11/17 | N/a | |||
| TT/CC | 3 | 609/775 | 0/6 | N/a | |||
§There was one study that did not report case control numbers for the combinations.
3.4. Colorectal Cancer Risk, Comparison of High versus Low Folate Intake by Genotype
Of the articles that met our inclusion criteria, there were 10 studies that reported on CRC risk by “quantile” of folate intake for the MTHFR C677T polymorphism; however, an insufficient number of studies reported on the folate intake for the A1298C polymorphism to complete the analysis for this polymorphism. A food frequency questionnaire (FFQ) was the usual method used to collect dietary intake information. Dietary information was captured for one to two years preceding diagnosis, or for the control group, at the time of enrolment in the study. The range of dietary folate intake, defined as folate from food sources, for the lowest “quantile” ranged from a low of less than 115.6 to 406 mcg/day; the range for the highest was from 320 to 485 mcg/day or more (Table 5). The summary risk estimate for high versus low dietary folate intake for the 677CC genotype was 0.76 (95% CI 0.62–0.94), χ² = 2.96, df = 5, P = 0.71, I² = 0%, for the 677CT genotype 0.88 (95% CI 0.76–1.02), χ² = 1.44, df = 2, P = 0.49, I² = 0% and the 677TT genotype 0.78 (95% CI 0.53–1.13), χ² = 6.41, df = 6, P = 0.38, I² = 6% (Figure 6).
Table 5.
Case Control Studies: comparison of high versus low folate intake.
| Study | Country | Year | Study design | Population of controls | Recruitment period | Cancer | Gender | Number of quantiles | Dietary folate (mcg/day) | Total folate (mcg/day) | Adjustments |
|---|---|---|---|---|---|---|---|---|---|---|---|
| Chen et al. [90] | USA | 1996 | Nested case control | Healthy persons | 1986–1994 | CRC | Men | 3 | <317 versus >461 | Adjusted for age, family history, and intake of folate, methionine, and alcohol | |
|
| |||||||||||
| Slattery et al. [91] | USA | 1999 | Matched case control | Healthy persons | 1991–1994 | Colon | Both | 3 | <126 versus >197 per 1000 kcals |
Adjusted for age, BMI, physical activity, energy intake, dietary fiber, and smoking | |
|
| |||||||||||
| Le Marchand et al. [23] | USA | 2002 | Matched case control | Healthy persons | 1994–1998 | CRC | Both | 3 | <278 versus >372 | <336 versus >1583 | Adjusted for age, gender, ethnicity, pack years of cigarette smoking, lifetime recreational physical activity, lifetime aspirin use, BMI 5 years ago, years of schooling, and intakes of nonstarch polysaccharides from vegetables and calcium from foods and supplements |
|
| |||||||||||
| Jiang et al. [42] | China | 2005 | Nested case control | Healthy persons | 1989-1990 | Colon rectal |
Both | 4 | <115.6 versus >172 per 1000 kcals |
Adjusted for sex, age, methionine, smoking status drinking status, and zinc | |
|
| |||||||||||
| Le Marchand et al. [46] | USA (Hawaii and California) | 2005 | Nested case control | Healthy persons | 1993–1996 | CRC | Both | 3 | <253 versus >412 | <322 versus >590 | Adjusted for age, gender, and ethnicity |
|
| |||||||||||
| Otani et al. [45] | Japan | 2005 | Matched case control | Hospital patients | 1998–2002 | CRC | Both | 3 | <343 versus >485 | Matching factors and adjusted for smoking, alcohol consumption, BMI, and total dietary fiber intake | |
|
| |||||||||||
| Lightfoot et al. [58] | United Kingdom | 2008 | Matched case control | Hospital patients | 1997–2000 | CRC | Both | 3 | <267 versus >397 | Adjusted for gender, and age | |
|
| |||||||||||
| Sharp et al. [60] | United Kingdom | 2008 | Matched case control | Healthy persons | 1998–2000 | CRC | Both | 4 | <263.9 versus >348.6 | Adjusted for age, gender and total energy intake. | |
|
| |||||||||||
| Guerreiro et al. [31] | Portugal | 2008 | Case control | Healthy persons | Not reported | CRC | Both | 2 | ≤406.7> | Adjusted for age, gender and CRC history | |
|
| |||||||||||
| Haghighi et al. [22] | Iran | 2009 | Case control | Hospital patients | 2004–2007 | CRC | Both | 2 | ≤320> | ≤450> | Not reported |
BMI: body mass index, CRC: colorectal cancer.
Total folate intake information was also reported in some studies. Total folate was defined as folate from dietary and supplemental sources. The lowest “quantile” ranged from less than 264 to 450 mcg/day and the higher “quantile” ranged from 348 to 1583 mcg/day or more (Table 5). The summary risk estimate for high versus low total folate intake for the 677CC genotype was 0.70 (95% CI 0.56–0.89), χ² = 0.06, df = 2, P = 0.97, I² = 0% and the 677TT genotype 0.63 (95% CI 0.41–0.97), χ² = 1.70, df = 3, P = 0.64, I² = 0% (Figure 6). Only two studies had information available for the 677CT genotype; therefore, the summary risk estimate was not determined.
4. Discussion
The results of the analysis suggest that the homozygous variant genotype MTHFR 677TT confers a degree of protection against the development of CRC, affording an associated risk reduction of 12%. In contrast, the heterozygous genotype, MTHFR 677CT, was found to have the same risk as the genotype, MTHFR 677CC. These results are consistent with the previous meta-analysis completed in 2009 [94]. The thermolabile nature of MTHFR 677TT enzyme results in the reduced conversion of 5,10-methylene-tetrahydrofolate to 5-methyl-tetrahydrofolate, which acts as cofactor in the conversion of homocysteine to methionine, permitting a larger pool of 5,10-methylene-tetrahydrofolate for thymidylate biosynthesis. This protective effect would suggest that preferential availability of folates to contribute pyrimidine synthesis, and therefore a reduction in uracil misincorporation and subsequent DNA breaks, could be important in the pathogenesis of CRC [32].
This reduced risk of CRC for the 677TT genotype was not supported by all of the included studies. In several individual studies, the 677TT genotype was associated with an increased risk of CRC [29–31]. The authors of these studies theorized that conditions of low folate intake, which is characteristic of the diet in these countries (Brazil, Mexico), may explain the increased risk found between the 677TT genotype and CRC. This would appear to be substantiated by the reduced risk apparent in the summary risk estimated for 677CC and 677TT genotypes when comparing high versus low total folate intake (Figure 6) and would suggest that folate intake can alter the risk of CRC. Evidence for the alteration of disease through adequate folic acid intake has been found in other situations. For example, a maternal MTHFR 677TT genotype is associated with a higher risk of having an offspring with a neural tube defect [97]. Increased folic acid supplementation, periconceptionally and during the first trimester, has been found to reduce this risk [98].
Many of the studies incorporated both men and women into the case control groups. However, far fewer studies stratified their results based on sex. Of the eleven studies included in this subgroup analysis, representing over 7,000 case/control study participants, only one reported significant OR based on sex and genotype, which was contrary to the summary results in this meta-analysis (Table 2). Lightfoot et al. found that the men with the 677CT genotype had a reduced risk of CRC, and women with the 677TT genotype had an increased risk [58]. In the subgroup analysis on sex, the risk reduction of the 677TT genotype and significant summary risk estimate for both sexes was no longer evident. This may represent lack of statistical power; it is possible that more studies are necessary to determine whether there may be a gender bias favoring one sex over another regarding the protective nature of the 677TT genotype.
The A1298C polymorphisms would not appear to be associated with any substantial reduction in the associated risk of CRC. However, subgroup analysis did reveal some variability in the associated risk for the 1298CC genotype, with lower risks associated with Asian and USA studies. What might be contributing to these geographical differences is unclear. Perhaps, as with the subgroup analysis by sex, additional studies with larger numbers of participants with this genotype are necessary to more clearly understand the relationship.
Many of the studies included in the high versus low folate intake meta-analysis compared the risk of CRC using the 677CC or 677CC/CT genotype and low folate intake as the reference group for the calculation of the odds ratio in other genotypes and folate intake “quantiles.” Generally, the findings of these studies were that high folate intake and the 677TT genotype were associated with a nonsignificant reduction in CRC risk versus low folate intake. This is the first study to perform a meta-analysis of the risk of CRC comparing high versus low folate intake within a genotype. The meta-analysis findings for the homozygous genotypes (677CC and 677TT) indicate that there is greater risk reduction with higher levels of folate intake. The upper range of high folate intake reported in the studies was, generally, over the Institute of Medicine's (IOM) recommended daily intake (RDI) of 400 mcg/day and in one case over 1 mg/day [23, 99]. There were no clear boundaries in the definition of low folate intake versus high folate intake in this analysis as there was overlap in the ranges in daily folate amounts that defined the lowest folate intake versus the highest intake. This does prevent generalizing an amount of folate intake for each genotype that may be related to reducing colorectal cancer risk, which is a limitation of this analysis. Further, there is insufficient data to verify the shape (linear versus nonlinear) of the dose effect curve. More studies at this level of detail are necessary to provide further insight into the shape of the dose effect curve for folate and its associated impact on the risk of colorectal cancer.
The available studies used food frequency questionnaires (FFQs) or an adapted Coronary Artery Risk Development in Young Adults (CARDIAs) dietary history questionnaire to capture the food eaten on a regular basis; however, it is possible that not all of the folate food sources were captured thereby underestimating intake. Furthermore, tools such as the FFQ in case control studies are subject to recall bias since dietary intake was surveyed after a diagnosis of CRC. These two factors could lead to some under- or overreporting of folate intake resulting in misclassification of participants into their respective “quantiles.” While mandatory folate fortification was implemented in the USA in 1998, none of the studies included in the meta-analysis on folate intake were conducted during times of folate fortification. Interestingly, a recent large observational study conducted in USA, after the mandated folate fortification period, found that higher folate intake levels were associated with a protective effect against CRC [100].
The studies included in the meta-analysis were conducted in twenty-five different countries. This is potentially both a strength and weakness of our analysis. Different countries represent different sources of folate and different food choice combinations, thus broadening the generalizability of our results. The potential weakness rests with the increased heterogeneity of some of the results. In the 2009 meta-analysis conducted by Taioli et al, their results indicate that in Asia the 677TT genotype was afforded a significant risk reduction [94]. In our analysis, the 677TT genotype is no longer significantly protective.
In conclusion, the results of this meta-analysis suggest that the MTHFR 677TT genotype is associated with a reduced risk of CRC. In addition, under conditions of high total folate intake, the associated risk of CRC is also reduced for both the MTHFR 677 CC and TT genotypes.
Conflict of Interests
D. A. Kennedy is supported by a career development grant from Sickkids Foundation. G. Koren holds the Research Leadership for Better Pharmacotherapy during Pregnancy and Breastfeeding (Sickkids Hospital) and the Ivey Chair in Molecular Toxicology (University of Western Ontario). The Motherisk Program is conducting research supported by Duchesnay Inc. manufacturer of prenatal vitamins. These vitamins were not utilized in any of the studies included in this meta-analysis. The remaining authors have no financial interests to declare.
Acknowledgments
The authors would like to thank Yen Ming and Yuqi (Alice) Liang for their assistance in translating the articles in Chinese. They would like to thank Jan Hamling for her guidance with the MS Excel spreadsheet application used to recalculate the adjusted odd ratios to perform the high versus low folate intake analysis within the genotype.
References
- 1.Jemal A, Bray F, Center MM, Ferlay J, Ward E, Forman D. Global cancer statistics. CA Cancer Journal for Clinicians. 2011;61(2):69–90. doi: 10.3322/caac.20107. [DOI] [PubMed] [Google Scholar]
- 2.Center MM, Jemal A, Smith RA, Ward E. Worldwide variations in colorectal cancer. CA Cancer Journal for Clinicians. 2009;59(6):366–378. doi: 10.3322/caac.20038. [DOI] [PubMed] [Google Scholar]
- 3.Migliore L, Migheli F, Spisni R, Copped F. Genetics, cytogenetics, and epigenetics of colorectal cancer. Journal of Biomedicine and Biotechnology. 2011;2011:19 pages. doi: 10.1155/2011/792362.792362 [DOI] [PMC free article] [PubMed] [Google Scholar]
- 4.Kim YI. Role of folate in colon cancer development and progression. Journal of Nutrition. 2003;133(11, supplement 1):3731S–3739S. doi: 10.1093/jn/133.11.3731S. [DOI] [PubMed] [Google Scholar]
- 5.Ames BN. DNA damage from micronutrient deficiencies is likely to be a major cause of cancer. Mutation Research—Fundamental and Molecular Mechanisms of Mutagenesis. 2001;475(1-2):7–20. doi: 10.1016/s0027-5107(01)00070-7. [DOI] [PubMed] [Google Scholar]
- 6.Duthie SJ. Folic acid deficiency and cancer: mechanisms of DNA instability. British Medical Bulletin. 1999;55(3):578–592. doi: 10.1258/0007142991902646. [DOI] [PubMed] [Google Scholar]
- 7.Fenech M. The role of folic acid and Vitamin B12 in genomic stability of human cells. Mutation Research—Fundamental and Molecular Mechanisms of Mutagenesis. 2001;475(1-2):57–67. doi: 10.1016/s0027-5107(01)00079-3. [DOI] [PubMed] [Google Scholar]
- 8.Ryan BM, Weir DG. Relevance of folate metabolism in the pathogenesis of colorectal cancer. Journal of Laboratory and Clinical Medicine. 2001;138(3):164–176. doi: 10.1067/mlc.2001.117161. [DOI] [PubMed] [Google Scholar]
- 9.Mukherjee M, Joshi S, Bagadi S, Dalvi M, Rao A, Shetty KR. A low prevalence of the C677T mutation in the methylenetetrahydrofolate reductase gene in Asian Indians. Clinical Genetics. 2002;61(2):155–159. doi: 10.1034/j.1399-0004.2002.610212.x. [DOI] [PubMed] [Google Scholar]
- 10.Ulrich CM, Robien K, Sparks R. Pharmacogenetics and folate metabolism—a promising direction. Pharmacogenomics. 2002;3(3):299–313. doi: 10.1517/14622416.3.3.299. [DOI] [PubMed] [Google Scholar]
- 11.Robien K, Boynton A, Ulrich CM. Pharmacogenetics of folate-related drug targets in cancer treatment. Pharmacogenomics. 2005;6(7):673–689. doi: 10.2217/14622416.6.7.673. [DOI] [PubMed] [Google Scholar]
- 12.Guéant-Rodriguez RM, Guéant JL, Debard R, et al. Prevalence of methylenetetrahydrofolate reductase 677T and 1298C alleles and folate status: a comparative study in Mexican, West African, and European populations. American Journal of Clinical Nutrition. 2006;83(3):701–707. doi: 10.1093/ajcn.83.3.701. [DOI] [PubMed] [Google Scholar]
- 13.Wilcken B, Bamforth F, Li Z, et al. Geographical and ethnic variation of the 677C > T allele of 5, 10 methylenetetrahydrofolate reductase (MTHFR): findings from over 7000 newborns from 16 areas world wide. Journal of Medical Genetics. 2003;40(8):619–625. doi: 10.1136/jmg.40.8.619. [DOI] [PMC free article] [PubMed] [Google Scholar]
- 14.Chandy S, Adiga MNS, Ramachandra N, et al. Association of methylenetetrahydrofolate reductase gene polymorphisms & colorectal cancer in India. Indian Journal of Medical Research. 2010;131(5):659–664. [PubMed] [Google Scholar]
- 15.Delgado-Enciso I, Martínez-Garza SG, Rojas-Martínez A, et al. 677T mutation of the MTHFR gene in adenomas and colorectal cancer in a population sample from the Northeastern Mexico. Preliminary results. Revista de Gastroenterologia de Mexico. 2001;66(1):32–37. [PubMed] [Google Scholar]
- 16.Matsuo K, Hamajima N, Hirai T, et al. Methionine synthase reductase gene A66G polymorphism is associated with risk of colorectal cancer. Asian Pacific Journal of Cancer Prevention. 2002;3(4):353–359. [PubMed] [Google Scholar]
- 17.Zeybek U, Yaylim I, Yilmaz H, et al. Methylenetetrahydrofolate reductase C677T polymorphism in patients with gastric and colorectal cancer. Cell Biochemistry and Function. 2007;25(4):419–422. doi: 10.1002/cbf.1317. [DOI] [PubMed] [Google Scholar]
- 18.Iacopetta B, Heyworth J, Girschik J, Grieu F, Clayforth C, Fritschi L. The MTHFR C677T and ΔDNMT3B C-149T polymorphisms confer different risks for right- and left-sided colorectal cancer. International Journal of Cancer. 2009;125(1):84–90. doi: 10.1002/ijc.24324. [DOI] [PubMed] [Google Scholar]
- 19.Botto LD, Yang Q. 5,10-Methylenetetrahydrofolate reductase gene variants and congenital anomalies: a HuGE review. American Journal of Epidemiology. 2000;151(9):862–877. doi: 10.1093/oxfordjournals.aje.a010290. [DOI] [PubMed] [Google Scholar]
- 20.Ulvik A, Vollset SE, Hansen S, Gislefoss R, Jellum E, Ueland PM. Colorectal cancer and the methylenetetrahydrofolate reductase 677C→T and methionine synthase 2756A→G polymorphisms: a study of 2,168 case-control pairs from the JANUS cohort. Cancer Epidemiology Biomarkers and Prevention. 2004;13(12):2175–2180. [PubMed] [Google Scholar]
- 21.Yin G, Kono S, Toyomura K, et al. Methylenetetrahydrofolate reductase C677T and A1298C polymorphisms and colorectal cancer: the Fukuoka Colorectal Cancer study. Cancer Science. 2004;95(11):908–913. doi: 10.1111/j.1349-7006.2004.tb02201.x. [DOI] [PMC free article] [PubMed] [Google Scholar]
- 22.Haghighi MM, Radpour R, Mahmoudi T, Mohebbi SR, Vahedi M, Zali MR. Association between MTHFR polymorphism (C677T) with nonfamilial colorectal cancer. Oncology Research. 2009;18(2-3):57–63. doi: 10.3727/096504009789954636. [DOI] [PubMed] [Google Scholar]
- 23.Le Marchand L, Donlon T, Hankin JH, Kolonel LN, Wilkens LR, Seifried A. B-vitamin intake, metabolic genes, and colorectal cancer risk (United States) Cancer Causes and Control. 2002;13(3):239–248. doi: 10.1023/a:1015057614870. [DOI] [PubMed] [Google Scholar]
- 24.van Guelpen B, Dahlin AM, Hultdin J, et al. One-carbon metabolism and CpG island methylator phenotype status in incident colorectal cancer: a nested case-referent study. Cancer Causes and Control. 2010;21(4):557–566. doi: 10.1007/s10552-009-9484-y. [DOI] [PubMed] [Google Scholar]
- 25.Pardini B, Kumar R, Naccarati A, et al. MTHFR and MTRR genotype and haplotype analysis and colorectal cancer susceptibility in a case-control study from the Czech Republic. Mutation Research—Genetic Toxicology and Environmental Mutagenesis. 2011;721(1):74–80. doi: 10.1016/j.mrgentox.2010.12.008. [DOI] [PubMed] [Google Scholar]
- 26.Kim JW, Park HM, Choi YK, Chong SY, Oh D, Kim NK. Polymorphisms in genes involved in folate metabolism and plasma DNA methylation in colorectal cancer patients. Oncology Reports. 2011;25(1):167–172. [PubMed] [Google Scholar]
- 27.Kim J, Cho YA, Kim DH, et al. Dietary intake of folate and alcohol, MTHFR C677T polymorphism, and colorectal cancer risk in Korea. American Journal of Clinical Nutrition. 2012;95(2):405–412. doi: 10.3945/ajcn.111.020255. [DOI] [PubMed] [Google Scholar]
- 28.Cui LH, Shin MH, Kweon SS, et al. Methylenetetrahydrofolate reductase C677T polymorphism in patients with gastric and colorectal cancer in a Korean population. BMC Cancer. 2010;10, article 236 doi: 10.1186/1471-2407-10-236. [DOI] [PMC free article] [PubMed] [Google Scholar]
- 29.Zhu Q, Jin Z, Yuan Y, Lu Q, Ge D, Zong M. Impact of MTHFR gene C677T polymorphism on Bcl-2 gene methylation and protein expression in colorectal cancer. Scandinavian Journal of Gastroenterology. 2011;46(4):436–445. doi: 10.3109/00365521.2010.537682. [DOI] [PubMed] [Google Scholar]
- 30.Gallegos-Arreola MP, García-Ortiz JE, Figuera LE, Puebla-Pérez AM, Morgan-Villela G, Zúñiga-González GM. Association of the 677C→T polymorphism in the MTHFR gene with colorectal cancer in Mexican patients. Cancer Genomics and Proteomics. 2009;6(3):183–188. [PubMed] [Google Scholar]
- 31.Guerreiro CS, Carmona B, Gonçalves S, et al. Risk of colorectal cancer associated with the C677T polymorphism in 5,10-methylenetetrahydrofolate reductase in Portuguese patients depends on the intake of methyl-donor nutrients. American Journal of Clinical Nutrition. 2008;88(5):1413–1418. doi: 10.3945/ajcn.2008.25877. [DOI] [PubMed] [Google Scholar]
- 32.Bailey LB. Folate in Health and Disease. 2nd edition. Boca Raton, Fla, USA: Taylor & Francis; 2010. [Google Scholar]
- 33.Sharp L, Little J. Polymorphisms in genes involved in folate metabolism and colorectal neoplasia: a HuGE review. American Journal of Epidemiology. 2004;159(5):423–443. doi: 10.1093/aje/kwh066. [DOI] [PubMed] [Google Scholar]
- 34.Park KS, Mok JW, Kim JC. The 677C > T mutation in 5,10-methylenetetrahydrofolate reductase and colorectal cancer risk. Genetic Testing. 1999;3(2):233–236. doi: 10.1089/gte.1999.3.233. [DOI] [PubMed] [Google Scholar]
- 35.Keku T, Millikan R, Worley K, et al. 5,10-Methylenetetrahydrofolate reductase codon 677 and 1298 polymorphisms and colon cancer in African Americans and whites. Cancer Epidemiology Biomarkers and Prevention. 2002;11(12):1611–1621. [PubMed] [Google Scholar]
- 36.Shannon B, Gnanasampanthan S, Beilby J, Iacopetta B. A polymorphism in the methylenetetrahydrofolate reductase gene predisposes to colorectal cancers with microsatellite instability. Gut. 2002;50(4):520–524. doi: 10.1136/gut.50.4.520. [DOI] [PMC free article] [PubMed] [Google Scholar]
- 37.Plaschke J, Schwanebeck U, Pistorius S, Saeger HD, Schackert HK. Methylenetetrahydrofolate reductase polymorphisms and risk of sporadic and hereditary colorectal cancer with or without microsatellite instability. Cancer Letters. 2003;191(2):179–185. doi: 10.1016/s0304-3835(02)00633-x. [DOI] [PubMed] [Google Scholar]
- 38.Pufulete M, Al-Ghnaniem R, Leather AJM, et al. Folate status, genomic DNA hypomethylation, and risk of colorectal adenoma and cancer: a case control study. Gastroenterology. 2003;124(5):1240–1248. doi: 10.1016/s0016-5085(03)00279-8. [DOI] [PubMed] [Google Scholar]
- 39.Toffoli G, Gafà R, Russo A, et al. Methylenetetrahydrofolate reductase 677 C→T polymorphism and risk of proximal colon cancer in North Italy. Clinical Cancer Research. 2003;9(2):743–748. [PubMed] [Google Scholar]
- 40.Jiang QT, Chen K, Ma XY, et al. A case-control study on the polymorphisms of methylenetetrahydrofolate reductases, drinking interaction and susceptibility in colorectal cancer. Chinese Journal of Epidemiology. 2004;25(7):612–616. [PubMed] [Google Scholar]
- 41.Miao XP, Yang S, Tan W, et al. Association between genetic variations in methylenetetrahydrofolate reductase and risk of colorectal cancer in a Chinese population. Chinese Journal of Preventive Medicine. 2005;39(6):409–411. [PubMed] [Google Scholar]
- 42.Jiang Q, Chen K, Ma X, et al. Diets, polymorphisms of methylenetetrahydrofolate reductase, and the susceptibility of colon cancer and rectal cancer. Cancer Detection and Prevention. 2005;29(2):146–154. doi: 10.1016/j.cdp.2004.11.004. [DOI] [PubMed] [Google Scholar]
- 43.Landi S, Gemignani F, Moreno V, et al. A comprehensive analysis of phase I and phase II metabolism gene polymorphisms and risk of colorectal cancer. Pharmacogenetics and Genomics. 2005;15(8):535–546. doi: 10.1097/01.fpc.0000165904.48994.3d. [DOI] [PubMed] [Google Scholar]
- 44.Matsuo K, Ito H, Wakai K, et al. One-carbon metabolism related gene polymorphisms interact with alcohol drinking to influence the risk of colorectal cancer in Japan. Carcinogenesis. 2005;26(12):2164–2171. doi: 10.1093/carcin/bgi196. [DOI] [PubMed] [Google Scholar]
- 45.Otani T, Iwasaki M, Hanaoka T, et al. Folate, vitamin B6, vitamin B12, and vitamin B 2 intake, genetic polymorphisms of related enzymes, and risk of colorectal cancer in a hospital-based case-control study in Japan. Nutrition and Cancer. 2005;53(1):42–50. doi: 10.1207/s15327914nc5301_5. [DOI] [PubMed] [Google Scholar]
- 46.Le Marchand L, Wilkens LR, Kolonel LN, Henderson BE. The MTHFR C677T polymorphism and colorectal cancer: the multiethnic cohort study. Cancer Epidemiology Biomarkers and Prevention. 2005;14(5):1198–1203. doi: 10.1158/1055-9965.EPI-04-0840. [DOI] [PubMed] [Google Scholar]
- 47.Battistelli S, Vittoria A, Stefanoni M, Bing C, Roviello F. Total plasma homocysteine and methylenetetrahydrofolate reductase C677T polymorphism in patients with colorectal carcinoma. World Journal of Gastroenterology. 2006;12(38):6128–6132. doi: 10.3748/wjg.v12.i38.6128. [DOI] [PMC free article] [PubMed] [Google Scholar]
- 48.Wang J, Gajalakshmi V, Jiang J, et al. Associations between 5,10-methylenetetrahydrofolate reductase codon 677 and 1298 genetic polymorphisms and environmental factors with reference to susceptibility to colorectal cancer: a case-control study in an Indian population. International Journal of Cancer. 2006;118(4):991–997. doi: 10.1002/ijc.21438. [DOI] [PubMed] [Google Scholar]
- 49.Lima CSP, Nascimento H, Bonadia LC, et al. Polymorphisms in methylenetetrahydrofolate reductase gene (MTHFR) and the age of onset of sporadic colorectal adenocarcinoma. International Journal of Colorectal Disease. 2007;22(7):757–763. doi: 10.1007/s00384-006-0237-z. [DOI] [PubMed] [Google Scholar]
- 50.Chang SC, Lin PC, Lin JK, Yang SH, Wang HS, Fen-Yau Li A. Role of MTHFR polymorphisms and folate levels in different phenotypes of sporadic colorectal cancers. International Journal of Colorectal Disease. 2007;22(5):483–489. doi: 10.1007/s00384-006-0190-x. [DOI] [PubMed] [Google Scholar]
- 51.Curtin K, Slattery ML, Ulrich CM, et al. Genetic polymorphisms in one-carbon metabolism: associations with CpG island methylator phenotype (CIMP) in colon cancer and the modifying effects of diet. Carcinogenesis. 2007;28(8):1672–1679. doi: 10.1093/carcin/bgm089. [DOI] [PMC free article] [PubMed] [Google Scholar]
- 52.Hubner RA, Lubbe S, Chandler I, Houlston RS. MTHFR C677T has differential influence on risk of MSI and MSS colorectal cancer. Human Molecular Genetics. 2007;16(9):1072–1077. doi: 10.1093/hmg/ddm055. [DOI] [PubMed] [Google Scholar]
- 53.Jin XX, Zhu ZZ, Wang AZ, Jia HR. Association of methylenetetrahydrofolate reductase C677T polymorphism with genetic susceptibility to colorectal cancer. World Chinese Journal of Digestology. 2007;15(25):2754–2757. [Google Scholar]
- 54.Murtaugh MA, Curtin K, Sweeney C, et al. Dietary intake of folate and co-factors in folate metabolism, MTHFR polymorphisms, and reduced rectal cancer. Cancer Causes and Control. 2007;18(2):153–163. doi: 10.1007/s10552-006-0099-2. [DOI] [PMC free article] [PubMed] [Google Scholar]
- 55.Osian G, Procopciuc L, Vlad L. MTHFR polymorphisms as prognostic factors in sporadic colorectal cancer. Journal of Gastrointestinal and Liver Diseases. 2007;16(3):251–256. [PubMed] [Google Scholar]
- 56.Cao HX, Gao CM, Takezaki T, et al. Genetic polymorphisms of methylenetetrahydrofolate reductase and susceptibility to colorectal cancer. Asian Pacific Journal of Cancer Prevention. 2008;9(2):203–208. [PubMed] [Google Scholar]
- 57.Küry S, Buecher B, Robiou-du-Pont S, et al. Low-penetrance alleles predisposing to sporadic colorectal cancers: a French case-controlled genetic association study. BMC Cancer. 2008;8, article 326 doi: 10.1186/1471-2407-8-326. [DOI] [PMC free article] [PubMed] [Google Scholar]
- 58.Lightfoot TJ, Barrett JH, Bishop T, et al. Methylene tetrahydrofolate reductase genotype modifies the chemopreventive effect of folate in colorectal adenoma, but not colorectal cancer. Cancer Epidemiology Biomarkers and Prevention. 2008;17(9):2421–2430. doi: 10.1158/1055-9965.EPI-08-0058. [DOI] [PubMed] [Google Scholar]
- 59.Mokarram P, Naghibalhossaini F, Saberi Firoozi M, et al. Methylenetetrahydrofolate reductase C677T genotype affects promoter methylation of tumor-specific genes in sporadic colorectal cancer through an interaction with folate/vitamin B12 status. World Journal of Gastroenterology. 2008;14(23):3662–3671. doi: 10.3748/wjg.14.3662. [DOI] [PMC free article] [PubMed] [Google Scholar]
- 60.Sharp L, Little J, Brockton NT, et al. Polymorphisms in the methylenetetrahydrofolate reductase (MTHFR) gene, intakes of folate and related B vitamins and colorectal cancer: a case-control study in a population with relatively low folate intake. British Journal of Nutrition. 2008;99(2):379–389. doi: 10.1017/S0007114507801073. [DOI] [PubMed] [Google Scholar]
- 61.Theodoratou E, Farrington SM, Tenesa A, et al. Dietary vitamin B6 intake and the risk of colorectal cancer. Cancer Epidemiology Biomarkers and Prevention. 2008;17(1):171–182. doi: 10.1158/1055-9965.EPI-07-0621. [DOI] [PubMed] [Google Scholar]
- 62.Zhang YL, Yuan XY, Zhang Z, et al. Relationship of genetic polymorphisms in methylenetetrahydrofolate reductase and alcohol drinking with the risk of colorectal cancer. Chinese Journal of Cancer Prevention and Treatment. 2008;15(17):1298–1301. [Google Scholar]
- 63.El Awady MK, Karim AM, Hanna LS, et al. Methylenetetrahydrofolate reductase gene polymorphisms and the risk of colorectal carcinoma in a sample of Egyptian individuals. Cancer Biomarkers. 2009;5(6):233–240. doi: 10.3233/CBM-2009-0108. [DOI] [PMC free article] [PubMed] [Google Scholar]
- 64.Eussen SJPM, Vollset SE, Igland J, et al. Plasma folate, related genetic variants, and colorectal cancer risk in EPIC. Cancer Epidemiology Biomarkers and Prevention. 2010;19(5):1328–1340. doi: 10.1158/1055-9965.EPI-09-0841. [DOI] [PMC free article] [PubMed] [Google Scholar]
- 65.Fernández-Peralta AM, Daimiel L, Nejda N, Iglesias D, Medina Arana V, González-Aguilera JJ. Association of polymorphisms MTHFR C677T and A1298C with risk of colorectal cancer, genetic and epigenetic characteristic of tumors, and response to chemotherapy. International Journal of Colorectal Disease. 2010;25(2):141–151. doi: 10.1007/s00384-009-0779-y. [DOI] [PubMed] [Google Scholar]
- 66.Karpinski P, Myszka A, Ramsey D, et al. Polymorphisms in methyl-group metabolism genes and risk of sporadic colorectal cancer with relation to the CpG island methylator phenotype. Cancer Epidemiology. 2010;34(3):338–344. doi: 10.1016/j.canep.2010.03.002. [DOI] [PubMed] [Google Scholar]
- 67.Komlósi V, Hitre E, Pap É, et al. SHMT1 1420 and MTHFR 677 variants are associated with rectal but not colon cancer. BMC Cancer. 2010;10, article 525 doi: 10.1186/1471-2407-10-525. [DOI] [PMC free article] [PubMed] [Google Scholar]
- 68.Naghibalhossaini F, Mokarram P, Khalili I, et al. MTHFR C677T and A1298C variant genotypes and the risk of microsatellite instability among Iranian colorectal cancer patients. Cancer Genetics and Cytogenetics. 2010;197(2):142–151. doi: 10.1016/j.cancergencyto.2009.11.014. [DOI] [PMC free article] [PubMed] [Google Scholar]
- 69.Promthet SS, Pientong C, Ekalaksananan T, et al. Risk factors for colon cancer in northeastern thailand: interaction of MTHFR codon 677 and 1298 genotypes with environmental factors. Journal of Epidemiology. 2010;20(4):329–338. doi: 10.2188/jea.JE20090140. [DOI] [PMC free article] [PubMed] [Google Scholar]
- 70.Wettergren Y, Odin E, Nilsson S, et al. MTHFR, MTR, and MTRR polymorphisms in relation to p16 (INK4A) gene promoter hypermethylation in colorectal mucosa and clinical outcome of patients with colorectal cancer. Pteridines. 2009;20(3):98–99. [Google Scholar]
- 71.Abuli A, Fernandez-Rozadilla C, Alonso-Espinaco V, et al. Case-control study for colorectal cancer genetic susceptibility in EPICOLON: previously identified variants and mucins. BMC Cancer. 2011;11, article 339 doi: 10.1186/1471-2407-11-339. [DOI] [PMC free article] [PubMed] [Google Scholar]
- 72.Guimarães JLM, Ayrizono MDL, Coy CSR, Lima CSP. Gene polymorphisms involved in folate and methionine metabolism and increased risk of sporadic colorectal adenocarcinoma. Tumor Biology. 2011;32(5):853–861. doi: 10.1007/s13277-011-0185-2. [DOI] [PubMed] [Google Scholar]
- 73.Jokić M, Brčić-Kostić K, Stefulj J, et al. Association of MTHFR, MTR, MTRR, RFC1, and DHFR gene polymorphisms with susceptibility to sporadic colon cancer. DNA and Cell Biology. 2011;30(10):771–776. doi: 10.1089/dna.2010.1189. [DOI] [PubMed] [Google Scholar]
- 74.Sameer AS, Shah ZA, Nissar S, Mudassar S, Siddiqi MA. Risk of colorectal cancer associated with the methylenetetrahydrofolate reductase (MTHFR) C677T polymorphism in the Kashmiri population. Genetics and Molecular Research. 2011;10(2):1200–1210. doi: 10.4238/vol10-2gmr1067. [DOI] [PubMed] [Google Scholar]
- 75.Prasad VVTS, Wilkhoo H. Association of the functional polymorphism C677T in the methylenetetrahydrofolate reductase gene with colorectal, thyroid, breast, ovarian, and cervical cancers. Onkologie. 2011;34(8-9):422–426. doi: 10.1159/000331131. [DOI] [PubMed] [Google Scholar]
- 76.Lee JE, Wei EK, Fuchs CS, et al. Plasma folate, methylenetetrahydrofolate reductase (MTHFR), and colorectal cancer risk in three large nested case-control studies. Cancer Causes and Control. 2012;23(4):537–545. doi: 10.1007/s10552-012-9911-3. [DOI] [PMC free article] [PubMed] [Google Scholar]
- 77.de Vogel S, Wouters KAD, Gottschalk RWH, et al. Genetic variants of methyl metabolizing enzymes and epigenetic regulators: associations with promoter CpG island hypermethylation in colorectal cancer. Cancer Epidemiology Biomarkers and Prevention. 2009;18(11):3086–3096. doi: 10.1158/1055-9965.EPI-09-0289. [DOI] [PubMed] [Google Scholar]
- 78.Heijmans BT, Boer JMA, Suchiman HED, et al. A common variant of the methylenetetrahydrofolate reductase gene (1p36) is associated with an increased risk of cancer. Cancer Research. 2003;63(6):1249–1253. [PubMed] [Google Scholar]
- 79.Downs SH, Black N. The feasibility of creating a checklist for the assessment of the methodological quality both of randomised and non-randomised studies of health care interventions. Journal of Epidemiology and Community Health. 1998;52(6):377–384. doi: 10.1136/jech.52.6.377. [DOI] [PMC free article] [PubMed] [Google Scholar]
- 80.DerSimonian R, Laird N. Meta-analysis in clinical trials. Controlled Clinical Trials. 1986;7(3):177–188. doi: 10.1016/0197-2456(86)90046-2. [DOI] [PubMed] [Google Scholar]
- 81.Silman AJ, MacFarlane GJ. Epidemiological Studies: A Practical Guide. 2nd edition. New York, NY, USA: Cambridge University Press; 2002. [Google Scholar]
- 82.Review Manager (RevMan) The Nordic Cochrane Centre, The Cochrane Collaboration, Copenhagen, Denmark, 2008.
- 83.Hamling J, Lee P, Weitkunat R, Ambühl M. Facilitating meta-analyses by deriving relative effect and precision estimates for alternative comparisons from a set of estimates presented by exposure level or disease category. Statistics in Medicine. 2008;27(7):954–970. doi: 10.1002/sim.3013. [DOI] [PubMed] [Google Scholar]
- 84.Hamling J. Alternative comparisons from related odds ratios or relative risks: RR Est—relative risk estimation program. P N Lee Statistics and Computing Ltd, 2007.
- 85.Begg CB, Mazumdar M. Operating characteristics of a rank correlation test for publication bias. Biometrics. 1994;50(4):1088–1101. [PubMed] [Google Scholar]
- 86.Egger M, Smith GD, Schneider M, Minder C. Bias in meta-analysis detected by a simple, graphical test. British Medical Journal. 1997;315(7109):629–634. doi: 10.1136/bmj.315.7109.629. [DOI] [PMC free article] [PubMed] [Google Scholar]
- 87.Duval S, Tweedie R. Trim and fill: a simple funnel-plot-based method of testing and adjusting for publication bias in meta-analysis. Biometrics. 2000;56(2):455–463. doi: 10.1111/j.0006-341x.2000.00455.x. [DOI] [PubMed] [Google Scholar]
- 88.Borenstein M, Hedges L, Higgins J, et al. Comprehensive Meta-Analysis Version 2.0. Englewood, NJ, USA: Biostat; 2005. [Google Scholar]
- 89.Higgins JTP, Green S. Cochrane Handbook for Systematic Reviews of Interventions. Hoboken, NJ, USA: Wiley-Blackwell; 2008. [Google Scholar]
- 90.Chen J, Giovannucci E, Kelsey K, et al. A methylenetetrahydrofolate reductase polymorphism and the risk of colorectal cancer. Cancer Research. 1996;56(21):4862–4864. [PubMed] [Google Scholar]
- 91.Slattery ML, Potter JD, Samowitz W, Schaffer D, Leppert M. Methylenetetrahydrofolate reductase, diet, and risk of colon cancer. Cancer Epidemiology Biomarkers and Prevention. 1999;8(6):513–518. [PubMed] [Google Scholar]
- 92.Matevska N, Josifovski T, Kapedanovska A, et al. Methylenetetrahydrofolate reductase C677T polymorphism and risk of colorectal cancer in the macedonian population. Balkan Journal of Medical Genetics. 2008;11(2):17–24. [Google Scholar]
- 93.Chen K, Song L, Jin MJ, Fan CH, Jiang QT, Yu WP. Association between genetic polymorphisms in folate metabolic enzyme genes and colorectal cancer: a nested case-control study. Zhonghua Zhong Liu Za Zhi. 2006;28(6):429–432. [PubMed] [Google Scholar]
- 94.Taioli E, Garza MA, Ahn YO, et al. Meta-and pooled analyses of the methylenetetrahydrofolate reductase (MTHFR) C677T polymorphism and colorectal cancer: a HuGE-GSEC review. American Journal of Epidemiology. 2009;170(10):1207–1221. doi: 10.1093/aje/kwp275. [DOI] [PMC free article] [PubMed] [Google Scholar]
- 95.Kono S, Chen K. Genetic polymorphisms of methylenetetrahydrofolate reductase and colorectal cancer and adenoma. Cancer Science. 2005;96(9):535–542. doi: 10.1111/j.1349-7006.2005.00090.x. [DOI] [PMC free article] [PubMed] [Google Scholar]
- 96.Patsopoulos NA, Evangelou E, Ioannidis JPA. Sensitivity of between-study heterogeneity in meta-analysis: proposed metrics and empirical evaluation. International Journal of Epidemiology. 2008;37(5):1148–1157. doi: 10.1093/ije/dyn065. [DOI] [PMC free article] [PubMed] [Google Scholar]
- 97.Blom HJ, Smulders Y. Overview of homocysteine and folate metabolism. With special references to cardiovascular disease and neural tube defects. Journal of Inherited Metabolic Disease. 2011;34(1):75–81. doi: 10.1007/s10545-010-9177-4. [DOI] [PMC free article] [PubMed] [Google Scholar]
- 98.Pitkin RM. Folate and neural tube defects. American Journal of Clinical Nutrition. 2007;85(1):285S–288S. doi: 10.1093/ajcn/85.1.285S. [DOI] [PubMed] [Google Scholar]
- 99.DRI. Dietary Reference Intakes for Thiamin, Riboflavin, Niacin, Vitamin Bb6s, Folate, Vitamin Bb12s, Pantothenic Acid, Biotin, and Choline. Washington, DC, USA: National Academy Press; 1998. [PubMed] [Google Scholar]
- 100.Stevens VL, McCullough ML, Sun J, Jacobs EJ, Campbell PT, Gapstur SM. High levels of folate from supplements and fortification are not associated with increased risk of colorectal cancer. Gastroenterology. 2011;141(1):98.e1–105.e1. doi: 10.1053/j.gastro.2011.04.004. [DOI] [PubMed] [Google Scholar]