Abstract
Many researchers have established the utility of the dynamic contrast enhanced-magnetic resonance imaging (DCE-MRI) in the differential diagnosis in the head and neck region, especially in the salivary gland tumors. The subjective assessment of the pattern of the time-intensity curve (TIC) or the simple quantification of the TIC, such as the time to peak enhancement (T peak) and the wash-out ratio (WR), is commonly used. Although the semiquantitative evaluations described above have been widely applied, they do not provide information on the underlying pharmacokinetic analysis in tissue. The quantification of DCE-MRI is preferable; therefore, many compartment model analyses have been proposed. The Toft and Kermode (TK) model is one of the most popular compartment models, which provide information about the influx forward volume transfer constant from plasma into the extravascular-extracellular space (EES) and the fractional volume of EES per unit volume of tissue is used in many clinical studies. This paper will introduce the method of pharmacokinetic analysis and also describe the clinical application of this technique in the head and neck region.
1. Introduction
The technique of dynamic contrast enhanced (DCE) magnetic resonance imaging (MRI), in which multiphase MRI scans are taken following the intravenous injection of a contrast agent, has been widely used in clinical practice. Many researchers have established the utility of the DCE-MRI in the differential diagnosis of salivary gland tumors [1–3]. DCE-MRI can successfully demonstrate the nature of a lymphoma and is helpful for making a differential diagnosis from other lesions[4]. Some researcher have also attempted to utilize DCE-MRI for lesions in the jaw bone[5–7]. The most conventional assessment using DCE-MRI may, therefore, be to use the characteristics of the time-intensity curve (TIC) regarding the regions of interest (ROIs), which are delineated by the observers. The subjective assessment of the pattern of the TIC or the simple quantification of the TIC, such as the time to peak enhancement (T peak) and the wash-out ratio (WR), is also commonly used.
Although the semiquantitative evaluations described above have been widely applied, they do not provide information on the underlying pharmacokinetic nature in the tissue. Moreover, an analysis based on the signal intensity (SI) is predominantly affected by the scan parameters. Therefore, it is difficult to compare the results obtained at different institutes. Conversely, a pharmacokinetic analysis enables the quantification of contrast agent exchange between the intravascular and the interstitial space [8–11]. Pharmacokinetic analyses based on the two compartment model, which can provide information about the microvessel permeability and the extracellular space, have been widely applied. The contrast medium can leak out of the vasculature at variable rates; hence, the temporal resolution of low molecular weight contrast media needs to be on the order of 5–20 seconds.
There is an another technique, which is called T 2* or susceptibility contrast enhanced (DSC) MRI. The contrast medium used for this technique is assumed to be predominantly confined to the vascular space, which thus provides the valuable information about perfusion, such as the blood volume (BV), blood flow (BF), and transit time; therefore, the required temporal resolution is on the order of 1-2 seconds. T 2*-weighted sequences are used to monitor the passage of the contrast media, because of a transient darkening of the tissue during the first passage of the contrast media. However, there are a few reports on DSC-MRI usage outside the brain. Especially, the image quality of the T 2*-weighted images is poor in the head and neck region, because of the pneumatic space and the presence of oral prostheses. Therefore, this study focused on DCE-MRI.
2. The Subjective and Semiquantitative Analysis of TICs
The validity of DCE-MRI has been established for the diagnostic analysis of salivary gland tumors [1–3]. Many studies have so far evaluated the TICs by placing an ROI on the tumor and comparing T peak and WR. The T peak for pleomorphic adenomas is longer than that for both malignant tumors and Warthin's tumors. Moreover, the WR for Warthin's tumors is the highest among those three lesions. A rapid increase—rapid washout pattern—suggests a high possibility of Warthin's tumor. A persistent increase pattern suggests the benign nature of a tumor, suggesting a high possibility of pleomorphic adenoma. A plateau pattern with slow washout is characteristic of both a malignant tumor and pleomorphic adenoma. Yabuuchi et al. successfully demonstrated the validation of DCE-MRI (22 benign tumors, 11 malignant tumors) and evaluated the correlations between the T peak and microvessel count and between WR and cellularity-stromal grade. The microvessel count is thought to represent tumor vascularity, and the T peak is short if the microvessel count is high. The WR depends on the difference in the amount of contrast material within the tumor between the intravascular and extravascular phases. Therefore, a tumor with a high cellularity-stromal grade retains less contrast medium and has a high WR [1]. A subsequent study combined DCE-MRI with the diffusion-weighted image and improved the diagnostic power for tumors with a plateau pattern [2].
Many salivary gland tumors are composed of distinctive tissues, including proliferating tumor cells, myxomatous tissues, necrotic tissues, and cysts. Therefore, analyzing a large ROI may result in spurious results. A pixel-to-pixel evaluation of the TIC might enable effective and detailed characterization of the histological features. Eida et al. performed a pixel-to-pixel evaluation, in which each of the obtained TICs was automatically classified into four types on the basis of T peak and WR into four types; type A (gradual enhancement), type B (rapid enhancement and low washout), type C (rapid enhancement and high washout), and type D (flat). Pleomorphic adenoma shows predominantly areas with type A. Warthin's tumor shows predominantly areas with type C; however, it also includes areas of type D, which corresponded to the microcysts. A malignant tumor shows areas with type A and type B. Therefore, a scattered type B area suggests the high possibility of malignancy [12, 13]. Their coworkers successively applied this method to other types of head and neck tumors [14, 15].
DCE-MRI can successfully demonstrate the nature of a lymphoma and it is helpful for the differential diagnosis from another type of lesion. Some researchers applied DCE-MRI for evaluating lesions in the jaw bone [5–7]. Asaumi et al. demonstrated that DCE-MRI features of odontogenic myxomas are different from those of ameloblastomas and that a very slow gradual increase of signal intensity (SI) is characteristic of odontogenic myxomas [5]. However, ameloblastomas showed no difference in TIC pattern between histopathological types (plexiform, follicular, mixed desmoplastic, and unicystic type) [6].
Although semiquantitative evaluations have been widely applied, they cannot provide sufficient information to make an underlying pharmacokinetic analysis of tissue. The quantification of DCE-MRI is preferable to predict tumor response to anticancer therapy and monitoring the tumor response to the therapy. Therefore, this study will introduce the method of pharmacokinetic analysis and also describe the clinical application of this technique.
3. The Pharmacokinetic Analysis of DCE-MRI
There are many kinetic models; however, the Toft and Kermode (TK) model are usually used in clinical studies [8–10]. This model provide information about the influx forward volume transfer constant from plasma into the extravascular-extracellular space (EES) and fractional volume of EES per unit volume of tissue. A more elaborate pharmacokinetic model had been proposed to estimate additional characteristic parameters like BF, BV, and so on. For example, an adiabatic approximation of the tissue homogeneity model provides additional information. Therefore, it enables the permeability surface-area product to be measured separately from tissue perfusion [16–18]. However, the elaborated model is not yet supported by sufficient evidence and it is difficult to carry out in many institutes. Therefore, the following section introduces the theory of the two simple models, namely, the TK model [8–10] and Brix model [19, 20].
4. Theory 1: Toft and Kermode Model (TK Model) [8–10]
The TK model is one of the popular compartment models, which assumes the equilibrium of contrast media between the plasma and the EES and the isodirectional permeability (Figure 1), therefore, the equilibrium is described by
| (1) |
where t is the time, C t is the concentration of contrast media (CM) in tissue, C p is the concentration of CM in plasma, K trans is the influx forward volume transfer constant (into EES from plasma), and v e is the fractional volume of EES per unit volume of tissue (Figure 1).
Figure 1.
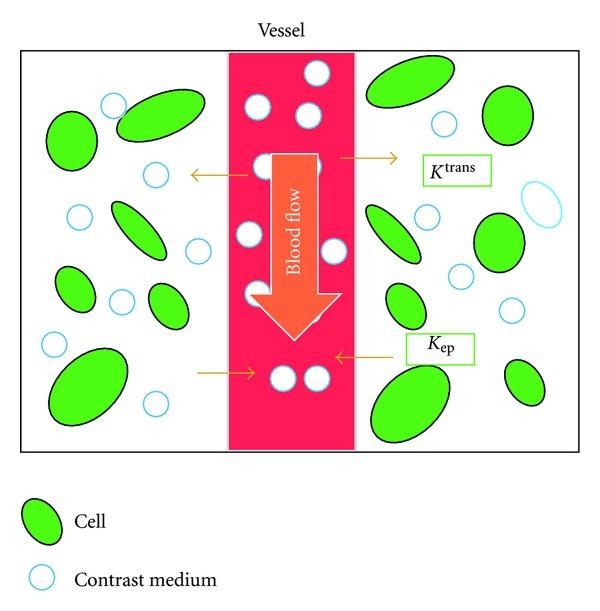
Schematic illustration of the TK model. The model assumes equilibrium of the contrast media between the plasma and the extravascular-extracellular space (EES) and the isodirectional permeability and K trans: influx forward volume transfer constant (into EES from plasma), v e: fractional volume of EES per unit volume of tissue, K ep: the efflux rate constant from the EES to plasma (K ep = K trans/v e).
The original TK model (one-compartment, two-parameter model) assumes the concentration of the CM is derived from the EES components and the plasma component is negligible:
| (2) |
The modified TK model (two-compartment, three-parameter model) assumes the concentration of the CM is derived from the EES and plasma
| (3) |
where v e is the fractional volume of plasma per unit volume of tissue.
Substituting C t and C p into either (2) or (3) allows the variables (K trans, v e, and v p) to be estimated. The pharmacokinetic analysis requires the C t; however, the relationship between the signal intensity (SI) and the concentration of the CM is not linear; therefore, conversion of the SI into the concentration of CM is needed.
The key concept is that the increase in the relaxation rate is linearly related to the concentration in tissue:
| (4) |
where T 10 is T 1 relaxation time before injection of CM, T 1 is T 1 relaxation times during the dynamic sequence (during and after injection of CM), R 1 is a constant (relaxation rate) determined for each CM, and C is the concentration of CM during the dynamic sequence.
The first step for the estimation of C is to make an accurate T 10 map. Most clinical studies using DCE-MRI include a precontrast T 1-weighted image (3D-transverse-spoiled gradient echo sequence) with different flip angles to obtain a T 10 map [21, 22]. This is followed by the dynamic contrast-enhanced series using the same sequence but with an FA, which is usually equal to the highest value in the pre-contrast image. The signal intensity of a transverse-spoiled gradient echo sequence is given by
| (5) |
where M is the proton density, α is the flip angle, TR is the repetition time. The pre-contrast data obtained with different flip angles substitute into (5) to yield the T 10 map.
However, pulse sequences using a train of read-out pulse (e.g., variable flip angles) are particularly susceptible to the errors in the flip angles. Alternatively, magnetization prepared sequence-like inversion recovery and saturation recovery are less affected by the B1 nonuniformity. The Look-Locker (LL) sequence employs multiple radiofrequency pulses during the magnetization recovery to sample several time points and thereby track the recovery of magnetization, which have been applied for fast T 1 mapping [23, 24]. This technique has also been successfully applied to the orofacial region [25].
The T 10 map is obtained first, then the T 1 map during the dynamic contrast-enhanced series can be defined as
| (6) |
The concentration of CM is estimated by the substitution of T 1 and T 10 obtained by (5) and (6) into (4) (Figure 2).
Figure 2.
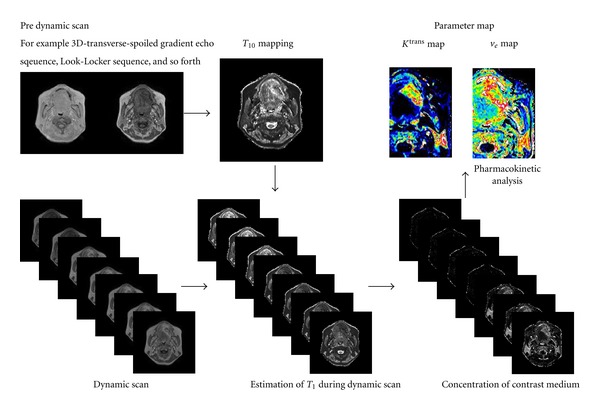
Diagram of the pharmacokinetic analysis.
The estimation of C t (concentration of CM in tissue) was described above. The concentration of CM in the total blood (C b = (1 − hematocrit) · C p) can be estimated by the same theory, if the region of interest (ROI) is placed in an artery; however, this estimation is quite inaccurate because of the high arterial CM concentration and the inflow effects. The high speed of the main artery and the vessel orientation, which is almost vertical to the axial DCE-MRI, makes it difficult to estimate an accurate C b, especially in the head and neck region. Alternatively, an empirical or population-derived input function describing a biexponential form is commonly used in this area [26–28].
Substituting C t and C p into either (2) or (3) allows the parameter map (K trans, v e, and v p map) to be estimated (Figure 3).
Figure 3.
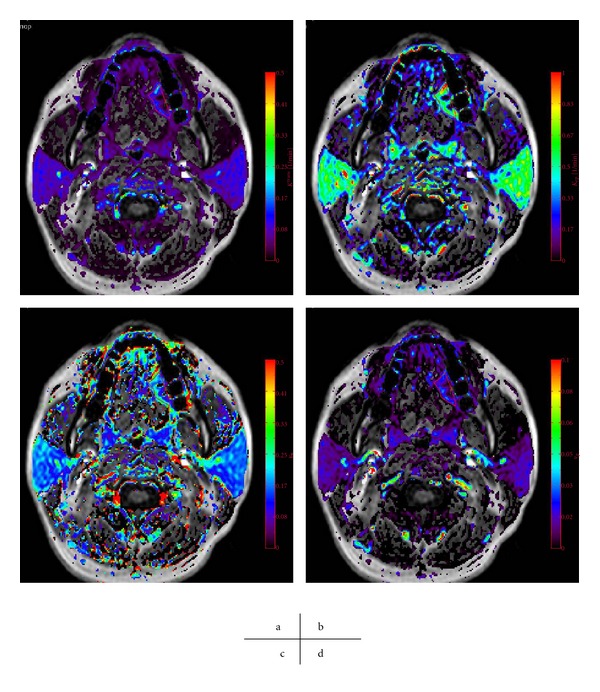
The parameter map of patients with left tongue cancer obtained by a TK model analysis. K trans (a), K ep (b), v e (c), and v p (d) map.
5. Theory 2: The Brix Model [19, 20]
The Brix model is a linear two-compartment open model, where the peripheral compartment has only negligible effects on the central compartment (Figure 4). The model was first applied to DCE-MRI with slow infusion. The C t data were fitted to the Brix pharmacokinetic model as shown in the following equation:
| (7) |
where TA is the time of the arrival of the CM, K el is the elimination constant of the CM from the central compartment, K ep is the exchange rate constant from the EES to plasma, and AH is the amplitude scaling constant. AH is predominantly affected by the ratio of EES, although various indices like the properties of tissue (T 10, T 20, K 12, ratio of EES, etc.), scan parameters (TR, TE), and infusion rates [19, 20].
Figure 4.
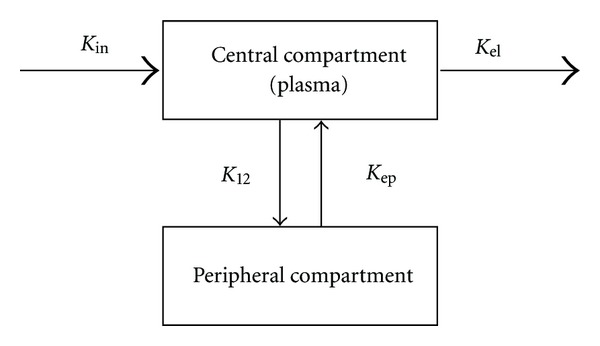
Schematic illustration of the Brix model. The model is a linear two-compartment open model, where the peripheral compartment has only negligible effects on the central compartment. K ep: the exchange rate constant from the EES to plasma, K el: the elimination constant of the CM from the central compartment, and AH: the amplitude scaling constant.
The original Brix model assumed that the signal-time data (SI) were first normalized (SI0) and then converted to the concentration-time data (C t) based on the following relationship:
| (8) |
where SI0 is the baseline signal intensity before the injection of contrast medium and δ is a constant of proportionality. C t could be approximated by (8) in a low concentration of CM and short TR/TE, although (8) is not strictly correct. It does not need T 10 mapping or arterial input function measurements and therefore, it has been applied to clinical study as a simple quantitative method. However, the influx forward volume transfer constant into EES from plasma (K trans), which is an important parameter in the perfusion study, cannot be obtained, and this is considered to be a major drawback of this analysis.
6. Clinical Application of Pharmacokinetic Analysis
Studies have demonstrated the utility of a pharmacokinetic analysis in the differential diagnosis of head and neck lesions. Lee et al. applied a pharmacokinetic analysis to 63 patients with 26 undifferentiated (UD) carcinomas, 28 squamous cell carcinoma (SCC), and 8 lymphomas. They demonstrated significant differences in the K trans between UD and SCC and between UD and lymphoma. They suggested that their K trans results appear to correlate with the expression of vascular endothelial growth factor (VEGF). The v e of the lymphoma was the smallest among three types of tumor; however, the differences were not significant [29].
Roberts compared parotid gland microvascular characteristics in patients with Sjögren's syndrome (n = 21) with those in healthy volunteers (n = 11). They demonstrated that the patients with Sjögren's syndrome had highly significant differences in both the K trans and v e. Gland heterogeneity was significantly greater in the patients with Sjögren's syndrome [30].
Lee et al. also evaluated radiation injury of the parotid gland during treatment for head and neck cancer (n = 21). DCE-MRI was performed before and 3 months after radiotherapy. The mean radiation dose was 47.1 ± 6.6 Gy and all the patients received concurrent chemotherapy. Three parameters (K trans, v e, and v p) were correlated with the dose of radiation delivered to the parotid gland and the degree of radiation-induced parotid atrophy [31].
Pharmacokinetic analyses have been widely applied to the pretreatment prediction of therapeutic efficacy and monitoring the tumor response to anticancer therapies. Several studies demonstrated that chemoradiotherapy (CRT) is more effective against tumors with a higher pretreatment K trans than those with a lower K trans and suggested that the elevated blood flow and permeable vasculature had higher oxygenation levels, thus resulting in better access to the chemotherapeutic drug and better radiosensitivity. Agrawal et al. performed DCE-MRI for twenty-one patients with advanced NHC, treated by concurrent CRT. All patients received a radical dose up to a dose of 70 Gy of conventionally fractionated radiotherapy (RT) along with concurrent weekly cisplatin. They found that the values of both BV and BF were higher than in complete responders in comparison to partial responders [32]. Kim et al. enrolled 33 HNSCC patients treated by neoadjuvant CRT. Treatment included accelerated RT with 220cGy per fraction for a total dose of 70.4 Gy. They demonstrated that the average pretreatment K trans of the CR group was significantly higher than that of the PR group [33].
Studies have shown that staining for pimonidazole, an exogenous marker of hypoxia, is significantly associated with K trans and K ep. Many HNSCC studies suggest a high pre-treatment permeability (K trans) is linked to favorable treatment outcome [34, 35].
Many researchers demonstrated the utility of DCE-MRI for monitoring the tumor response to anticancer therapy in various tissues (breast, bladder, bone, etc.). A decrease of the K trans suggests a good response to chemotherapy; however, an increase or no change suggests a poor response to chemotherapy.
Some HNSCC studies found that a large reduction of the permeability (K trans) is also linked to better response to CRT [36, 37]. However, other studies demonstrated conflicting results, where an increase of permeability (K trans) or blood volume (BV) after CRT suggests a favorable outcome. Cao et al. performed the quantification of blood volume and blood flow based on DCE-MRI taken before therapy and 2 weeks after the initiation of CRT (n = 14). They evaluated the local and regional control and concluded that an increase of BV and BF suggested the good outcome [38].
Chikui et al. [39] performed DCE-MRI before and after preoperative CRT (n = 29). The histological evaluation of the effects of CRT was performed according to Ohboshi and Shimosato's classification [40] in the excised specimen after the surgery. These criteria grade the tumor response from I (minimal change) to IV (complete disappearance of the tumor cells). Patients with grades IIb, III, and IV are considered responders (n = 19), while those with grades IIa and I are considered nonresponders (n = 10). The change of K trans of the responders was significantly larger than from that of the nonresponders (P = 0.018) [39] (Figures 5 and 6).
Figure 5.
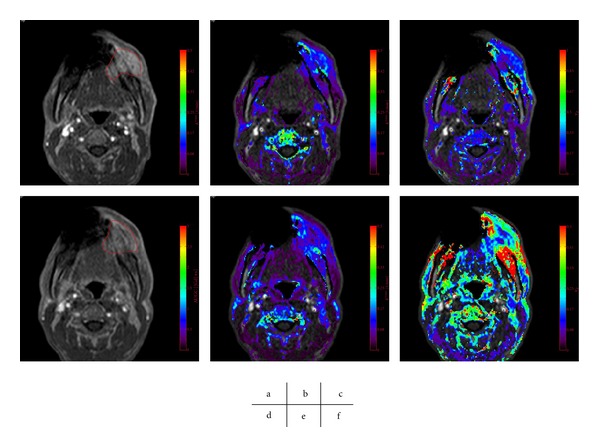
A poor tumor response to CRT, with an Ohboshi and Shimosato classification of I. The analyses were performed using a proprietary software program (PRIDE software, Philips Healthcare, Eindhoven, The Netherlands). Pre-CRT (a–c), Gd-enhanced T 1 WI (a), K trans map (b), v e map (c), Post-CRT (d–f), Gd-enhanced T 1 WI (d), K trans map (e), v e map (f). The tumor ROIs are delineated in red (a, d). The pre-CRT K trans was 0.13 and K trans decreased after CRT with an average of 0.10. v e decrease from 0.28 to 0.23.
Figure 6.
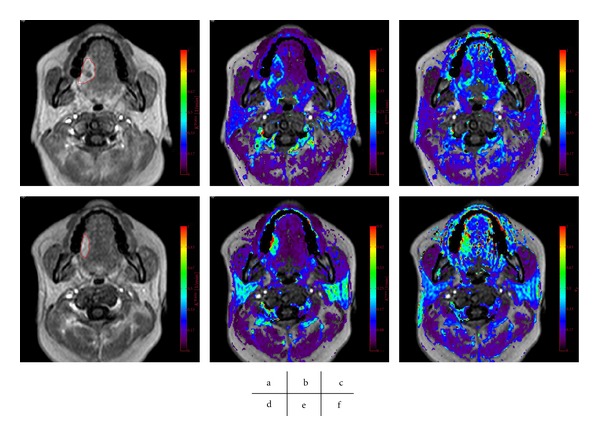
A good tumor response to CRT, with an Ohboshi and Shimosato classification of III. The analyses were performed using a proprietary software program (PRIDE software, Philips Healthcare, Eindhoven, The Netherlands). Pre-CRT (a–c), Gd enhanced T 1 WI (a), K trans map (b), v e map (c), Post-CRT (d–f), Gd enhanced T 1 WI (d), K trans map (e), v e map (f). The tumor ROIs are delineated in red (a, d). K trans increase from 0.14 to 0.22 and v e decrease from 0.28 to 0.52.
These conflicting results may be due to the type of therapy, the endpoint definition, the timing of the evaluation, and so on. The low radiation dose administered in this study caused an early vascular response, which typically involves a phase of vasodilatation and an increase in blood supply, similar to that observed during acute inflammation, although it is followed by the constriction of capillaries as the total dose increases. Mayer et al. reported the results of cervical carcinoma patients, who underwent DCE-MRIs at baseline and at week 2 and 5 of external beam RT. They demonstrated that the increased permeability at week 2 of the RT is associated with higher local control and overall survival rates. The tumor reoxygenation accompanied with the increased perfusion/permeability is attributed to the good tumor response [41].
CRT causes a significant increase in the EES and moreover, the degree of tumor response is correlated with the increase in the EES. These were previous reports, in which the Brix model was used for patients with oral [42] and esophageal [43] carcinoma to compare the parameters between before and after CRT. AH was an important parameter for monitoring the tumor response and a large increase in AH shows a good tumor response to CRT. A TK analysis in the patients with oral SCC also demonstrated that a larger increase in v e suggests a good response to the CRT (Figures 5 and 6).
The increase of apparent diffusion coefficient (ADC) in responders can be interpreted as a decrease in the cell density and an enlarged EES [44, 45]. Vandecaveye et al. reported the use of DWI for the detection of an early response to CRT treatment and demonstrated that an increase of ADC after treatment is indicative of a high possibility of local control [44]. The results of v e obtained by DCE-MRI are consistent with the results of ADC obtained by diffusion-weighted MRI.
7. Conclusions
The image assessment of DCE-MRI and a pharmacokinetic analysis together reveal the underlying tissue and tumor biology and thus provide additional information. The TK model analysis has established the validity of predicting the tumor response to the therapy and monitoring the tumor response. However, the parameters reported in the literature vary considerably; therefore, it is difficult to compare the parameters among research groups. Thus, further standardization of this analysis is required. An accurate T 10 map and accurate arterial input function measurements are essential for the further development of a model analysis in the head and neck region.
References
- 1.Yabuuchi H, Fukuya T, Tajima T, Hachitanda Y, Tomita K, Koga M. Salivary gland tumors: diagnostic value of gadolinium-enhanced dynamic MR imaging with histopathologic correlation. Radiology. 2003;226(2):345–354. doi: 10.1148/radiol.2262011486. [DOI] [PubMed] [Google Scholar]
- 2.Yabuuchi H, Matsuo Y, Kamitani T, et al. Parotid gland tumors: can addition of diffusion-weighted MR imaging to dynamic contrast- Enhanced MR imaging improve diagnostic accuracyin characterization? Radiology. 2008;249(3):909–916. doi: 10.1148/radiol.2493072045. [DOI] [PubMed] [Google Scholar]
- 3.Hisatomi M, Asaumi JI, Yanagi Y, et al. Diagnostic value of dynamic contrast-enhanced MRI in the salivary gland tumors. Oral Oncology. 2007;43(9):940–947. doi: 10.1016/j.oraloncology.2006.11.009. [DOI] [PubMed] [Google Scholar]
- 4.Matsuzaki H, Katase N, Hara M, et al. Primary extranodal lymphoma of the maxilla: a case report with imaging features and dynamic data analysis of magnetic resonance imaging. Oral Surgery, Oral Medicine, Oral Pathology, Oral Radiology and Endodontology. 2011;113(1):126–133. doi: 10.1016/j.tripleo.2011.02.052. [DOI] [PubMed] [Google Scholar]
- 5.Asaumi JI, Matsuzaki H, Hisatomi M, Konouchi H, Shigehara H, Kishi K. Application of dynamic MRI to differentiating odontogenic myxomas from ameloblastomas. European Journal of Radiology. 2002;43(1):37–41. doi: 10.1016/s0720-048x(01)00453-3. [DOI] [PubMed] [Google Scholar]
- 6.Asaumi JI, Hisatomi M, Yanagi Y, et al. Assessment of ameloblastomas using MRI and dynamic contrast-enhanced MRI. European Journal of Radiology. 2005;56(1):25–30. doi: 10.1016/j.ejrad.2005.01.006. [DOI] [PubMed] [Google Scholar]
- 7.Yanagi Y, Asaumi JI, Unetsubo T, et al. Usefulness of MRI and dynamic contrast-enhanced MRI for differential diagnosis of simple bone cysts from true cysts in the jaw. Oral Surgery, Oral Medicine, Oral Pathology, Oral Radiology and Endodontology. 2010;110(3):364–369. doi: 10.1016/j.tripleo.2010.05.001. [DOI] [PubMed] [Google Scholar]
- 8.Tofts PS. Modeling tracer kinetics in dynamic Gd-DTPA MR imaging. Journal of Magnetic Resonance Imaging. 1997;7(1):91–101. doi: 10.1002/jmri.1880070113. [DOI] [PubMed] [Google Scholar]
- 9.Tofts PS, Brix G, Buckley DL, et al. Estimating kinetic parameters from dynamic contrast-enhanced T(1)-weighted MRI of a diffusable tracer: standardized quantities and symbols. Journal of Magnetic Resonance Imaging. 1999;10(3):223–232. doi: 10.1002/(sici)1522-2586(199909)10:3<223::aid-jmri2>3.0.co;2-s. [DOI] [PubMed] [Google Scholar]
- 10.Leach MO, Morgan B, Tofts PS, et al. Imaging vascular function for early stage clinical trials using dynamic contrast-enhanced magnetic resonance imaging. European Radiology. 2012;22(7):1451–1464. doi: 10.1007/s00330-012-2446-x. [DOI] [PubMed] [Google Scholar]
- 11.Zwick S, Brix G, Tofts PS, et al. Simulation-based comparison of two approaches frequently used for dynamic contrast-enhanced MRI. European Radiology. 2010;20(2):432–442. doi: 10.1007/s00330-009-1556-6. [DOI] [PubMed] [Google Scholar]
- 12.Eida S, Ohki M, Sumi M, Yamada T, Nakamura T. MR factor analysis: improved technology for the assessment of 2D dynamic structures of benign and malignant salivary gland tumors. Journal of Magnetic Resonance Imaging. 2008;27(6):1256–1262. doi: 10.1002/jmri.21349. [DOI] [PubMed] [Google Scholar]
- 13.Eida S, Sumi M, Nakamura T. Multiparametric magnetic resonance imaging for the differentiation between benign and malignant salivary gland tumors. Journal of Magnetic Resonance Imaging. 2010;31(3):673–679. doi: 10.1002/jmri.22091. [DOI] [PubMed] [Google Scholar]
- 14.Sasaki M, Eida S, Sumi M, Nakamura T. Apparent diffusion coefficient mapping for sinonasal diseases: differentiation of benign and malignant lesions. American Journal of Neuroradiology. 2011;32(6):1100–1106. doi: 10.3174/ajnr.A2434. [DOI] [PMC free article] [PubMed] [Google Scholar]
- 15.Sumi M, Nakamura T. Extranodal spread in the neck: MRI detection on the basis of pixel-based time-signal intensity curve analysis. Journal of Magnetic Resonance Imaging. 2011;33(4):830–838. doi: 10.1002/jmri.22454. [DOI] [PubMed] [Google Scholar]
- 16.St Lawrence KS, Lee TY. An adiabatic approximation to the tissue homogeneity model for water exchange in the brain: I. Theoretical derivation. Journal of Cerebral Blood Flow and Metabolism. 1998;18(12):1365–1377. doi: 10.1097/00004647-199812000-00011. [DOI] [PubMed] [Google Scholar]
- 17.St Lawrence KS, Lee TY. An adiabatic approximation to the tissue homogeneity model for water exchange in the brain: II. Experimental validation. Journal of Cerebral Blood Flow and Metabolism. 1998;18(12):1378–1385. doi: 10.1097/00004647-199812000-00012. [DOI] [PubMed] [Google Scholar]
- 18.Naish JH, Kershaw LE, Buckley DL, Jackson A, Waterton JC, Parker GJM. Modeling of contrast agent kinetics in the lung using T1- weighted dynamic contrast-enhanced MRI. Magnetic Resonance in Medicine. 2009;61(6):1507–1514. doi: 10.1002/mrm.21814. [DOI] [PubMed] [Google Scholar]
- 19.Brix G, Semmler W, Port R, Schad LR, Layer G, Lorenz WJ. Pharmacokinetic parameters in CNS Gd-DTPA enhanced MR imaging. Journal of Computer Assisted Tomography. 1991;15(4):621–628. doi: 10.1097/00004728-199107000-00018. [DOI] [PubMed] [Google Scholar]
- 20.Buckley DL, Kerslake RW, Blackband SJ, Horsman A. Quantitative analysis of multi-slice Gd-DTPA enhanced dynamic MR images using an automated simplex minimization procedure. Magnetic Resonance in Medicine. 1994;32(5):646–651. doi: 10.1002/mrm.1910320514. [DOI] [PubMed] [Google Scholar]
- 21.Wang HZ, Riederer SJ, Lee JN. Optimizing the precision in T1 relaxation estimation using limited flip angles. Magnetic Resonance in Medicine. 1987;5(5):399–416. doi: 10.1002/mrm.1910050502. [DOI] [PubMed] [Google Scholar]
- 22.Ocak I, Bernardo M, Metzger G, et al. Dynamic contrast-enhanced MRI of prostate cancer at 3 T: a study of pharmacokinetic parameters. American Journal of Roentgenology. 2007;189(4):p. 849. doi: 10.2214/AJR.06.1329. [DOI] [PubMed] [Google Scholar]
- 23.Look DC, Locker DR. Time saving in measurement of NMR and EPR relaxation times. Review of Scientific Instruments. 1970;41(2):250–251. [Google Scholar]
- 24.Kay I, Henkelman RM. Practical implementation and optimization of one-shot T1 imaging. Magnetic Resonance in Medicine. 1991;22(2):414–424. doi: 10.1002/mrm.1910220249. [DOI] [PubMed] [Google Scholar]
- 25.Chikui T, Tokumori K, Zeze R, et al. A fast Look-Locker method for T 1 mapping of the head and neck region. Oral Radiology. 2009;25(1):22–29. [Google Scholar]
- 26.Weinmann HJ, Laniado M, Mützel W. Pharmacokinetics of GdDTPA/dimeglumine after intravenous injection into healthy volunteers. Physiological chemistry and physics and medical NMR. 1984;16(2):167–172. [PubMed] [Google Scholar]
- 27.Parker GJM, Roberts C, Macdonald A, et al. Experimentally-derived functional form for a population-averaged high-temporal-resolution arterial input function for dynamic contrast-enhanced MRI. Magnetic Resonance in Medicine. 2006;56(5):993–1000. doi: 10.1002/mrm.21066. [DOI] [PubMed] [Google Scholar]
- 28.Fritz-Hansen T, Rostrup E, Larsson HBW, Søndergaard L, Ring P, Henriksen O. Measurement of the arterial concentration of Gd-DTPA using MRI: a step toward quantitative perfusion imaging. Magnetic Resonance in Medicine. 1996;36(2):225–231. doi: 10.1002/mrm.1910360209. [DOI] [PubMed] [Google Scholar]
- 29.Lee FK, King AD, Kam MK, Ma BB, Yeung DK. Radiation injury of the parotid glands during treatment for head and neck cancer: assessment using dynamic contrast-enhanced MR imaging. Radiation Research. 2011;175(3):291–296. doi: 10.1667/RR2370.1. [DOI] [PubMed] [Google Scholar]
- 30.Roberts C, Parker GJM, Rose CJ, et al. Glandular function in sjögren syndrome: assessment with dynamic contrast-enhanced MR imaging and tracer kinetic modeling-Initial experience. Radiology. 2008;246(3):845–853. doi: 10.1148/radiol.2463070298. [DOI] [PubMed] [Google Scholar]
- 31.Lee FKH, King AD, Ma BBY, Yeung DKW. Dynamic contrast enhancement magnetic resonance imaging (DCE-MRI) for differential diagnosis in head and neck cancers. European Journal of Radiology. 2011 doi: 10.1016/j.ejrad.2011.01.089. [DOI] [PubMed] [Google Scholar]
- 32.Agrawal S, Awasthi R, Singh A, Haris M, Gupta RK, Rathore RKS. An exploratory study into the role of dynamic contrast-enhanced (DCE) MRI metrics as predictors of response in head and neck cancers. Clinical Radiology. 2012;67(9):e1–e5. doi: 10.1016/j.crad.2012.03.005. [DOI] [PubMed] [Google Scholar]
- 33.Kim S, Loevner LA, Quon H, et al. Prediction of response to chemoradiation therapy in squamous cell carcinomas of the head and neck using dynamic contrast-enhanced MR imaging. American Journal of Neuroradiology. 2010;31(2):262–268. doi: 10.3174/ajnr.A1817. [DOI] [PMC free article] [PubMed] [Google Scholar]
- 34.Newbold K, Castellano I, Charles-Edwards E, et al. An exploratory study into the role of dynamic contrast-enhanced magnetic resonance imaging or perfusion computed tomography for detection of intratumoral hypoxia in head-and-neck cancer. International Journal of Radiation Oncology Biology Physics. 2009;74(1):29–37. doi: 10.1016/j.ijrobp.2008.07.039. [DOI] [PubMed] [Google Scholar]
- 35.Donaldson SB, Betts G, Bonington SC, et al. Perfusion estimated with rapid dynamic contrast-enhanced magnetic resonance imaging correlates inversely with vascular endothelial growth factor expression and pimonidazole staining in head-and-neck cancer: a pilot study. International Journal of Radiation Oncology, Biology, Physics. 2011;81(4):1176–1183. doi: 10.1016/j.ijrobp.2010.09.039. [DOI] [PubMed] [Google Scholar]
- 36.Shukla-Dave A, Lee NY, Jansen JFA, et al. Dynamic contrast-enhanced magnetic resonance imaging as a predictor of outcome in head and neck squamous cell carcinoma patients with nodal metastases. International Journal of Radiation Oncology, Biology, Physics. 2012;82(5):1837–1844. doi: 10.1016/j.ijrobp.2011.03.006. [DOI] [PMC free article] [PubMed] [Google Scholar]
- 37.Hoskln PJ, Saunders MI, Goodchild K, Powell B, Taylor NJ, Baddeley H. Dynamic contrast enhanced magnetic resonance scanning as a predictor of response to accelerated radiotherapy for advanced head and neck cancer. British Journal of Radiology. 1999;72:1093–1098. doi: 10.1259/bjr.72.863.10700827. [DOI] [PubMed] [Google Scholar]
- 38.Cao Y, Popovtzer A, Li D, et al. Early prediction of outcome in advanced head-and-neck cancer based on tumor blood volume alterations during therapy: a prospective study. International Journal of Radiation Oncology Biology Physics. 2008;72(5):1287–1290. doi: 10.1016/j.ijrobp.2008.08.024. [DOI] [PMC free article] [PubMed] [Google Scholar]
- 39.Chikui T, Kitamoto E, Kawano S, et al. Pharmacokinetic analysis based on dynamic contrast-enhanced MRI for evaluating tumor response to preoperative therapy for oral cancer. Journal of Magnetic Resonance Imaging. 2012;36(3):589–597. doi: 10.1002/jmri.23704. [DOI] [PubMed] [Google Scholar]
- 40.Shimosato Y, Oboshi S, Baba K. Histological evaluation of effects of radiotherapy and chemotherapy for carcinomas. Japanese Journal of Clinical Oncology. 1971;1(1):19–35. [Google Scholar]
- 41.Mayr NA, Wang JZ, Zhang D, et al. Longitudinal changes in tumor perfusion pattern during the radiation therapy course and its clinical impact in cervical cancer. International Journal of Radiation Oncology Biology Physics. 2010;77(2):502–508. doi: 10.1016/j.ijrobp.2009.04.084. [DOI] [PubMed] [Google Scholar]
- 42.Chikui T, Kawano S, Kawazu T, et al. Prediction and monitoring of the response to chemoradiotherapy in oral squamous cell carcinomas using a pharmacokinetic analysis based on the dynamic contrast-enhanced MR imaging findings. European Radiology. 2011:1–10. doi: 10.1007/s00330-011-2102-x. [DOI] [PubMed] [Google Scholar]
- 43.Oberholzer K, Pohlmann A, Schreiber W, et al. Assessment of tumor microcirculation with dynamic contrast-enhanced MRI in patients with esophageal cancer: initial experience. Journal of Magnetic Resonance Imaging. 2008;27(6):1296–1301. doi: 10.1002/jmri.21305. [DOI] [PubMed] [Google Scholar]
- 44.Vandecaveye V, Dirix P, De Keyzer F, et al. Predictive value of diffusion-weighted magnetic resonance imaging during chemoradiotherapy for head and neck squamous cell carcinoma. European Radiology. 2010;20(7):1703–1714. doi: 10.1007/s00330-010-1734-6. [DOI] [PubMed] [Google Scholar]
- 45.King AD, Mo FKF, Yu KH, et al. Squamous cell carcinoma of the head and neck: diffusion-weighted MR imaging for prediction and monitoring of treatment response. European Radiology. 2010;20(9):2213–2220. doi: 10.1007/s00330-010-1769-8. [DOI] [PubMed] [Google Scholar]


