

Abstract
An ideal surface for implantable glucose sensors would be able to evade the events leading to chronic inflammation and fibrosis, thereby extending its utility in an in vivo environment. Nafion™, a perfluorinated ionomer, is the membrane material preferred for in situ glucose sensors. Unfortunately, the surface properties of Nafion™ promote random protein adsorption and eventual foreign body encapsulation, thus leading to loss of glucose signal over time. Details of the techniques to render Nafion™ nonprotein fouling are given in a previous article [T. I. Valdes et al., Biomaterials 29, 1356 (2008)]. Once random protein adsorption is prevented, a biologically active peptide can be covalently bonded to the treated Nafion™ to induce cellular adhesion. Cellular responses to these novel decorated Nafion™ surfaces are detailed here, including cell viability, cell spreading, and type I collagen synthesis. Normal human dermal fibroblasts NHDFs) were cultured on control and modified Nafion™ surfaces. Findings indicate that Nafion™ modified with 10% 2-hydroxyethyl methacrylate and 90% tetraglyme created a nonfouling surface that was subsequently decorated with the YRGDS peptide. NHDFs were shown to have exhibited decreased type I collagen production in comparison to NHDF cells on unmodified Nafion™ surfaces. Here, the authors report evidence that proves that optimizing conditions to prevent protein adsorption and enhance cellular adhesion may eliminate fibrous encapsulation of an implant.
I. INTRODUCTION
One of the main obstacles for the long-term implantation of some medical devices is the creation of a fibrotic capsule around the implant-tissue interface of the device. This dense, collagenous capsule is not detrimental to some devices, but drastically limits the function of implantable biosensors, which are dependent on the influx of analytes to or from the surface. Increasing the lifetime of an implantable glucose biosensor, for example, would be quite advantageous for diabetic patients, decreasing their chances of related complications, such as blindness, kidney failure, heart disease, among others.1,2
In the development of a fully implantable glucose sensor, several different types of membrane materials have been utilized, including polytetrafluoroethylene,3–10 polyvinyl-chloride,11–17 cellulose or cellulose acetate,15,17–29 and polyurethane.8,28,30–41 Included in this list is the use of the perfluorinated ionomer, Nafion™ (Dupont, Inc.). Nafion™ is a perfluorinated ionomer, and as such, is highly ion conductive and can function as a cation exchange polymer. In addition, like Teflon, Nafion™ is extremely resistant to chemical attack. For a glucose sensor, Nafion™ serves four purposes, namely, (a) to reject negative molecules; (b) to physically protect the glucose oxidase enzyme that drives the chemical reaction of the biosensor (acting as a physical barrier); (c) to act as a glucose transport-limiting membrane, thereby reducing the oxygen requirement of the biosensor; and (d) to maintain some level of biocompatibility, especially after curing the Nafion™ membrane.42, 43 As has been stated in literature, when comparing materials for the construction of glucose biosensors, Nafion™ based glucose sensor provides the best long term response stability.17 There are numerous publications that utilize Nafion™ in the design of a glucose biosensor and the most recent publications are listed.44–93
Like other coatings, however, Nafion™ is subject to the changes that occur in the subcutaneous tissues once an implant is in place. The cascade of events leading to fibrosis has been described previously.94 Briefly, after protein adhesion and the start of the acute inflammatory stage, chronic inflammation begins typically approximately 3–5 days after implantation. For a subcutaneous device, such as a biosensor, skin fibroblasts begin to secrete chronic inflammatory cytokines, the most abundant having been found to be TGFβ–1.95 Once exposed to TGFβ, myofibroblasts will differentiate from quiescent fibroblasts, and the production of type I collagen begins. Type I collagen is the most prominent component of fibrotic tissue and has been shown to be a main component of what is known as the “foreign body reaction.”
Various surface modification strategies have been utilized in an attempt to modulate the inflammatory response. One attempt has been to eliminate surface “fouling” or the random and unlimited adsorption of proteins to a surface. To this end, one of the most prominent techniques has been the use of polyethylene glycol (PEG) coated surfaces as detailed in Refs. 96–100 to name a few. Although PEG is effective in preventing nonspecific protein adsorption, its nonfouling character is dependent on the surface chain density and can be subject to damaged by oxidants.101 The use of plasma deposition of ethylene glycol dimethyl ether or “oligogly-mes” has been shown as an alternative to materials that utilize PEG in their design.102,103 Although these strategies have been shown to be effective in vitro, studies have shown that after 4 weeks of implantation, fibrous capsules around coated and uncoated implants were virtually the same.104,105
Research in the area of biologically active surfaces has included much work with the ubiquitous peptide sequence, arginine-glycine-aspartic acid or RGD, as it is known for its properties for cell adhesion. The RGD site has been identified in many extracellular matrix proteins, including vitronectin, fibrinogen, collagen, laminin, osteopontin, and tanascin, and is known to bind to approximately half of all identified integrins.106 Little research has been done in the use of a plasma method to functionalize surfaces. In particular, little research has been conducted to modulate the fibroblast response.
In a previous publication, we detailed the surface modification of the perfluorinated ionomer, Nafion™. Briefly, by using a radio frequency glow discharge deposition (RFGDD) method, surfaces were modified by using a combination of two monomers, thereby creating a new surface able to prevent random protein adsorption and concomitantly be reactive enough to display a biologically active peptide.44 This goal was accomplished by mixing (1) tetraethylene glycol dimethyl ether (tetraglyme) and (2) 2-hydroxyethyl methacrylate (HEMA) at different ratios. The first monomer provided a nonfouling base, and the second monomer provided the reactive hydroxyl groups that were necessary for the subsequent chemical attachment of the YRGDS peptide, a known cell adhesion ligand. In this article, we detail the cellular response to these surfaces; metrics used included cell viability, spreading, engagement of integrin receptors, and type I collagen synthesis.
II. MATERIALS AND METHODS
A. Preparation of surface coatings and surface analysis
Details of the synthesis of surfaces can be found in Ref. 44. Plasma polymerization, or polymerization initiated by a partially ionized gas generated by the RFGDD method, is widely used for preparing coatings and insulating layers.107
Several variations of surface coatings were created using two base monomers individually or by combining the two at different concentrations. They were (1) tetraethylene glycol dimethyl ether (tetraglyme, Aldrich Catalog No. 172405), known for its nonfouling characteristics,102 and (2) HEMA (PolySciences Inc., ophthalmic grade),108 known for its bio-compatibility and available reactive hydroxyl groups. Combinations used were as follows: pure tetraglyme, 2.5% HEMA with 97.5% tetraglyme; 5% HEMA with 95% tetraglyme, 10% HEMA with 90% tetraglyme; and pure HEMA. Once prepared, surfaces were evaluated for the degree to which they were able to repel serum proteins, such as albumin and fibronectin. Surfaces were then characterized for their hydroxyl group content and were assessed for their ability to covalently bind a biological peptide, YRGDS. Method details are outlined elsewhere.44 Briefly, the peptide was radiolabeled using the Iodobead™ method and was covalently bound to available surface hydroxyl groups using 1,1'-carbonyldiimidazole (CDI) (Sigma) in anhydrous acetone. Once bound, YRGDS bound peptide was quantified via a gamma counter and YRGDS peptide linked to modified Nafion™ surfaces was calculated (ng/cm2).44 It was observed that the 10% HEMA, 90% tetraglyme modified surfaces provided the lowest protein adsorption with a sufficient amount of available hydroxyl groups. In addition, 10% HEMA surfaces were found to exhibit the most cell spreading (see details below). Therefore, all cellular experiments reported here were carried out on either 10% HEMA–90% tetraglyme surfaces or unmodified Nafion™ and compared to various control surfaces (tissue culture surfaces).
B. Adhesion assays to Nafion™ and modified Nafion™ materials
NHDFs (Cambrex Inc., Catalog No. 2511) were grown on T75 flasks (Corning). Low glucose Dulbecco's modified Eagle's medium was made from powder (Sigma Catalog No. D-2902 (no phenol red) or D-5523 (with phenol red dye)] and supplemented with 1%/streptomycin and 3.7 g/l of sodium bicarbonate. The pH of the medium was 7.2 and was maintained constant with (4–(2-hydroxyethyl)–1-piperazineethanesulfonic acid buffer (Invitrogen Inc.), which was added to the medium at a final concentration of 20 mM. The medium was sterilized by filtration (0.2 μm filter, Stericups, Millipore) and then supplemented with 10% fetal bovine serum (FBS), as needed to grow the cells. Following sterilization under an UV light for 10 min, custom chambers containing Nafion™, tetraglyme-coated Nafion™, or tetraglyme-HEMA coated Nafion™ were exposed to either (1) a protein solution containing bovine serum albumin (100 μg/ml), (2) a protein solution containing fibronectin (100 μg/ml), (3) a 10% serum solution in low glucose media, or (4) were covalently decorated with the YRGDS peptide, as discussed in Ref. 44.
After 24 h, surfaces were rinsed three times with sterile phosphate buffered saline (PBS) (pH=7.2) and NHDF cells were concentration of 10 000 cells/cm2 in the custom chambers for a period of either 4 or 24 h (for unmodified Nafion™ as well as TCPS) and for 24 h for modified surfaces (tetraglyme and YRDGS-decorated surfaces). Cell concentrations were quantified on various surfaces via the use of an epifluo-rescence microscope (Zeiss, Inc.) (10× objective). To clearly visualize NHDF cells, the dual Live/Dead™ stain system (L3224 Molecular Probes, Inc.), consisting of SYTO 10 (green fluorescent nucleic acid “Live” stain) and ethidium homodimer-2 (red fluorescent nucleic acid “dead” stain), was used. Direct visualization of Live/Dead™ stained cells allowed a direct cell count enumeration and an estimate of the area of cell spreading. Photographs were taken of at least 3 spots on one well (4 wells/membrane, on two membranes per surface type) using a charge coupled device camera and MAGNAFIRE image capture software. Adhesion of cells was then analyzed for statistical differences between groups [using a two-factor a one-way analysis of variance (ANOVA)] in the unmodified surfaces and between groups in the modified surfaces. In addition, a single unmodified group (10% serum group) and a single modified group (10% HEMA) were compared to check for statistical differences between the number of cells adhered.
C. Immunocytochemistry for actin and paxillin
The ability of cells to sense and respond appropriately to changes in their immediate external environment is dictated by the engagement of cell integrin receptors to an adhesion ligand. Changes in the Nafion™ substrate may lead to changes in cell signaling mechanisms that can be examined by immunocytochemical techniques. Two relevant intracellular proteins were chosen: actin microfilaments and paxillin. Actin, a 43 kD protein, is the most abundant protein in typical eukaryotic cells, accounting for approximately 15% of total protein. Actin filaments are typically associated with the formation of the cytoskeleton. Paxillin, a 68 kD protein, is an “adaptor” protein that facilitates optimal signal transduction through its ability to recruit multiple intermediates of specific signaling pathways to specific regions within the cell.109 Once these are recruited, proper signaling mechanisms can alter complex events within cells, such as changes in gene expression and reorganization of the cytoskeleton.
Three types of surfaces were examined, namely, a control surface–tissue culture chamber slide (TCCS) (Nunc, Inc.), an unmodified Nafion™ surface, and a 10% HEMA modified Nafion™ surface. Unmodified Nafion™ and TCCS received an overnight 10% serum treatment at 37 °C. Surfaces coated with 10% HEMA were further modified with YRGDS peptide, as outlined in Ref. 44. After rinsing surfaces with sterile PBS, a cell suspension was used to submerge the Nafion™ membranes; cell suspensions were designed to produce a plated concentration of 10 000 cells/cm2. Cells were left in contact with the surface samples for 24 h in a CO2 incubator at 37 °C in serum-free media. Cells were then fixed with a 2% paraformaldehyde solution, rinsed with PBS, blocked with a 10% FBS solution (in PBS), and incubated with a primary antibody prepared in 5% FBS in PBS for 1 h atroom temperature. Primary antibodies were anti-α-actin (Sigma, Catalog No. A2066) and anti-α-paxillin (BD Pharm-ingen Catalog No. 610051). Surfaces were then rinsed with PBS three times and incubated with a 5% FBS solution containing two different secondary antibodies. To visualize paxillin, a fluorescently labeled goat antimouse secondary antibody was chosen (Molecular Probes, AlexaFlour 594, A-11005). To stain for actin, a fluorescently labeled goat antirabbit secondary antibody was chosen (Molecular Probes, AlexaFlour 488, A11008). Images were collected using an epifluorescence Zeiss microscope (40× objective lens) and MAGNAFIRE image capture software. For actin, a fluorescein isothiocyanate filter (Abs = 495 nm; Em = 520 nm) was used. For paxillin, a Texas red filter was used (Abs = 583 nm; Em = 603). Single-color images were collected separately and then merged into one image using the MAGNAFIRE software.
D. Proliferation assays
Proliferation of NHDFs was carried out on three different surfaces: unmodified Nafion™ (with and without preadsorbed protein), 10% HEMA modified Nafion™, and a control surface, TCPS. Proliferation of NHDF on these surfaces was assessed via Cell Titer 96® Aqueous One Solution Cell Proliferation Assay (Promega, Inc.) or via direct visualization of unmodified Nafion™ surfaces using the Live/Dead stain and IMAGEJ as outlined above. The Cell Titer 96 assay is a colorimetric method, containing a tetrazolium compound [3–(4,5-dimethylthiazol-2-yl)–5-(3-carboxymethoxyphenyl)–2-(4-sulfophenyl)–2H-tetrazolium, inner salt; MTS (a)] and an electron coupling reagent [phenazine ethosulfate (PES)]. As described by the manufacturer, the MTS tetrazolium compound (Owen's reagent) is bioreduced by cells into a colored formazan product that is soluble in tissue culture medium. The PES was believed to interfere with unmodified Nafion™ surfaces since absorbance levels remained constant, despite a large number of cells on the surface (as verified by Live/ Dead stain).
Nafion™ surfaces were prepared as outlined above (unmodified with 10% serum or no other protein, or YRGDS-modified 10% HEMA surfaces). Control TCPS received no prior protein treatment. Fibroblast cells were plated at 20 000 cells/well (10 000 cells/cm2 in 500 μl) in phenol red-free media (containing 10% serum). Phenol red-free media were chosen to avoid any potential interference with the colorimetric change in the Cell Titer assay. 4 h after plating (day 0), two wells per surface type received 100 μ1 of Cell Titer assay and were returned to 37 °C for 1 h. Contents of each well's cell suspension were transferred to standard 24-well plates and read using a fluorescent plate reader at 490 nm wavelength. Exactly 24 h later, the medium in each remaining well was replaced with fresh, serum-free medium and Cell Titer 96 was added. This step ensured that evaporation of the medium was minimized and that assays were performed on a full 500 μ1 to correspond to the standard calibration. This process was repeated again until day 4. Cell Titer 96 assay absorbance values were correlated with cell numbers using a standard curve, made with serum-free media, using the same type of TCPS plate (Falcon, BD). A similar procedure was carried out with unmodified Nafion™ surfaces, except that cells were counted using the Live/Dead stain.
E. Quantification of type I collagen
Quantification of type I collagen was carried out because it is known to be the main component of a fibrotic capsule that eventually surrounds an implant. Collagen synthesis has been found to increase in renal fibroblasts in the presence of IL-1 (Ref. 110) and ascorbic acid.111,112 Thus, in order to discern if differences in surface chemistry would modulate the synthesis of collagen, cells on unmodified and 10% HEMA modified Nafion™ were supplemented with IL-1, ascorbic acid, glucose oxidase, lipopolysaccharide (LPS), H2O2, or were left “blank,” indicating no serum was added to the cell culture medium.
Enzyme linked immunosorbent assay (ELISA) assays for the procollagen molecule was performed using the Metra® CICP (Quidel Corp.) assay. Collagen, a triple-helical molecule that forms the fibrous framework of all connective tissues, is synthesized as procollagen, a larger precursor molecule. Procollagen consists of mature collagen with extension peptides at both the amino and the carboxy termini. These extension peptides, or “propeptides,” are cleaved from the collagen molecule by specific proteases prior to the incorporation of collagen into a growing collagen fibril. The release of these peptides into the cell culture media provides a stoichiometric representation of the production of collagen in a cell culture environment.
Unmodified Nafion™ and 10% HEMA modified Nafion™ surfaces were prepared and placed in fabricated six well plates. Surfaces were then either (a) incubated with a 10% serum (in media) solution overnight (for unmodified Nafion™) or (b) reacted with 200 μg/ ml YRGDS via CDI chemistry, as previously explained.44 The next day, cells were plated in two replicate wells at a density of 20 000 cells/well for the unmodified Nafion™ samples or 90 000 cells/well on YRGDS-modified surfaces (1% serum solution in the medium). 24 h later, wells were rinsed twice with PBS, and the serum-free medium was added to make the cells quiescent. The following day, the procollagen “test” assay medium was added. Table I summarizes all substances added to cells on the different substrates and their respective concentrations. Prior to performing these experiments, the toxicity of all agents was tested at various concentrations and no change in the cell number was observed.
Table I.
Biosensor by-products tested in the culture media for collagen type I synthesis.
Once the cells were exposed to control or test medium for 24 h, certain cell culture supernatants were collected and frozen at –80 °C until the ELISAs were carried out. Cells still in culture wells were then quantified using either the Cell Titer 96 assay (Promega) or counted directly by staining with Live/Dead stain (Molecular Probes, Invitrogen Corp.). In this way, ELISA assays can be reported on a proprotein “per cell” basis, tracking exactly the amount of extracellular protein produced per fibroblast cell. Briefly, the medium from control wells or wells with Nafion™ samples was placed in the Metra® CICP type I collagen assay (sandwich ELISA), with the preadsorbed capture antibody for 1 h. Plates were washed with the provided reagents and incubated with a second detection antibody. Provided reagents were added according the manufacturer's directions. ELISA plates were read on a fluorimeter plate reader (Abs = 405 nm).
III. RESULTS AND DISCUSSION
Cells were quantified on Nafion™ and modified Nafion™ surfaces. Adhesion assays were instrumental in determining the number of cells per cm2 that adhered to the different Nafion™ substrata, the viability/survival of the cells on the substrata, and degree of cell spreading. Figure 1 shows the average number of adherent cells per area (cm2) on unmodified Nafion™ surfaces. Each bar graph represents the average of eight wells (as made in a custom chamber). These data are for the total adherent cells, both live and dead. Cells attached after 4 h to Nafion™ pretreated with either 10% serum or fibronectin were 8259 and 8730 cells/ cm2, respectively. Similar values were seen after 24 h of plating. This was not a surprising result, as fibronectin is rich with adhesive peptides such as RGD. Serum contains fibronectin as well as vitronectin. Bovine serum albumin, on the other hand, adhered 1602 cells/cm2 4 h after plating and 5248 cells/cm2 after a 24 h period. Control surfaces (TCPS) attached ∼5000 cells/cm2 after 4 h and ∼9000 cells/cm2 after 24 h.
Fig. 1.
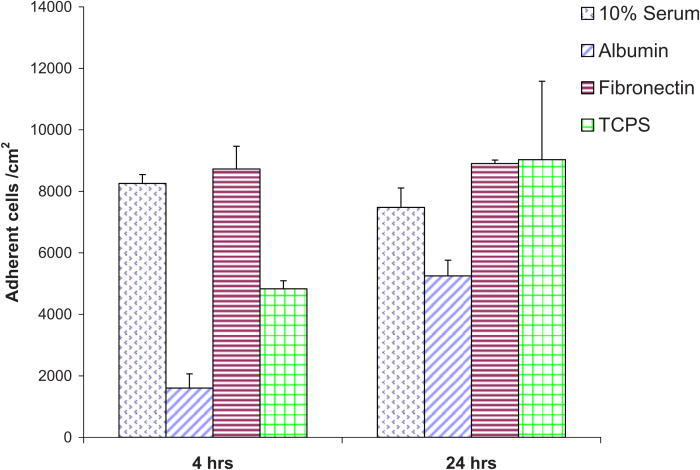
Adherent NHDF cells (per cm2) on unmodified Nafion™ surfaces preadsorbed with various proteins.
Adherent cells were examined for their viability as a function of the different proteins pre-exposed to the Nafion™ membranes (Table II). At either 4 or 24 h, the viability was greatest on the Nafion™ membranes pre-exposed to fibronectin, followed by albumin and 10% serum. Untreated TCPS exhibited the lowest viability.
Table II.
Viability of cells adhered to unmodified Nafion™ surfaces via different proteins.
| Protein | 4h | 24 h | |||
|---|---|---|---|---|---|
| % Live | % Dead | % Live | % Dead | ||
| Fibronectin | 96.8 ± 0.63 | 1.37 ± 0.64 | 99.37 ± 0.12 | 0.63 ± 0.12 | |
| Albumin | 96.3 ± 2.4 | 3.72 ± 2.40 | 77.31 ± 4.61 | 12.02 ± 4.41 | |
| 10% serum | 96.8 ± 0.47 | 3.25 ± 0.47 | 92.95 ± 3.37 | 5.83 ± 3.97 | |
| TCPS (no protein) | 89.47 ± 3.18 | 10.53 ± 3.17 | 85.78 ± 1.80 | 14.22 ± 1.80 | |
Figure 2 shows the typical morphology of NHDF at a 4 and 24 h time point. At the 4 h time period, we note a marked increase in cell numbers on surfaces preadsorbed with 10% serum as opposed to albumin preadsorbed surfaces. After 24 h, we note no differences from the 4 h data in the morphology of cells plated on surfaces preadsorbed with albumin. Cells plated on both fibronectin exposed Nafion™ surfaces and untreated TCPS assumed a longer shape in comparison to cells on Nafion™ surfaces preadsorbed with 10% serum. The degree to which NHDF spread on was calculated using IMAGEJ. Figure 3 displays the area of cell spreading on Nafion™ surfaces preadsorbed with different proteins as well as untreated TCPS. Cells plated on Nafion™ preadsorbed with 10% serum had an average spread area approximately four times greater than that of cells plated on Nafion™ preadsorbed with albumin. There is a decrease in the area of cell spreading from 4 to 24 h on surfaces preadsorbed with fibronectin and on TCPS, as can be seen in Fig. 2.
Fig. 2.
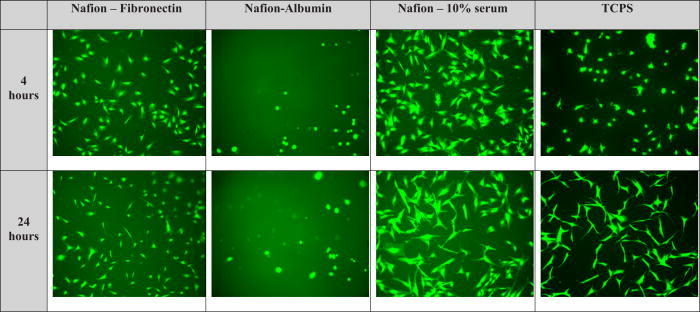
Typical cellular morphologies for NHDF on unmodified Nafion™ surfaces and TCPS.
Fig. 3.
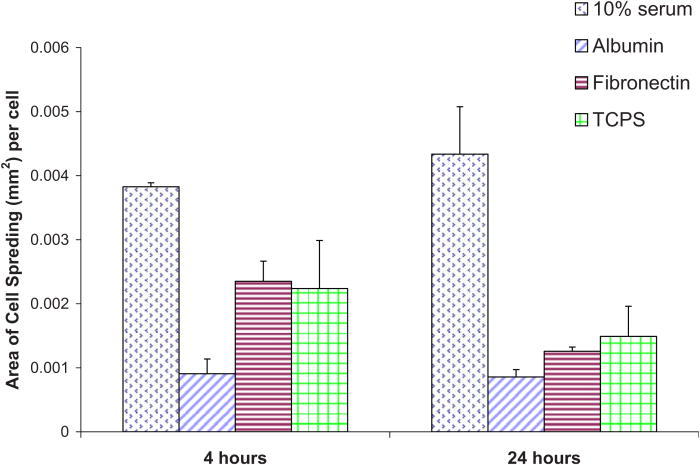
Area of NHDF spreading quantified on unmodified Nafion™ surfaces preadsorbed with various proteins.
Adhesion assays were also carried out on the modified Nafion™ surfaces. These surfaces were prepared as outlined in Ref. 44 by covalently linking the YRGDS peptide via CDI chemistry. The amount of YRGDS on these surfaces was a function of the amount of bulk fluid (20 or 200 μg/ ml) and was also dependent on the amount of hydroxyl groups that were obtained from the mixing of tetraglyme and HEMA at different ratios, as described in Ref. 44. NHDFs were then plated onto YRGDS-modified Nafion™ surfaces at 10 000/cm2. Figure 4 shows the average number of cells adhering per cm2 to Nafion™ surfaces presenting increasing amounts of available hydroxyl groups and covalently decorated with YRGDS at two different surface densities. Regardless of YRGDS level used, more peptide should be coupled to the HEMA treated Nafion™ in a hydroxyl percent dependent trend. Yet, at the lower peptide concentration, NHDF cells attached in similar amounts on all HEMA treated Nafion™, except for pure HEMA modified surfaces, which showed lower adherent cell counts.
Fig. 4.
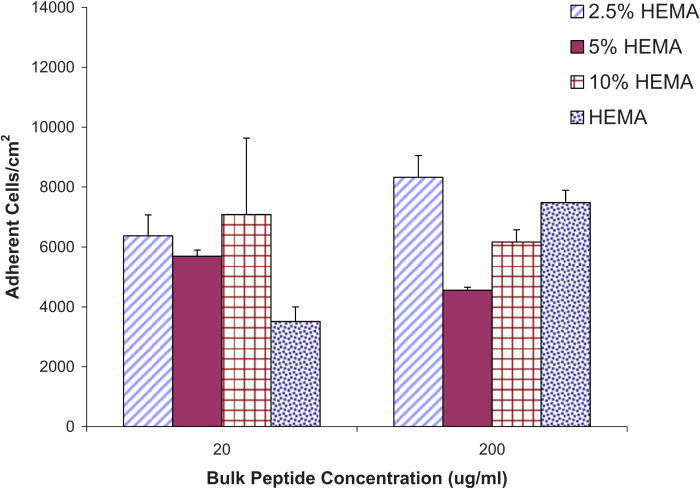
Adherent NHDF cells (per cm2) on various modified Nafion™ surfaces with two different bulk peptide concentrations (actual surface concentrations unknown; only bulk concentration reported; assumes a linear relationship).
At higher concentrations, the most adherence was seen on surfaces modified with 2.5% HEMA, and a gradual increase in adhesion was observed with increasing HEMA concentrations. ANOVA was conducted in order to discern any statistical differences between surfaces adhered with 10% HEMA versus surfaces modified with 2.5%, 5%, and pure HEMA for an adhesion period of 24 h and bulk peptide concentrations of 20 and 200 μg/ ml. The 10% HEMA surfaces were chosen for this analysis as they are the subject of subsequent tests described in this article (collagen synthesis ELISA, proliferation assays, etc.). The p-values obtained from the analysis of the 20 μg/ ml data indicate no statistically significant differences between 10% and 2.5% modified HEMA surface (p = 0.07), between 10% and 5% HEMA (p = 0.64), or between 10% HEMA and pure HEMA (p = 0.30). The p-values obtained from the analysis of the 200 μg/ ml data also indicated no statistically significant differences between 10% and 2.5% modified HEMA surface (p = 0.12), between 10% and 5% HEMA (p = 0.06), and a between 10% HEMA and pure HEMA (p = 0.15).
When comparing the values obtained between the lower and higher bulk peptide concentrations, we note that higher bulk peptide concentration does not always correlate with an increase in cell adhesion. For example, at the 200 μg/ ml bulk peptide concentration, 5% and 10% HEMA surfaces exhibit approximately a 20% and 13% decrease (respectively) in cells adhered/cm2 when comparing to adherent cells/cm2 at the lower peptide concentration. Surfaces modified with 2.5% HEMA and pure HEMA did not exhibit the same pattern but showed higher cell adhesion with higher bulk peptide concentration. Surfaces modified with 2.5% HEMA had a 23% increase in cell adhesion at 200 μg/ ml bulk peptide concentration and pure HEMA had 53% higher cell adhesion. Statistical analysis between all groups indicated no significant differences between any of the lower and higher peptide concentrations (p = 0.10).
To test the degree to which cells adhere to the modified surfaces on the 10% HEMA surfaces (which were chosen for subsequent experiments), cells were plated at increasing densities. Figure 5 shows adherent live/dead cells as a function of the cell seeding concentration. At all seeding densities, the majority of cells that did attach remained viable. At all seeding densities, about ∼50% of cells attach. Increasing the seeding to 200 000 cells/well) only increased the number of cells attached by 65%, but with a noted increase in the number of dead cells. Viability of cells plated on 10% HEMA modified Nafion™ and at the two different covalently bound peptide concentrations is given in Table III. From these data, we see high survival rates on all surfaces at both peptide concentrations (>88%–98% survival). The morphology of cells adhered to these HEMA treated-peptide presenting Nafion™ substrata was also assessed and quantified (Fig. 6).
Fig. 5.
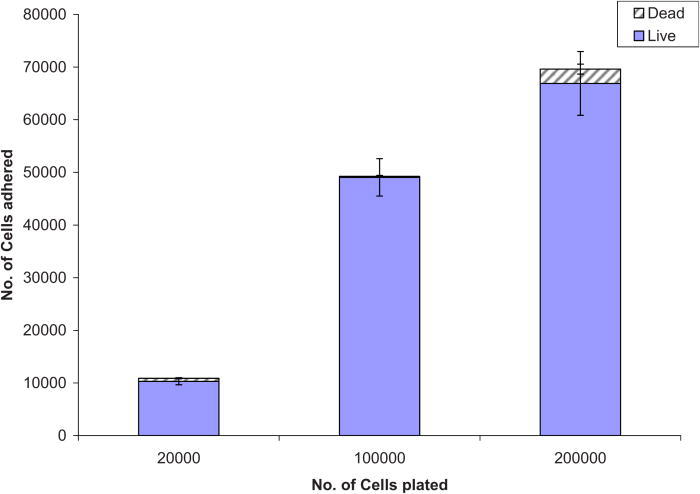
Cells adhered on 10% HEMA surfaces with 200 μg / ml YRGDS vs number of cells plated.
TABLE III.
Viability of cells (± standard error of the mean) adhered to various HEMA modified Nafion™ surfaces via YRGDS peptide at two different concentration (BC: bulk concentration).
| Surface | YRGDS (BC = 20 μg / ml) | YRGDS (BC = 200 μg / ml) | ||
|---|---|---|---|---|
| % Live | % Dead | % Live | % Dead | |
| 2.5% HEMA | 95.24 ± 3.2 | 4.76 ± 3.2 | 90.1 ± 6.37 | 8.19 ± 6.37 |
| 5% HEMA | 98.34 ± 1.6 | 1.65 ± 1.6 | 93.85 ± 5.8 | 6.14 ± 5.18 |
| 10% HEMA | 97.09 ± 0.56 | 2.91 ± 0.56 | 94.45 ± 0.59 | 5.55 ± 0.59 |
| HEMA | 88.78 ± 1.14 | 11.21 ± 0.57 | 97.43 ± 1.43 | 2.5 ± 1.43 |
Fig. 6.
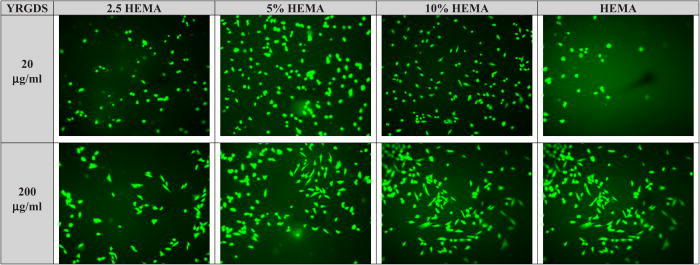
Typical cellular morphologies for NHDF on modified Nafion™ surfaces at two different concentrations of YRGDS. Cells were allowed to adhere for 24 h.
To better understand the degree of integrin engagement in the adhesion studies, the formation of actin cytoskeleton and the activation of paxillin in NHDF cells was measured by immunocytochemistry. As stated above, following cell adhesion experiments, surfaces were screened for optimal cell adhesion and spreading. Surfaces modified with 10% HEMA exhibited the least amount of protein adsorption but the most cell adhesion, a goal that was set at the start of the project (i.e., a nonfouling coating, able to have bioactive properties) at the lower, 20 μg/ml, peptide concentration. Figure 7 depicts immunocytochemistry experiments done on unmodified Nafion™, 10% HEMA modified Nafion™, and a control surface (tissue culture chamber slide-TCCS). The last row, termed “merged,” refers to the overlay of the two photographs. It can be discerned from these photographs that paxillin was clearly activated at the points of focal contact on all surfaces, but paxillin production was more pronounced on control surfaces. Control TCCS and unmodified Nafion™ surfaces preadsorbed with 10% serum saw the most spreading of cells, while surfaces containing the YRGDS peptide at 20 and 200 μg/ml concentrations spread less. A single-factor ANOVA was utilized to compare the spreading between 10% serum on unmodified surfaces versus all HEMA modified surfaces (at the 200 μg/ml peptide concentration). The results showed a significant decrease in spreading on HEMA modified surfaces (p = 3.5 × 10⁻⁶). Nevertheless, all surfaces caused the activation of paxillin protein, which indicated the binding or engagement of integrin receptors with the underlying extracellular matrix. The area of cell spreading on various modified Nafion™ surfaces was about 50% lower in comparison to unmodified Nafion™ surfaces preadsorbed with 10% serum (Fig. 3). We also note from Fig. 8 that there is an increase in cell spreading as the coupled peptide concentration increases, for all levels of HEMA treatment. This difference is statistically significant (p = 0.0007). So, in summary, the area of cell spreading that occurs in unmodified surfaces versus modified surfaces is significantly different. The area of cell spreading that occurs on modified surfaces is significantly higher on surface adsorbed with 200 μg/ ml versus 20 μg/ ml bulk peptide concentration.
Fig. 7.
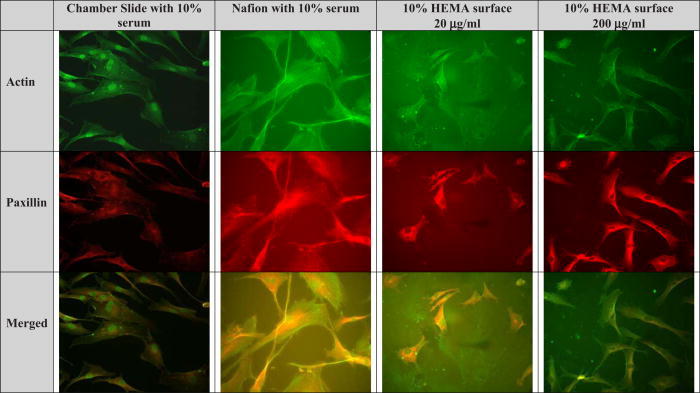
Immunocytochemistry of NHDF on various substrata. “Merged” refers to an overlay of actin and paxillin photographs.
Fig. 8.
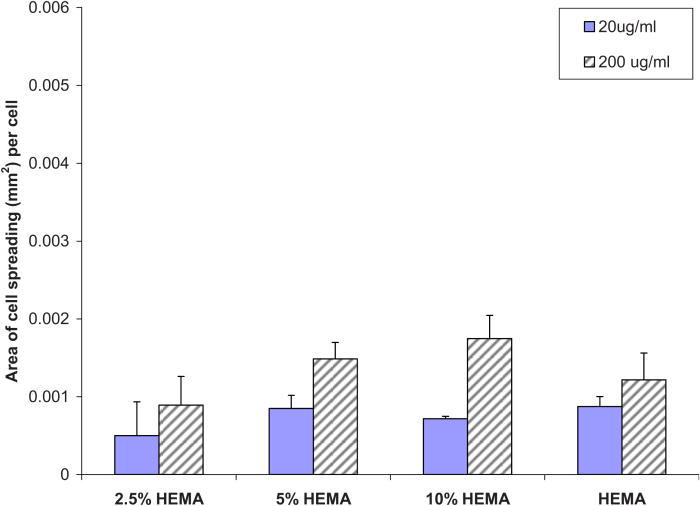
Area of cell spreading on various modified Nafion™ surfaces.
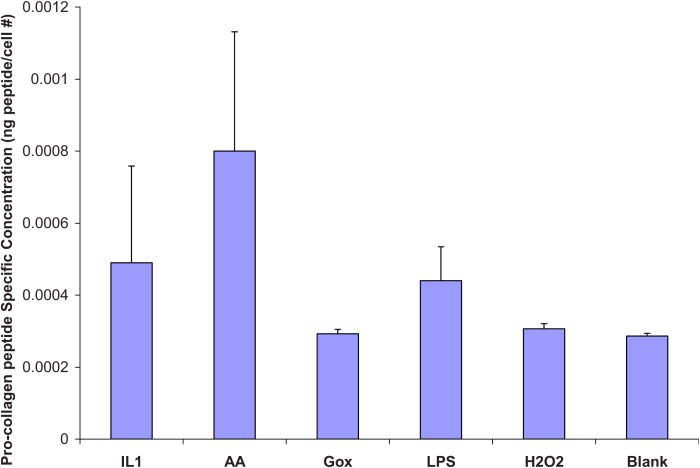
Proliferation assays were performed on unmodified Nafion™ surfaces (with and without preadsorbed protein), a 10% HEMA Nafion™ modified surface reacted with 200 μg/ ml YRGDS peptide (as this was seen to yield the highest cell adhesion numbers), and a control TCPS surface. The results of the proliferation assay, depicted in Fig. 9, show that all cells were able to proliferate well on the unmodified Nafion™ (with 10% preadsorbed serum) and on 10% HEMA modified Nafion™ surfaces, albeit not as efficiently as TCPS. Cells that were plated on Nafion™ without protein adhered minimally and exhibited no considerable proliferation. The Metra™ CICP procollagen peptide ELISA was used to quantify the amount of type I collagen being secreted by NHDF in response to Nafion™ on unmodified or modified surfaces and also as a result of possible biosensor chemical by-products. The assay was performed as previously outlined and data are presented below as procollagen peptides per cells (ng/cell) on the various surfaces. Figures 10 and 11 show collagen propeptide production from cells on the unmodified and modified Nafion™ surfaces, respectively (with a tenfold difference on the y-axis). For the most part, modified Nafion™ surfaces exhibited a tenfold decrease in the production of collagen molecules on a per cell basis. The area of cell spreading was also quantified on these surfaces. In comparison to unmodified Nafion™, there was a 40% reduction in cell spreading on 10% HEMA modified Nafion™ surfaces. These results, displayed in Fig. 12, are based on cells that were examined after 4 days of being in culture in blank serum-free media, which contained no extra additives.
Fig. 9.
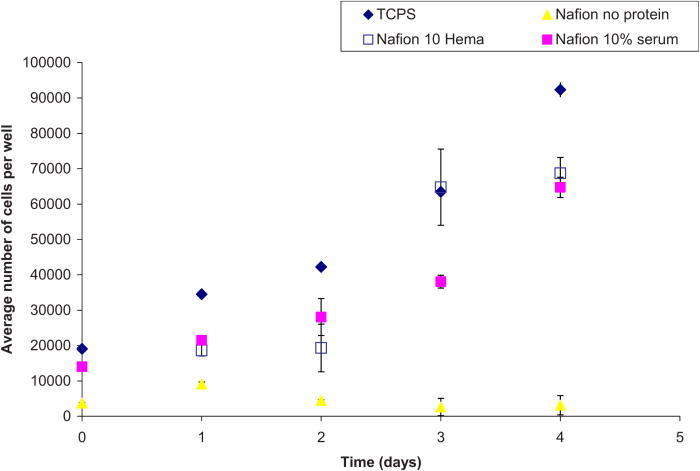
Proliferation assay for NHDF on various Nafion™ surfaces.
Fig. 10.
Procollagen ELISA on unmodified Nafion™ surfaces. Results reported as procollagen peptides per cell. Blank refers to serum-free media.
Fig. 11.
Procollagen ELISA on 10% HEMA modified Nafion™ surfaces. Results reported as procollagen peptides per cell. There was no detectable collagen in Gox or H2O2 conditions. Blank refers to serum-free media.
Fig. 12.
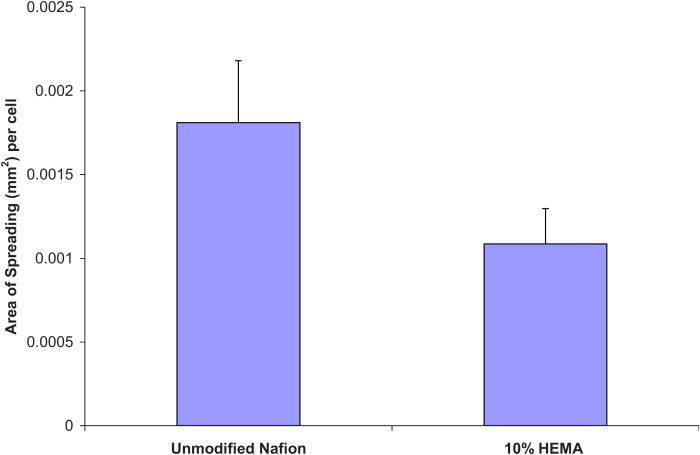
Area of cell spreading quantified after 4 days of being in culture in blank media.
In our previous work, the degree to which Nafion™ and modified Nafion™ surfaces adsorbed proteins was analyzed as a function of the Nafion™ surface chemistry. Results indicated that the least amount of proteins adsorbed onto surfaces that were “ether carbon” rich versus surfaces displaying hydroxyl groups on the surface, which are also known to be hydrophilic. Relating surface chemistry to cell behavior, we find that the amount and type of protein that adsorbs to the surface will dictate cell behavior. Once pretreated with a protein, such as fibronectin, or a 10% serum solution (both of which are known to adhere cells), unmodified Nafion™ surfaces were able to adhere cells in a comparable fashion as the control TCPS (∼9000 cells/cm2 for both surfaces). In addition, Nafion™ surfaces preadsorbed with protein were able to sustain the viability of NHDF, as well as provide a satisfactory substratum for cell proliferation. Tetraglyme surfaces that adhered proteins to a lower extent (protein mass/area) exhibited no cellular adhesion, as reported previously.105 Here, we observed that surfaces modified with 10% HEMA were not only able to maintain a nonfouling substratum but also contained functional hydroxyl groups. The 10% HEMA modified surfaces were also found to exhibit sufficient cell adhesion (6167 cells/ cm2) and the highest degree of cell spreading (0.002 mm2/cell at the 200 μg/ml bulk peptide concentration) versus other HEMA modified surfaces. For these reasons, 10% HEMA coated surfaces were examined more closely with proliferation assays, immunocytochemistry, and type I procollagen ELISAs.
The intent of the surface bound peptide sequence, YRGDS, was to attract cells to an otherwise nonfouling surface. Consequently, the number of YRGDS peptides per cell was calculated. First, the number of peptides per surface area was calculated based on the radiolabeled YRGDS. Ligands per cell were then calculated based on the area of cell spreading. Table IV tabulates the number of ligands estimated per cell. There was a tenfold increase in ligands attached to each cell as there was also a tenfold increase in the number of YRGDS molecules attached at the higher bulk protein concentration. The values obtained here are larger than the values obtained by Massia and Hubbell, in which a ligand cell density of 1.2 × 10⁴ was sufficient for integrin αvβ3-mediated fibroblast spreading and that 1.2 × 10⁵ was necessary for the formation of focal contacts and stress fibers.113 It should be noted that although the entire membrane was treated and the entire surface exposed to peptide, it cannot be estimated at this time whether or not complete, uniform surface coverage was reached. It was thought that the chances that a cell came in contact with a peptide on the surface were quite high. However, the affinity of the cell to the peptide was not measured as it was believed to be beyond the scope of this article. Cell affinity for the modified surfaces may be dependent on a host of parameters, namely, time and location of adhesion, interaction between cells, and cell physiology.
Table IV.
Calculated YRGDS molecules per cell for each of the modified surfaces (details provided in text).
| Bulk YRGDS-20 μg / ml | mole/μm2 | Area of cell (μm2/cell) | Ligands/cell |
|---|---|---|---|
| 2.5% HEMA | 3.21 × 10⁵ | 5.02 × 10² | 1.61 × 10⁸ |
| 5% HEMA | 5.63 × 10⁵ | 8.50 × 10² | 4.79 × 10⁸ |
| 10% HEMA | 3.02 × 10⁵ | 7.18 × 10² | 2.17 × 10⁸ |
| HEMA | 2.09 × 10⁶ | 8.75 × 10² | 1.83 × 10⁹ |
| Bulk YRGDS-200 μg / ml | mole/μm2 | Area of cell (μm2/cell) | Ligands/cell |
| 2.5% HEMA | 6.38 × 10⁶ | 8.93 × 10² | 5.69 × 10⁹ |
| 5% HEMA | 3.63 × 10⁶ | 1.49 × 10³ | 5.39 × 10⁹ |
| 10% HEMA | 3.08 × 10⁶ | 1.75 × 10³ | 5.38 × 10⁹ |
| HEMA | 8.21 × 10⁶ | 1.22 × 10³ | 9.99 × 10⁹ |
Modified Nafion™ surfaces displaying YRGDS peptide at different surface concentrations did not necessarily correlate with an increase in cell spreading. Figure 13 shows the relationship between cell spreading and the amount of peptide coupled to 2.5%, 5%, and 10% HEMA and pure HEMA surfaces. The y- and x-axes represent the average of cell spreading and the average amount of YRGDS peptide bound, respectively, and therefore no estimation of the standard error was carried out. A direct relationship is observed at lower peptide concentration, with a threshold value of approximately 0.45 nmol/cm2 (60–65 ng/cm2) YRDGS molecules linked at the surface for maximum cell spreading. However, at the higher bulk peptide concentration, there is an inverse relationship between cell spreading and peptide concentration for the 2.5%, 5%, and 10% HEMA modified surfaces. The same trend was not observed for surfaces that were coated with pure HEMA. For these modified surfaces, there appears to be an optimal concentration of bound peptide to promote maximum cell spreading, which is approximately at 0.55 nmoles/cm2 of YRGDS peptide.
Fig. 13.

Correlation between cell spreading and linked YRGDS at the various modified Nafion™ surfaces.
Many studies have been conducted to understand how cell behavior is impacted by specific ligand-integrin interactions. In particular, changes in cell shape/morphology can dictate cell function by modulating integrin signaling pathways. As outlined by Boudreau and Jones,114 the blocking of the αvβ3 integrin has been found to result in the failure of endothelial cell proliferation and survival if the cells are prevented from acquiring a spread morphology. The authors postulated that cellular rounding leads to apoptosis due to decreased integrin ligation, alluding to a change in cell signaling, as was also found by Chen et al.115 A separate study, Chen et al. correlated the formation of focal adhesions (FAs) with the degree to which a cell spreads and proposed that FA assembly scales directly with cell spreading.116 Data presented here support this work, as it showed an apparent relationship between cell spreading and the synthesis of procollagen molecules. Ivarsson et al.117 found that the production of type I collagen in cultured human foreskin fibroblasts can be regulated by cell spreading and by induction with platelet derived growth factor (PDFG-BB). Their study found that type I collagen synthesis increased markedly in proportion to cell spreading. Their findings correlate well with the results presented here using Nafion™ and modified Nafion™ substrata.
IV. CONCLUSIONS
We found that type I collagen synthesis, known to be the main component of a fibrotic capsule, can be modulated by (as shown by a tenfold reduction) presenting cells with a (1) nonfouling substrata and (2) a bioactive peptide. This goal was accomplished via a plasma deposition method in which two monomers were combined, creating a bioactive stealth surface with tetraethylene glycol dimethyl ether (tetraglyme) and HEMA at predetermined ratios. Surfaces containing hydroxyl groups were covalently bound to a YRGDS peptide,44 and cell viability, spreading, and proliferation activation of focal contacts were quantified in addition to collagen synthesis. For the newly synthesized surfaces, there was an optimum amount of YRGDS peptide that induced an optimal degree of cell spreading, affirming that ligand density makes a difference in cell spreading, focal contact development, and subsequent cell signaling pathways, thereby altering cellular response.117 This work shows at least one potential strategy in the reduction of the fibrous capsule around implants, thereby extending implant lifetime and viability.
ACKNOWLEDGMENTS
The authors would like to thank the NIH/NIBIB for the financial support of this work (Grant No. 1R21 EB00987) and for support of TIV through a NIH minority supplement (Grant No. 3R21 EB00987-S1). Surface modifications were carried out under the auspices of the University of Washington Engineered Biomaterials Center (Grant No. NSF EEC 9529161). XPS surface analysis was carried out through NESAC/BIO under the support from NIH/NIBIB (Grant No. P41EB002027).
REFERENCES
- 1. Daniloff G. Y., Diabetes Technol. Ther. 1, 261 (1999) 10.1089/152091599317170. [DOI] [PubMed] [Google Scholar]
- 2. Heller A., Annu. Rev. Biomed. Eng. 1, 153 (1999) 10.1146/annurev.bioeng.1.1.153. [DOI] [PubMed] [Google Scholar]
- 3. Chung T. D., Jeong R. A., Kang S. K. and Kim H. C., Biosens. Bioelectron. 16, 1079 (2001) 10.1016/S0956-5663(01)00185-3. [DOI] [PubMed] [Google Scholar]
- 4. Yang H., Chung T. D., Kim Y. T., Choi C. A., Jun C. H. and Kim H. C., Biosens. Bioelectron. 17, 251 (2002) 10.1016/S0956-5663(01)00266-4. [DOI] [PubMed] [Google Scholar]
- 5. Kang S. K., Jeong R. A., Park S., Chung T. D. and Kim H. C., Anal. Sci. 19, 1481 (2003) 10.2116/analsci.19.1481. [DOI] [PubMed] [Google Scholar]
- 6. Wang J. and Musameh M., Anal. Chem. 75, 2075 (2003) 10.1021/ac030007+. [DOI] [PubMed] [Google Scholar]
- 7. Li C. M. and Cha C. S., Front. Biosci. 9, 3479 (2004) 10.2741/1495. [DOI] [PubMed] [Google Scholar]
- 8. Yang H., Kang S. K., Choi C. A., Kim H., Shin D. H., Kim Y. S. and Kim Y. T., Lab Chip 4, 42 (2004) 10.1039/b309899k. [DOI] [PubMed] [Google Scholar]
- 9. Hashimoto M., Sakamoto N., Upadhyay S., Fukuda J. and Suzuki H., Biosens. Bioelectron. 22, 3154 (2007) 10.1016/j.bios.2007.02.004. [DOI] [PubMed] [Google Scholar]
- 10. Chu M. et al., Biomed. Microdevices 11, 837 (2009) 10.1007/s10544-009-9300-1. [DOI] [PubMed] [Google Scholar]
- 11. Cha G. S., Liu D. and Meyerholl M. E., Anal. Chem. 63, 1666 (1991) 10.1021/ac00017a003. [DOI] [PubMed] [Google Scholar]
- 12. Fei J., Wu Y., Ji X., Wang J., Hu S. and Gao Z., Anal. Sci. 19, 1259 (2003) 10.2116/analsci.19.1259. [DOI] [PubMed] [Google Scholar]
- 13. Heineman W. R., Appl. Biochem. Biotechnol. 41, 87 (1993) 10.1007/BF02918535. [DOI] [PubMed] [Google Scholar]
- 14. Lin L., Xiao L. L., Huang S., Zhao L., Cui J. S., Wang X. H. and Chen X., Biosens. Bioelectron. 21, 1703 (2006) 10.1016/j.bios.2005.08.007. [DOI] [PubMed] [Google Scholar]
- 15. Tohda K. and Gratzl M., Anal. Sci. 22, 383 (2006) 10.2116/analsci.22.383. [DOI] [PubMed] [Google Scholar]
- 16. Yang S., Atanasov P. and Wilkins E., Biomed. Instrum. Technol. 29, 125 (1995). [PubMed] [Google Scholar]
- 17. Yu B., Moussy Y. and Moussy F., Front. Biosci. 10, 512 (2005) 10.2741/1547. [DOI] [PubMed] [Google Scholar]
- 18. Ballerstadt R., Lvans C., Gowda A. and McNichols R., J. Diabetes Sci. Technol. 1, 384 (2007). [DOI] [PMC free article] [PubMed] [Google Scholar]
- 19. Barsan M. M. and Brett C. M., Bioelectrochemistry 76, 135 (2009) 10.1016/j.bioelechem.2009.03.004. [DOI] [PubMed] [Google Scholar]
- 20. Eisele S., Ammon H. P., Kindervater R., Grobe A. and Gopel W., Biosens. Bioelectron. 9, 119 (1994) 10.1016/0956-5663(94)80102-9. [DOI] [PubMed] [Google Scholar]
- 21. Jawaheer S., White S. F., Rughooputh S. D. and Cullen D. C., Biosens. Bioelectron. 18, 1429 (2003) 10.1016/S0956-5663(03)00073-3. [DOI] [PubMed] [Google Scholar]
- 22. Jung S. K., Gorski W., Aspinwall C. A., Kauri L. M. and Kennedy R. T., Anal. Chem. 71, 3642 (1999) 10.1021/ac990271w. [DOI] [PubMed] [Google Scholar]
- 23. Kawanishi T., Romey M. A., Zhu R. C., Holody M. Z. and Shinkai S., J. Fluoresc. 14, 499 (2004) 10.1023/B:JOFL.0000039338.16715.48. [DOI] [PubMed] [Google Scholar]
- 24. Kenausis G., Chen Q. and Heller A., Anal. Chem. 69, 1054 (1997) 10.1021/ac961083y. [DOI] [PubMed] [Google Scholar]
- 25. Kim S., Rahman T., Senesac L. R., Davison B. H. and Thundat T., Scanning 31, 204 (2009). [DOI] [PubMed] [Google Scholar]
- 26. Tatsumi H., Katano H. and Ikeda T., Anal. Biochem. 357, 257 (2006) 10.1016/j.ab.2006.07.019. [DOI] [PubMed] [Google Scholar]
- 27. Tohda K. and Gratzl M., Anal. Sci. 22, 937 (2006) 10.2116/analsci.22.937. [DOI] [PubMed] [Google Scholar]
- 28. Ward W. K., Jansen L. B., Anderson L., Reach G., Klein J. C. and Wilson G. S., Biosens. Bioelectron. 17, 181 (2002) 10.1016/S0956-5663(01)00268-8. [DOI] [PubMed] [Google Scholar]
- 29. Zhang Y., Hu Y., Wilson G. S., Moatti-Sirat D., Poitout V. and Reach G., Anal. Chem. 66, 1183 (1994) 10.1021/ac00079a038. [DOI] [PubMed] [Google Scholar]
- 30. Jung S. K. and Wilson G. S., Anal. Chem. 68, 591 (1996) 10.1021/ac950424p. [DOI] [PubMed] [Google Scholar]
- 31. Kerner W., Kiwit M., Linke B., Keck F. S., Zier H. and Pleiffer E. F., Biosens. Bioelectron. 8, 473 (1993) 10.1016/0956-5663(93)80032-K. [DOI] [PubMed] [Google Scholar]
- 32. Koster M., Gliesche C. G. and Wardenga R., Appl. Lnviron. Microbiol. 72, 7063 (2006) 10.1128/AEM.00641-06. [DOI] [PMC free article] [PubMed] [Google Scholar]
- 33. Oh B. K., Robbins M. L., Nablo B. J. and Schoennsch M. H., Biosens. Bioelectron. 21, 749 (2005) 10.1016/j.bios.2005.01.010. [DOI] [PubMed] [Google Scholar]
- 34. Updike S. J., Shults M. C., Rhodes R. K., Gilligan B. J., Luebow J. O. and Heimburg D., ASAIO J. 40, 157 (1994). [PubMed] [Google Scholar]
- 35. Wang C., Yu B., Knudsen B., Harmon J., Moussy F. and Moussy Y., Biomacromolecules 9, 561 (2008) 10.1021/bm701102y. [DOI] [PubMed] [Google Scholar]
- 36. Ward W. K., Wilgus E. S. and Troupe J. E., Biosens. Bioelectron. 9, 423 (1994) 10.1016/0956-5663(94)90030-2. [DOI] [PubMed] [Google Scholar]
- 37. Yang S., Atanasov P. and Wilkins E., Ann. Biomed. Eng. 23, 833 (1995) 10.1007/BF02584482. [DOI] [PubMed] [Google Scholar]
- 38. Yang Y., Zhang S. F., Kingston M. A., Jones G., Wright G. and Spencer S. A., Biosens. Bioelectron. 15, 221 (2000) 10.1016/S0956-5663(00)00082-8. [DOI] [PubMed] [Google Scholar]
- 39. Yu B., Ju Y., West L., Moussy Y. and Moussy F., Diabetes Technol. Ther. 9, 265 (2007) 10.1089/dia.2006.0020. [DOI] [PubMed] [Google Scholar]
- 40. Yu B., Long N., Moussy Y. and Moussy F., Biosens. Bioelectron. 21, 2275 (2006) 10.1016/j.bios.2005.11.002. [DOI] [PubMed] [Google Scholar]
- 41. Ziegler M., Schlosser M., Abel P. and Ziegler B., Biomaterials 15, 859 (1994) 10.1016/0142-9612(94)90043-4. [DOI] [PubMed] [Google Scholar]
- 42. Florescu M. and CM A. B., Talanta 65, 306 (2005) 10.1016/j.talanta.2004.07.003. [DOI] [PubMed] [Google Scholar]
- 43. Moussy F., Jakeway S., Harrison D. J. and Rajotte R. V., Anal. Chem. 66, 3882 (1994) 10.1021/ac00094a007. [DOI] [PubMed] [Google Scholar]
- 44. Valdes T.I., Ciridon W., Ratner B. D. and Bryers J. D., Biomaterials 29, 1356 (2008) 10.1016/j.biomaterials.2007.11.035. [DOI] [PMC free article] [PubMed] [Google Scholar]
- 45. Zhao X., Jia H., Kim J. and Wang P., Biotechnol. Bioeng. 104, 1068 (2009) 10.1002/bit.22496. [DOI] [PubMed] [Google Scholar]
- 46. Yang L., Ren X., Tang F. and Zhang L., Biosens. Bioelectron. 25, 889 (2009) 10.1016/j.bios.2009.09.002. [DOI] [PubMed] [Google Scholar]
- 47. Wen D., Zou X., Liu Y., Shang L. and Dong S., Talanta 79, 1233 (2009) 10.1016/j.talanta.2009.05.025. [DOI] [PubMed] [Google Scholar]
- 48. Tseng T. F., Yang Y. L., Chuang M. C., Lou S. L., Galik M., Flechsig G. U. and Wang J., Electrochem. Commun. 11, 1819 (2009) 10.1016/j.elecom.2009.07.030. [DOI] [PMC free article] [PubMed] [Google Scholar]
- 49. Tan Y., Deng W., Ge B., Xie Q., Huang J. and Yao S., Biosens. Bioelectron. 24, 2225 (2009) 10.1016/j.bios.2008.11.026. [DOI] [PubMed] [Google Scholar]
- 50. Rakhi R. B., Sethupathi K. and Ramaprabhu S., J. Phys. Chem. B 113, 3190 (2009) 10.1021/jp810235v. [DOI] [PubMed] [Google Scholar]
- 51. Qiu B., Lin Z., Wang J., Chen Z., Chen J. and Chen G., Talanta 78, 76 (2009) 10.1016/j.talanta.2008.10.067. [DOI] [PubMed] [Google Scholar]
- 52. Jeykumari D. R. and Narayanan S. S., J. Nanosci. Nanotechnol. 9, 5411 (2009) 10.1166/jnn.2009.1169. [DOI] [PubMed] [Google Scholar]
- 53. Gopalan A. I., Lee K. P., Ragupathy D., Lee S. H. and Lee J. W., Biomaterials 30, 5999 (2009) 10.1016/j.biomaterials.2009.07.047. [DOI] [PubMed] [Google Scholar]
- 54. Endo H., Yonemori Y., Hibi K., Ren H., Hayashi T., Tsugawa W. and Sode K., Biosens. Bioelectron. 24, 1417 (2009) 10.1016/j.bios.2008.08.038. [DOI] [PubMed] [Google Scholar]
- 55. Chen X. M., Cai Z. M., Lin Z. J., Jia T. T., Liu H. Z., Jiang Y. Q. and Chen X., Biosens. Bioelectron. 24, 3475 (2009) 10.1016/j.bios.2009.04.046. [DOI] [PubMed] [Google Scholar]
- 56. Antonelli M. L., Arduini F., Lagana A., Moscone D. and Siliprandi V., Biosens. Bioelectron. 24, 1382 (2009) 10.1016/j.bios.2008.07.084. [DOI] [PubMed] [Google Scholar]
- 57. Zou Y., Xiang C., Sun L. X. and Xu F., Biosens. Bioelectron. 23, 1010 (2008) 10.1016/j.bios.2007.10.009. [DOI] [PubMed] [Google Scholar]
- 58. Zhou M., Shang L., Li B., Huang L. and Dong S., Biosens. Bioelectron. 24, 442 (2008) 10.1016/j.bios.2008.04.025. [DOI] [PubMed] [Google Scholar]
- 59. Yu J., Yu D., Zhao T. and Zeng B., Talanta 74, 1586 (2008) 10.1016/j.talanta.2007.10.005. [DOI] [PubMed] [Google Scholar]
- 60. Suganuma S., Nakajima K., Kitano M., Yamagucm D., Kato H., Hayashi S. and Hara M., J. Am. Chem. Soc. 130, 12787 (2008) 10.1021/ja803983h. [DOI] [PubMed] [Google Scholar]
- 61. Shobha Jeykumari D. R. and Sriman Narayanan S., Biosens. Bioelectron. 23, 1404 (2008) 10.1016/j.bios.2007.12.007. [DOI] [PubMed] [Google Scholar]
- 62. Manesh K. M., Kim H. T., Santhosh P., Gopalan A. I. and Lee K. P., Biosens. Bioelectron. 23, 771 (2008) 10.1016/j.bios.2007.08.016. [DOI] [PubMed] [Google Scholar]
- 63. Lu J., Do I., Drzal L. T., Worden R. M. and Lee I., ACS Nano 2, 1825 (2008) 10.1021/nn800244k. [DOI] [PubMed] [Google Scholar]
- 64. Liu X., Shi L., Niu W., Li H. and Xu G., Biosens. Bioelectron. 23, 1887 (2008) 10.1016/j.bios.2008.02.016. [DOI] [PubMed] [Google Scholar]
- 65. Jia W. Z., Hu Y. L., Song Y. Y., Wang K. and Xia X. H., Biosens. Bioelectron. 23, 892 (2008) 10.1016/j.bios.2007.09.008. [DOI] [PubMed] [Google Scholar]
- 66. Jeykumari D. R. and Narayanan S. S., Biosens. Bioelectron. 23, 1686 (2008) 10.1016/j.bios.2008.02.001. [DOI] [PubMed] [Google Scholar]
- 67. Hervás Pérez J. P., López-Cabarcos E. and López-Ruiz B., Talanta {75}, 1151 (2008) 10.1016/j.talanta.2008.01.030. [DOI] [PubMed] [Google Scholar]
- 68. Chai B. H., Zheng J. M., Zhao Q. and Pollack G. H., J. Phys. Chem. A 112, 2242 (2008) 10.1021/jp710105n. [DOI] [PubMed] [Google Scholar]
- 69. Zou Y., Sun L. X. and Xu F., Biosens. Bioelectron. 22, 2669 (2007) 10.1016/j.bios.2006.10.035. [DOI] [PubMed] [Google Scholar]
- 70. Zhao Z. W., Chen X. J., Tay B. K., Chen J. S., Han Z. J. and Khor K. A., Biosens. Bioelectron. 23, 135 (2007) 10.1016/j.bios.2007.03.014. [DOI] [PubMed] [Google Scholar]
- 71. Zhang N., Wilkop T., Lee S. and Cheng Q., Analyst (Cambridge, U.K.) 132, 164 (2007) 10.1039/b611357e. [DOI] [PubMed] [Google Scholar]
- 72. Zhang M., Mullens C. and Gorski W., Anal. Chem. 79, 2446 (2007) 10.1021/ac061698n. [DOI] [PMC free article] [PubMed] [Google Scholar]
- 73. Yang Y. L., Tseng T. F. and Lou S. L., Conf. Proc. IEEE Eng. Med. Bio. Soc. 2007, 6625 (2007). [DOI] [PubMed] [Google Scholar]
- 74. Yan Y., Su L. and Mao L., J. Nanosci. Nanotechnol. 7, 1625 (2007) 10.1166/jnn.2007.346. [DOI] [PubMed] [Google Scholar]
- 75. Wu L., Zhang X. and Ju H., Biosens. Bioelectron. 23, 479 (2007) 10.1016/j.bios.2007.06.009. [DOI] [PubMed] [Google Scholar]
- 76. Tsai Y. C. and Chien H. Y., J. Nanosci. Nanotechnol. 7, 1611 (2007) 10.1166/jnn.2007.344. [DOI] [PubMed] [Google Scholar]
- 77. Kong L. Q., Yang C., Qian Q. Y. and Xia X. H., Talanta 72, 819 (2007) 10.1016/j.talanta.2006.12.037. [DOI] [PubMed] [Google Scholar]
- 78. Rivas G. A., Miscoria S. A., Desbrieres J. and Barrera G. D., Talanta 71, 270 (2007) 10.1016/j.talanta.2006.03.056. [DOI] [PubMed] [Google Scholar]
- 79. Maalouf R., Chebib H., Saikali Y., Vittori O., Sigaud M. and Jaffrezic-Renault N., Biosens. Bioelectron. 22, 2682 (2007) 10.1016/j.bios.2006.11.003. [DOI] [PubMed] [Google Scholar]
- 80. Liu Q., Lu X., Li J. and Yao X., Biosens. Bioelectron. 22, 3203 (2007) 10.1016/j.bios.2007.02.013. [DOI] [PubMed] [Google Scholar]
- 81. Lee C. H., Wang S. C., Yuan C. J., Wen M. F. and Chang K. S., Biosens. Bioelectron. 22, 877 (2007) 10.1016/j.bios.2006.03.008. [DOI] [PubMed] [Google Scholar]
- 82. Kang X., Mai Z., Zou X., Cai P. and Mo J., Anal. Biochem. 363, 143 (2007) 10.1016/j.ab.2007.01.003. [DOI] [PubMed] [Google Scholar]
- 83. Cui H. F., Ye J. S., Zhang W. D., Li C. M., Luong J. H. and Sheu F. S., Anal. Chim. Acta 594, 175 (2007) 10.1016/j.aca.2007.05.047. [DOI] [PubMed] [Google Scholar]
- 84. Chu X., Duan D., Shen G. and Yu R., Talanta 71, 2040 (2007) 10.1016/j.talanta.2006.09.013. [DOI] [PubMed] [Google Scholar]
- 85. Chen X., Yan X., Khor K. A. and Tay B. K., Biosens. Bioelectron. 22, 3256 (2007) 10.1016/j.bios.2007.01.006. [DOI] [PubMed] [Google Scholar]
- 86. Ahmad F., Christenson A., Bainbridge M., Yusof A. P. and Ab Ghani S., Biosens. Bioelectron. 22, 1625 (2007) 10.1016/j.bios.2006.07.025. [DOI] [PubMed] [Google Scholar]
- 87. Zhao S., Zhang K., Bai Y., Yang W. and Sun C., Bioelectrochemistry 69, 158 (2006) 10.1016/j.bioelechem.2006.01.001. [DOI] [PubMed] [Google Scholar]
- 88. Xian Y., Hu Y., Liu F., Wang H. and Jin L., Biosens. Bioelectron. 21, 1996 (2006) 10.1016/j.bios.2005.09.014. [DOI] [PubMed] [Google Scholar]
- 89. Schuvailo O. M., Soldatkin O. O., Lefebvre A., Cespuglio R. and Soldatkin A. P., Anal. Chim. Acta 573-574, 110 (2006) 10.1016/j.aca.2006.03.034. [DOI] [PubMed] [Google Scholar]
- 90. Miscoria S. A., Desbrieres J., Barrera G. D., Labbe P. and Rivas G. A., Anal. Chim. Acta 578, 137 (2006) 10.1016/j.aca.2006.06.060. [DOI] [PubMed] [Google Scholar]
- 91. Matsumoto T., Saito S. and Ikeda S., J. Biotechnol. 122, 267 (2006) 10.1016/j.jbiotec.2005.09.001. [DOI] [PubMed] [Google Scholar]
- 92. Lopez M. S., Mecerreyes D., Lopez-Cabarcos E. and Lopez-Ruiz B., Biosens. Bioelectron. 21, 2320 (2006) 10.1016/j.bios.2006.02.019. [DOI] [PubMed] [Google Scholar]
- 93. Heller A., Anal. Bioanal. Chem. 385, 469 (2006) 10.1007/s00216-006-0326-4. [DOI] [PubMed] [Google Scholar]
- 94. Diegelmann R. F. and Evans M. C., Front. Biosci. 9, 283 (2004) 10.2741/1184. [DOI] [PubMed] [Google Scholar]
- 95. Li A. G., Quinn M. J., Siddiqui Y., Wood M. D., Federiuk I. F., Duman H. M. and Ward W. K., J. Biomed. Mater. Res. Part A 82A, 498 (2007) 10.1002/jbm.a.31168. [DOI] [PubMed] [Google Scholar]
- 96. Benoit D. S. and Anseth K. S., Acta Biomater. 1, 461 (2005) 10.1016/j.actbio.2005.03.002. [DOI] [PubMed] [Google Scholar]
- 97. Blümmel J., Perschmann N., Aydin D., Drinjakovic J., Surrey T., Lopez-Garcia M., Kessler H. and Spatz J. P., Biomaterials 28, 4739 (2007) 10.1016/j.biomaterials.2007.07.038. [DOI] [PubMed] [Google Scholar]
- 98. Chen H., Brook M. A., Chen Y. and Sheardown H., J. Biomater. Sci., Polym. Ed. 16, 531 (2005) 10.1163/1568562053700183. [DOI] [PubMed] [Google Scholar]
- 99. Chen H., Zhang Z., Chen Y., Brook M. A. and Sheardown H., Biomaterials 26, 2391 (2005) 10.1016/j.biomaterials.2004.07.068. [DOI] [PubMed] [Google Scholar]
- 100. Porjazoska A., Yilmaz O. K., Baysal K., Cvetkovska M., Sirvanci S., Ercan F. and Baysal B. M., J. Biomater. Sci., Polym. Ed. 17, 323 (2006) 10.1163/156856206775997296. [DOI] [PubMed] [Google Scholar]
- 101. Ratner B. D. and Bryant S. J., Annu. Rev. Biomed. Eng. 6, 41 (2004) 10.1146/annurev.bioeng.6.040803.140027. [DOI] [PubMed] [Google Scholar]
- 102. Löpez G. P., Ratner B. D., Tidwell C. D., Haycox C. L., Rapoza R. J. and Horbett T. A., J. Biomed. Mater. Res. 26, 415 (1992) 10.1002/jbm.820260402. [DOI] [PubMed] [Google Scholar]
- 103. Johnston E. E., Bryers J. D. and Ratner B. D., Langmuir 21, 870 (2005) 10.1021/la036274s. [DOI] [PubMed] [Google Scholar]
- 104. Shen M., Martinson L., Wagner M. S., Castner D. G., Ratner B. D. and Horbett T. A., J. Biomater. Sci., Polym. Ed. 13, 367 (2002) 10.1163/156856202320253910. [DOI] [PubMed] [Google Scholar]
- 105. Shen M., Pan Y. V., Wagner M. S., Hauch K. D., Castner D. G., Ratner B. D. and Horbett T. A., J. Biomater. Sci., Polym. Ed. 12, 961 (2001) 10.1163/156856201753252507. [DOI] [PubMed] [Google Scholar]
- 106. Hersel U., Dahmen C. and Kessler H., Biomaterials 24, 4385 (2003) 10.1016/S0142-9612(03)00343-0. [DOI] [PubMed] [Google Scholar]
- 107. Stevens M. P., Free Radical Polymerization Polymer Chemistry: An Introduction (Oxford University Press, New York, 1999). [Google Scholar]
- 108. Lopez G. P., Ratner B. D., Rapoza R. and Horbett T. A., Macromolecules 26, 3247 (1993) 10.1021/ma00065a001. [DOI] [Google Scholar]
- 109. Brown M. C. and Turner C. E., Physiol. Rev. 84, 1315 (2004) 10.1152/physrev.00002.2004. [DOI] [PubMed] [Google Scholar]
- 110. Vesey D. A., Cheung C., Cuttle L., Endre Z., Gobe G. and Johnson D. W., J. Lab. Clin. Med. 140, 342 (2002) 10.1067/mlc.2002.128468. [DOI] [PubMed] [Google Scholar]
- 111. Levenson M. D. and Demetrious A. A., Metabolic Factors Wound Healing: Biochemical and Clinical Aspects, edited by Cohoen I. K., Diegelmann R. F. and Lindblad W. J. (Saunders, Philadelphia, 1992) p. 248. [Google Scholar]
- 112. Phillips C. and Wenstrup R., Biosynthetic and Genetic Disorders of Collagen Wound Healing: Biochemical and Clinical Aspects, edited by Cohoen I. K., Diegelmann R. F. and Lindblad W. J. (Saunders, Philadelphia, 1992) p. 152. [Google Scholar]
- 113. Massia S. P. and Hubbell J. A., J. Cell Biol. 114, 1089 (1991) 10.1083/jcb.114.5.1089. [DOI] [PMC free article] [PubMed] [Google Scholar]
- 114. Boudreau N. J. and Jones P. L., Biochem. J. 339, 481 (1999) 10.1042/0264-6021:3390481. [DOI] [PMC free article] [PubMed] [Google Scholar]
- 115. Chen C. S., Mrksich M., Huang S., Whitesides G. M. and Ingber D. E., Science 276, 1425 (1997) 10.1126/science.276.5317.1425. [DOI] [PubMed] [Google Scholar]
- 116. Chen C. S., Alonso J. L., Ostuni E., Whitesides G. M. and Ingber D. E., Biochem. Biophys. Res. Commun. 307, 355 (2003) 10.1016/S0006-291X(03)01165-3. [DOI] [PubMed] [Google Scholar]
- 117. Ivarsson M., McWhirter A., Borg T. K. and Rubin K., Matrix Biol. 16, 409 (1998) 10.1016/S0945-053X(98)90014-2. [DOI] [PubMed] [Google Scholar]