

Abstract
The mammalian accessory olfactory system is specialized for the detection of chemicals that identify kin and conspecifics. Vomeronasal sensory neurons (VSNs) residing in the vomeronasal organ project axons to the accessory olfactory bulb (AOB), where they form synapses with principal neurons known as mitral cells. The organization of this projection is quite precise and is believed to be essential for appropriate function of this system. However, how this precise connectivity is established is unknown. We show here that in mice the vomeronasal duct is open at birth, allowing external chemical stimuli access to sensory neurons, and that these sensory neurons are capable of releasing neurotransmitter to downstream neurons as early as the first postnatal day (P). Using major histocompatibility complex class I peptides to activate a selective subset of VSNs during the first few postnatal days of development, we show that increased activity results in exuberant VSN axonal projections and a delay in axonal coalescence into well defined glomeruli in the AOB. Finally, we show that mitral cell dendritic refinement occurs just after the coalescence of presynaptic axons. Such a mechanism may allow the formation of precise connectivity with specific glomeruli that receive input from sensory neurons expressing the same receptor type.
Introduction
The mammalian accessory olfactory system, consisting of the vomeronasal organ (VNO) and the accessory olfactory bulb (AOB), is involved in the identification of chemicals that signal the social and reproductive status of conspecifics (Dulac and Torello, 2003). Individual vomeronasal sensory neurons (VSNs) residing in the VNO bind chemical stimulants from the external environment and send axonal projections to the AOB that provide direct excitatory input to principal neurons called mitral cells. These cells are extraordinarily sensitive and selective to socially relevant ligands and mixtures (Luo et al., 2003), suggesting that they receive and process sensory inputs in a highly specific manner.
Axons of vomeronasal sensory neurons expressing a given receptor type diverge and innervate between 6 and 30 glomeruli in the AOB (Belluscio et al., 1999; Rodriguez et al., 1999). Single glomeruli are believed to contain axons of a single type of sensory neuron (Belluscio et al., 1999; Rodriguez et al., 1999), although some individual VSNs likely express multiple receptors (Leinders-Zufall et al., 2009). The targets of VSN axons, AOB mitral cells, have multitufted morphology, and these tufts terminate in 3–8 glomeruli (Ramon y Cajal S, 1911; Takami and Graziadei, 1990; Urban and Castro, 2005). This unique anatomy is thought to play a critical role in the computations performed by the AOB (Dulac and Torello, 2003), but the mechanisms governing the establishment of this circuit are not well understood.
Here we examine the development of the vomeronasal system and the effects of activity on the early development of anatomical and functional connectivity of VSNs to AOB mitral cells. We find that contrary to previous reports (Coppola and O'Connell, 1989; Coppola et al., 1993), from the first postnatal day the vomeronasal duct connecting the VNO to the external environment allows chemical stimuli to reach the VSNs. Also, from birth we find that VSN axons are capable of releasing glutamate to activate downstream mitral cells in the AOB. These observations suggest that activity may affect development; we therefore stimulated specific VSNs to explore the role of activity. By using two major histocompatibility complex class I (MHC-I) peptides known to activate specific VSNs (Leinders-Zufall et al., 2009), we show that peptide exposure results in overexuberant axonal projections and delays axonal coalescence into well defined glomeruli during the first four postnatal days. We also show that at least one of these peptides is present in urine from males and females at sufficient concentrations to activate sensory neurons and is capable of inducing immediate early gene expression in downstream neurons in the AOB.
Finally, we report that mitral cell dendritic endings undergo a dramatic period of targeting and clustering just after presynaptic coalescence of sensory neuron axons. We show that VSN to mitral cell connectivity is precise, with mitral cell dendrites targeting glomeruli receiving input from sensory neurons expressing the same vomeronasal receptor type. Taken together, these data indicate that development of connectivity to the AOB is precise and activity modulated, generating a stable, specific anatomical structure to facilitate AOB computations.
Materials and Methods
Slice preparation.
Sagittal olfactory bulb slices (280–350 μm thick) were prepared from young transgenic V2r1b mice (Del Punta et al., 2002), postnatal days 0–33, as described previously (Urban and Castro, 2005). Mice were anesthetized (0.1% ketamine/0.1% xylaxine; ∼3 mg/kg, i.p.) and decapitated. Olfactory bulbs were removed and sectioned on a Leica vibratome while submerged in ice-cold oxygenated Ringer's solution containing the following (in mm): 125 NaCl, 2.5 KCl, 25 NaHCO3, 1.25 NaH2PO4, 1MgCl2, 25 glucose, and 2 CaCl2. All procedures were in accordance with the guidelines of Institutional Animal Care and Use Committee of Carnegie Mellon University (Pittsburgh, PA).
Electrophysiology.
Whole-cell voltage recordings were obtained from the somata of identified AOB mitral cells. Slices were superfused with oxygenated Ringer's solution containing the following (in mm): 125 NaCl, 2.5 KCl, 25 NaHCO3, 1.25 NaH2PO4, 1MgCl2, 25 glucose, and 2 CaCl2, warmed to 34–36°C. Whole-cell recordings were established using pipettes (resistances of 2–8 MΩ) filled with a solution containing the following (in mm): 120 potassium gluconate, 2 KCl, 10 HEPES, 10 sodium phosphocreatine, 4 MgATP, and 0.3 Na3GTP, adjusted to pH 7.3 with KOH. Voltage-clamp and current-clamp recordings were performed using a MultiClamp 700A amplifier (Molecular Devices). Data were low pass filtered (4 kHz) and digitized at 10 kHz using an ITC-18 (Instrutech) controlled by custom software written in Igor Pro (Wavemetrics). In some experiments in which membrane current was recorded, mitral cells were held at −90 mV to facilitate the recording of glutamate-mediated EPSCs. Otherwise, the neurons were maintained at resting membrane potential (−50 to −60 mV).
Urine collection and purification.
Urine was collected separately from male and females that were 3–9 months old housed in metabolic cages and was stored at −20°C until use. Urine was then thawed and centrifuged at 500 × g for 5 min, and the supernatant was filtered through 0.2 μm filter paper. Female urine and male urine were mixed at a 1:1 ratio for all experiments. Urine was then purified in 12 ml Sep-Pak Discovery DSC-18 cartridges (Supelco). Cartridges were primed with 3 ml of methanol followed by washing with 5 ml of deionized water with 0.1% trifluoroacetic acid (TFA) before addition of the urine samples onto the column. Urine samples were then washed with 1 ml of 2% NaCl in TFA. Finally, the peptide was eluted using consecutive additions of 1 ml of 75% acetonitrile/25% water with 0.1% TFA (5×), and each fraction was collected in conical tubes. To determine which fractions contained the peptide of interest, pure urine samples were spiked with derivatized pure peptide to observe, via fluorescence, which fractions contained the peptide.
Peptide stock concentration determination and derivatization.
Stock concentrations of pure peptide (GenScript) were made by dissolving ∼5 mg of peptide in H2O. Protein concentration was determined spectrophotometrically using a Thermo Scientific NanoDrop ND-1000 spectrophotometer assuming a molar extinction coefficient of 1280 cm−1 m−1 (λ = 280 nm) using the Beer–Lambert law (A = ε l c). The peptide was derivatized by adding 10 μl of dansyl chloride solution (2.5 mg/ml in acetonitrile) followed by incubation at 37° for 30 min.
Lyophilization and reversed phase liquid chromatography.
Fractions containing the peptide of interest were frozen at −80°C and lyophilized using a Labconco FreeZone 4.5 freeze dry system, and the resulting solid was reconstituted in 100 μl of water with 0.1% acetic acid. Each sample was then run through high performance liquid chromatography (HPLC) on a Waters 2695 Alliance separation module using a C18 Symmetry 300 column (3.9 mm × 150 mm, 5 μm beads). Gradient elution was carried out at a flow rate of 1.0 ml/min with a mobile phase from 0 to 50% of 0.1% TFA in acetonitrile versus 0.1% TFA in H2O in 20 min. Fluorescence of the eluate was monitored with a Waters 996 Photodiode Array Detector using an emission wavelength of 220 nm. Fractions were collected about a minute and a half before and after the peak. The resulting fractions were lyophilized again and reconstituted in 50 μl of 0.1% acetic acid in H2O for liquid chromatography-mass spectrometry.
Liquid chromatography–electrospray ionization tandem mass spectrometry.
Peptide confirmation and quantification were performed by running the samples on a Michrom BioResources, Magic 2002 HPLC through a Magic MS C18 column (1.0 mm × 150 mm, 5 μm beads) using a gradient elution with a flow rate of 75 μl/min. The gradient went from 0 to 40% mobile phase B in 40 min, where mobile phase B equaled 99% acetonitrile with 0.1% acetic acid, while mobile phase A equaled 99.9% H2O with 0.1% acetic acid. Electrospray ionization (ESI)-tandem mass spectrometry (MS/MS) was performed using a Thermo Fisher LCQ ESI/APCI ion trap mass spectrometer for the parent scan of m/z 553.7 fragmentation to m/z 251.1, 398.1, 709.3, and 856.4 in a multiple reaction monitoring scan. The isolation width on m/z 553.7 was Δm/z = 3.0 with a collision energy of 31%. Chromatogram peaks were filtered based on the MS/MS fragmentation, averaged and smoothed using a seven point Gaussian filter, integrated using Thermo Fisher Xcalibur Qual Browser software version 1.3, and plotted versus concentration to form a calibration curve for quantitative analysis. A linear regression of this curve was fitted and extrapolated to determine peptide concentration in pure urine samples. Both spiked urine samples and pure urine samples were prepared, purified, and quantified the exact same way.
VNO and AOB tissue collection and immunohistochemistry.
For animals painted with Alexa Fluor 594 hydrazide (molecular weight, 758 Da), the dye was made at 1 mm in internal buffer solution containing the following (in mm): 150 d-gluconic acid, 10 HEPES, 2 KCl, pH adjusted to 8.05 with KOH. Animals at all ages were transcardially perfused first with 0.1 m phosphate buffer (PB) (2 min), then with 4% paraformaldehyde (PFA) (2 min), and their brains were dissected and fixed overnight at 4°C before being transferred to a 0.1 m PB solution, pH 7.2, containing 30% sucrose. The heads were also fixed overnight in 4% PFA before being transferred to 0.1 m PB, pH 7.2. Each brain was sectioned at 25 or 75 μm using a Leica cryostat SM2000R (Germany), and the sections were placed in 1 ml of 0.1 m PB solution containing 0.05% Na azide and 0.005% Tween 20. The heads were mounted against a 4% agarose block and sectioned at 200 μm using a vibratome, and the sections were also transferred to 24-well plates containing 1 ml of PB solution.
For anti-GFP staining, both VNO and brain sections were permeabilized in 2% normal donkey serum and 2% TX-100 and then washed 3× with PB, incubating for 5 min each wash. The solution was then aspirated and replaced with the primary antibody (300 μl of 1:1000 GFP mouse antibody; Invitrogen) in PB with 2% normal donkey serum and 0.01% TX-100. After washing 3× again in PB, the solution was aspirated and replaced with the secondary antibody (300 μl of 1:1000 Alexa Fluor 488-conjugated donkey anti-mouse antibody; Invitrogen) with 2% normal donkey serum and 0.01% TX-100 and incubated for 1 h in the dark and finally washed 3× in PB. The sections were then mounted in gelvatol for confocal imaging and analysis.
For anti-c-Fos staining, sections were permeabilized in PB containing 2% normal donkey serum (NDS; Jackson ImmunoResearch Laboratories) and 0.01% Triton X-100 Sigma) for 1 h at room temperature (RT). After three washes in PB, sections were labeled with mouse anti-c-Fos (Calbiochem), 1:1000 in PB with 2% NDS and 0.05% Tween 20 for 1 h at RT. Following three washes in PB, sections were labeled with Alexa Fluor 488 donkey anti-mouse antibody (Invitrogen) at 1:600 in PB containing 2% NDS and 0.05% Tween 20 with 1:40,000 Hoechst 33342 (Invitrogen) for 1 h at RT in the dark. After a final three washes in PB, sections were mounted on collagen-coated slides with gelvatol for imaging and analysis.
VSN axonal coalescence imaging and analysis.
Confocal image stacks were acquired using a Zeiss LSM 610 microscope with a 40× oil objective. Image stacks were median filtered using ImageJ software with a Gaussian width of 2.0 pixels. For analysis of axonal arborization, maximum intensity z-projections of each stack were imported into custom-written software in Igor Pro. Individual glomeruli were analyzed by placing the coordinates of a semicircle such that the arc of the semicircle was oriented ventral to the section with the straightedge cutting off the axons just above the glomerulus. This ensured that each concentric semicircle expanded throughout the axonal terminations in the glomerulus while excluding the axons superficial to the glomerulus. Sholl analysis was performed such that the final concentric semicircle encompassed the entire glomerulus. Histogram plots of the number of pixels crossing threshold as a function of distance were calculated, and the width of the peak of each histogram plot was measured at half of the maximum amplitude.
Mitral cell reconstruction and tuft analysis.
Cells were filled with Neurobiotin (Vector Laboratories) during whole-cell recordings and slices were placed individually in a well of a 24-well plate (Corning) containing 1 ml of 4% paraformaldehyde in 0.1 m phosphate buffer, pH 7.2, and stored at 4°C for up to 2 weeks. After washing twice with phosphate buffer, pH 7.2, endogenous peroxidase was quenched with 1% H2O2 (Sigma) and 10% absolute MeOH in PB at RT until bubbling stopped (approximately 1–3 h). After washing twice with PB at RT, slices were permeabilized for 1 HR at RT with 2% Triton X-100 (Sigma) in PB. During this incubation, Vectastain (Vector Laboratories) was prepared (using the dropper bottles provided) by adding two drops of Reagent A and two drops of Reagent B to 5 ml of PB containing 1% Triton X-100. The permeabilization buffer was removed at the end of the incubation period and replaced with the Vectastain reagent. Slices were then incubated overnight at 4°C in Vectastain. The next day, slices were washed twice for 10 min, twice for 15 min, and once for 1 h with PB at RT. During the last wash, a 0.5 mg/ml solution of 3,3′-diaminobenzidine tetrahydrochloride (DAB) was prepared by dissolving one DAB tablet (Sigma) in 20 ml of PB. Immediately before use, 6.7 μl of H2O2 was added, and then slices were incubated in the DAB solution for up to 10 min with constant monitoring of color development. At the end of the DAB reaction, slices with washed 5× for 10 min each in PB at RT. They were then mounted on collagen-coated slides in gelvatol using a Parafilm spacer between the slide and coverslip. The sections were then examined under differential interference contrast, and their dendrites were reconstructed using Neurolucida 8.11 (MicroBrightField) and analyzed using Neurolucida Explorer (MicroBrightField). Density calculations were performed in Matlab using XYZ coordinates of traced mitral cells in Neurolucida. Sliding windows of 5, 25, and 50 μm were used, and a density histogram was calculated for each of the window sizes. The mean of the histogram at two standard deviations above the mean was calculated to compare across age groups.
Electroporation.
Slices containing AOB were examined under fluorescence (488 nm) to identify GFP-positive glomeruli innervated by V2r1b-GFP-expressing sensory neurons. Glass electrodes were pulled to a tip size of 3–7 μm and filled with 5–10% solutions of dextran-conjugated Alexa Fluor 594 (Invitrogen). The tip of the electrode was placed in the center of a GFP-positive glomerulus. The electroporation protocol consisted of 1200 pulses (25 ms duration, 1–2 μA) at 2 Hz given by a stimulus isolation unit box controlled by TTL pulses from the ITC-18 data acquisition board as described by Hovis et al. (2010). This typically resulted in fluorescent dye loading of 6–10 mitral cell bodies and their dendrites per slice. This tissue was fixed in 4% paraformaldehyde for ∼24 h and examined post hoc using confocal imaging (LSM 610 Meta Axioscope 2). Single images, image stacks, and 3D reconstructions of slices were taken and compiled using Zen 2007 software.
Results
The vomeronasal system is functional at birth
There has been some debate over whether or not the mouse vomeronasal system is functional at birth and therefore plays some role in the behavior of nursing pups. Previous work has shown that in embryonic day (E)8 and E19 mouse fetuses, the duct that connects the vomeronasal organ to external sources of stimuli is not patent (Coppola and O'Connell, 1989). Further work showed that even on the first day after birth (P0), the duct primordium remains immature, suggesting that it could not transmit odorants from the nasal cavity (Coppola et al., 1993). However, work in the rat has suggested that in both prenatal and perinatal rat pups, the accessory olfactory system is exposed to olfactory stimuli (Coppola and Millar, 1994). To our knowledge, a direct test of whether or not the VNO lumen has access to external stimuli just after birth in the mouse has not been performed.
To determine whether or not the vomeronasal duct is open at birth, thereby allowing for access of external sensory stimuli, we exposed very young pups (P0) to a solution containing Alexa Fluor 594 hydrazide dye. We used a transgenic mouse line whose sensory neurons, which express the V2r1b receptor, also express tau-GFP, enabling us to visualize these sensory neurons via fluorescence (Del Punta et al., 2002). Using a paintbrush, we painted only one nostril with a solution containing the dye (Fig. 1A) three times over the course of a half an hour and then sacrificed the animal an hour later. We then fixed and cut coronal sections of the heads, imaged these sections, and examined them for evidence of dye in the VNO. As expected, we observed bright red fluorescence throughout the main olfactory epithelium that lines the nasal cavity, but only on the side corresponding to nostril exposed to the Alexa Fluor dye (Fig. 1B). However, we also observed fluorescence in the VNO lumen, indicating that the dye had gained access to the VNO. We also observed a small number (∼5–10 at P0) of VSNs that had apparently taken up the dye as indicated by the fact that they showed red fluorescence. These cells were morphologically similar to and located in the same regions of the VNO as the GFP-expressing sensory neurons (Fig. 1C,E). We did not observe this fluorescence on the side of the animal in which the nostril had not been directly painted and exposed to the dye (Fig. 1D, n = 3 animals).
Figure 1.

The vomeronasal duct is open at birth. A, Schematic of the experimental design. Alexa Fluor 594 hydrazide dye was painted onto one of the nostrils of a P0 mouse, exposing the sensory neurons of one-half of the VNO to the dye for 1 h. B, Confocal image of a coronal section of the face of an exposed animal. illustrating the presence of dye contacting not only the epithelium of the nasal cavity (top arrow), but also the lumen of the VNO (bottom arrow). C, Higher magnification view of B. D, Higher magnification view of the control VNO, where only native GFP expression can be seen in the VSNs. E, Higher magnification view from C showing the exposed VNO, which not only contains native GFP-expressing sensory neurons (top arrow) but some sensory neurons that have been exposed to and taken up some dye (bottom arrow). Scale bar, 100 μm.
This result suggested that the duct leading to the VNO is indeed open enough at birth to allow entry of external stimuli as early as postnatal day zero. However, this does not necessarily mean that these sensory neurons are capable of signaling to downstream neurons in the accessory olfactory bulb. To determine whether VSN to mitral cell synapses were functional at early postnatal stages, we performed whole-cell, voltage-clamp recordings from random mitral cells in the accessory olfactory bulb. Axons of VSNs terminate and synapse onto mitral cell dendritic tufts, providing the only known source of excitatory input onto these output neurons (Brennan and Keverne, 1997). We recorded miniature synaptic currents in the presence of gabazine (10 μm) while holding at −90 mV to increase our ability to detect small excitatory events.
We observed spontaneous EPSCs in mitral cells from animals as young as postnatal day zero, indicating that the synaptic circuits between the vomeronasal sensory neurons and their postsynaptic mitral cells were indeed functional at birth (Fig. 2A). In addition, we found that the properties of these synaptic events at P0 were nearly identical to inputs seen at postnatal day 12 (Fig. 2A,B). We calculated the average amplitude of these events as well as their decay time across cells at three different age groups and found no significant difference between either the amplitude or decay time of events across age groups (Fig. 2C,D). Taken together, our results suggest that not only is the vomeronasal system open to external stimuli at birth, but that this system is also online at birth and capable of sending signals about the periphery to the brain via synaptic connections with mitral cells in the accessory olfactory bulb. We next undertook experiments to determine whether a peptide ligand for an identified class of VSNs may act as an environmental cue to regulate development of VSN projections to the AOB.
Figure 2.

VSNs form functional synapses with mitral cells before birth. A, Example recording of mEPSCs from a P0 mitral cell. B, Example recording from a P12 mitral cell. All cells were held at −90 mV to amplify events, and events were recorded in the presence of 10 μm gabazine. C, Distribution of the average amplitudes of events at three different age groups (P0–1, n = 5, 13.7 ± 1.52 pA; P5–6, n = 5, 15.8 ± 3.23 pA; P11–12, n = 6, 14.2 ± 2.20 pA). Each value was the average amplitude for a given cell from a minimum of one and a half minutes of data. D, The average decay time for all the events of each cell at each of the three different age groups (P0–1, n = 5, 6.4 ± 0.92 ms; P5–6, n = 4, 8.1 ± 0.75 ms; P11–12, n = 6, 6.9 ± 0.43 ms).
MHC-I peptides are present in urine and induce c-Fos activation in downstream neurons
The first two postnatal weeks of a rodent's life represent a dramatic period of growth and development in both the VNO and the AOB (Roos et al., 1988; Jia et al., 1997; Weiler et al., 1999). Given that the vomeronasal system is able to receive chemical stimuli and that VSNs are capable of activating AOB mitral cells at very young ages, we wondered what role, if any, activity might play in the development of this system. To address this question, we wanted to activate GFP-labeled sensory neurons that expressed the V2r1b receptor and then visualize the effect of activity on the development of these sensory neurons and their axonal projections to the accessory olfactory bulb.
Previous work has shown that peptide ligands of MHC-I molecules function as olfactory cues for subsets of vomeronasal sensory neurons (Leinders-Zufall et al., 2004; He et al., 2008). Specifically, two MHC peptides in particular have been shown to activate vomeronasal sensory neurons that express the V2r1b receptor, namely the peptides SYFPEITHI and AAPDNRETF (Leinders-Zufall et al., 2009). V2r1b-expressing sensory neurons have been shown to be extremely sensitive to both of these MHC-I peptides, with EC50 values of ∼3 × 10⁻¹⁴ m and ∼ 8 × 10⁻¹³ m respectively. For these peptides to play a role in regulating normal development, they would need to be present in the animal's environment. Thus, we tested whether either of these peptides is present in mouse urine at sufficient levels to activate these sensory neurons under normal conditions.
Combining urine from both males and females, we first purified 500 μl samples by running them through DSC-18 cartridges (see Materials and Methods) followed by reversed-phase liquid chromatography. We collected fractions coming off the HPLC having retention times similar to those observed from previous runs of urine samples with high concentrations of the stock peptide solution. After purifying and collecting the fractions of interest from HPLC, the samples were then lyophilized and analyzed using electrospray ionization mass spectrometry to isolate and quantify the peptide of interest (Fig. 3A). The amount of peptide present in each sample was determined by integrating the chromatogram peak filtered to the mass ranges of the fragments of the peptide (Fig. 3B). We compared this value to a calculated calibration curve of 500 μl samples of urine spiked with a known concentration of pure stock peptide, running them all through the same purification and fractionation procedures to calculate the average native peptide concentration in pure urine samples (Fig. 3C). We found the native concentration to be ∼6 nm (n = 3, ± 1.44 nm), far greater than the picomolar EC50 of these receptors, suggesting that exposure to urine should activate V2r1b-expressing sensory neurons.
Figure 3.

MHC-I peptide is present in urine at sufficient concentrations to activate sensory neurons. A, Example MS spectrum of the native peptide SYFPEITHI using electrospray injection MS/MS at the 553.7 + 2 m/z peak (red arrow). Collision energy was used to fragment the peptide into smaller pieces for identification (black arrows). B, Example chromatogram from A (250 nm), which was filtered to peptide fragment mass ranges and then integrated. C, Calibration curve created from the integration of chromatogram peaks across a range of spiked urine concentrations (0 nm, n = 3, 76,717 ± 68,574 counts; 50 nm, n = 3, 5,318,503 ± 770,200 counts; 125 nm, n = 3, 14,155,185 ± 750,388 counts; 250 nm, n = 3, 24,637,306 ± 1,716,317 counts). After performing a linear regression, the line equation was then used to calculate the average native concentration of peptide in pure urine samples (red dot).
Although previous work in acute slices has shown the activation of V2r1b-expressing sensory neurons by these two MHC-I peptides (Leinders-Zufall et al., 2009), it remained unclear whether these peptides would be able to induce activity downstream of these sensory neurons themselves in vivo. In an initial set of experiments, we applied these peptides to determine whether they would activate AOB mitral cells. Following previous work demonstrating that activation of AOB mitral cells results in expression of the immediate early gene c-Fos (Guo et al., 1997; Inamura et al., 1999; Yamaguchi et al., 2000), we tested whether application of a solution containing a mixture of the two MHC-I peptides at 250 μm to the naris of P15–18 old animals (three applications using a paint brush over the course of 30 min, 1 h before sacrificing), increased expression of c-Fos (Fig. 4A).
Figure 4.

MHC-I peptides induce c-Fos activation in downstream neurons in the AOB. A, Schematic illustrating the exposure of the VNO to either MHC-I peptides or water control to examine the activation of c-Fos in downstream neurons in the AOB. B, Confocal image of a sagittal section containing AOB from a control, water exposed animal (Green, GFP; red, c-Fos; GL, glomerular layer; MCL, mitral cell layer; GCL, granule cell layer). C, Confocal image of a section containing AOB from a peptide exposed animal. D, Normalized c-Fos expression in the mitral cell layer across animals of water-exposed control (Ctrl) animals (n = 5, 191.6 ± 21.6 cells) compared to peptide exposed animals (n = 6, 387.8 ± 29.8 cells, p = 0.0006).
We observed c-Fos expression in the expected (caudal) region of the AOB in both water-exposed control animals as well as in peptide-exposed animals and in all layers of the bulb, including the glomerular layer, the mitral cell layer, and the granule cell layer (Fig. 4B,C). The mitral cell layer was identified by manually marking the region of interest containing the external plexiform layer using Neurolucida for each section, and cells were manually counted. This layer was identified as being above the demarcation for the glomerular layer and below the internal plexiform layer/lateral olfactory tract, which were both easily identifiable under fluorescence.
We found that on average, there was a twofold increase in the number of mitral cells expressing the immediate early gene c-Fos after exposure to the MHC-I peptides compared to those painted with water (Fig. 4D). These results confirmed that exposure to the mixture of peptides elicited an increase in the activity of vomeronasal sensory neurons and, in turn, the activity of downstream mitral cells. Given that we and others observe vomeronasal receptor expression in very young animals (P0-4) (Jia et al., 1997), it seems likely that their sensitivity is similar in young animals, making these peptides ideal substrates for examining the effect sensory activity plays in the development of this system.
Sensory activity affects axonal targeting but not VSN survival
To examine the effect that prolonged activity had on the development of this system, we took newborn litters of pups and separated the litter into two halves, one half with the birth mother, the second half with a postpartum surrogate mother. In the experimental group, pups were exposed three times a day to the mixture of the two peptides (250 μm) by painting the noses of each pup as well as the mother's face and underbelly with the solution containing the two peptides. The control group was exposed in the same way, only using water as the solution. After each 24 h period, a pup from each group was perfused, and the brain was dissected out and sectioned and stained with antibodies against GFP, with the average experiment lasting 5 d (litter of 10 pups). The head (containing the vomeronasal organ) was also preserved, sectioned, and stained with antibodies against GFP.
We manually traced each section to reconstruct and calculate the entire volume of the VNO at different ages (Fig. 5A), as well as to visualize and count the number of V2r1b-expressing sensory neurons in each section (Fig. 5B). We did not observe a greater number of V2r1b-expressing sensory neurons (two-tailed t test) in animals that had been exposed to higher concentrations of the peptides compared to water-exposed animals (which were only exposed to endogenous levels present in the cage) (Fig. 5C, p = 0.55, n = 3 and 0.25, n = 4 respectively). In addition, when we calculated the total volume of each VNO and compared them between conditions at each age, we saw no change in the volumes of the VNOs (Fig. 5D). These results suggest that activity does not increase the survival of V2r1b-expressing neurons or result in an increase in vomeronasal organ size.
Figure 5.

Activation of V2r1b-expressing sensory neurons does not significantly increase the number of V2r1b-expressing VSNs. A, Point by point reconstruction of a complete VNO traced using Neurolucida and reconstructed using Igor Pro software. B, Confocal image stack of a 200 μm section of VNO from a transgenic animal whose V2r1b-expressing sensory neurons also express tau-GFP. Scale bar, 20 μm. C, The number of V2r1b-expressing sensory neurons across development in water-exposed control animals (black bars; P1, n = 3, 86 ± 4.2 cells; P2, n = 4, 116.8 ± 8.3 cells; P3, n = 3, 134.6 ± 1.6 cells) and peptide exposed animals (red bars; P1, n = 3, 94.3 ± 12.2 cells, p = 0.55; P2, n = 4, 131 ± 7.5 cells, p = 0.25; P3, n = 5, 131 ± 3.65 cells; P4–5, n = 3, 134.5 ± 8.8 cells). D, Comparison of the volume of the VNOs across ages in control (P1, n = 3, 49,375,000 ± 1,380,063 μm3; P2, n = 4, 65,050,000 ± 9,058,528 μm3; P3, n = 4, 59,870,700 ± 2,946,470 μm3) and peptide exposed animals (P1, n = 3, 56,979,833 ± 4,453,998 μm3; P2, n = 4, 60,502,225 ± 4,029,919 μm3; P3, n = 5, 60,960,420 ± 2,491,808 μm3).
Previous work in the main olfactory system (Potter et al., 2001) suggests that substantial refinement and coalescence of olfactory receptor neuron axonal arborizations occurs in the first few postnatal days. We wondered how this early development proceeds in the vomeronasal system and whether increased activity would accelerate this refinement across development. For this analysis, we targeted V2r1b-GFP axons terminating in AOB glomeruli in animals that had been exposed to the peptide (SYFPEITHI and AAPDNRETF) as described above (see previous section, MHC-I peptides are present in urine and induce c-Fos activation in downstream neurons) compared to control animals which were exposed to peptides of the same length and amino acids but whose sequence was scrambled (PTEISHYFI and DTPAAERFN, respectively). Confocal image stacks of glomeruli from sections of the AOB taken from animals under each condition at different ages were used to observe axonal coalescence during the first few postnatal days of the animal's life (Fig. 6A,B). We found that axonal arborizations did coalesce in the first few postnatal days, but surprisingly, activity did not accelerate this refinement process but instead seemed to result in increased axonal exuberance and the retardation of glomerular coalescence.
Figure 6.
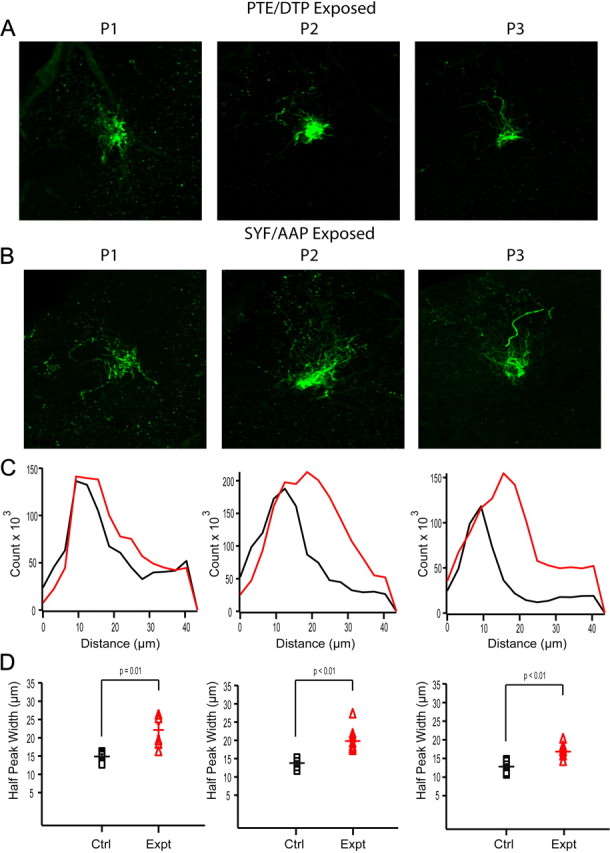
Activity significantly affects axonal exuberation and coalescence in the AOB. A, Example confocal image stacks of glomeruli across three ages in water exposed control animals. B, Example confocal image stacks of glomeruli from peptide-exposed animals. C, Histogram distributions using Sholl analysis for the two example glomeruli above each histogram (Black, control animal; red, exposed animal). D, Quantification of the half peak width from each histogram across animals at three different ages comparing water controls (Black squares; P1, n = 5, 15.2 ± 1.2 μm; P2, n = 9, 13.9 ± 1.4 μm; P3, n = 9, 12.8 ± 0.7 μm) with exposed animals (Red triangles; P1, n = 6, 23.6 ± 1.7 μm, p = 0.0029; P2, n = 8, 21.7 ± 2.1 μm, p = 0.0076; P3, n = 9, 23.6 ± 1.1 μm, p = 0.001). Scale bar, 20 μm.
To quantify this effect, we performed a modified Sholl analysis on each glomerulus excluding the incoming axons (see Materials and Methods). We calculated the histograms of the number of pixels over threshold for increasingly expanding rings across conditions and ages (Fig. 6C). We found that, on average, the distributions from animals exposed to the endogenous peptides were broader and more diffuse compared to animals exposed to scrambled peptides. We measured the width of these distributions at half of their maximum count and found a significant difference in these distributions throughout the first three postnatal days (Fig. 6D; p = 0.0103, p = 0.0026, and p = 0.0056, respectively). These results suggest that strong activation of these sensory neurons does affect the normal developmental targeting of VSN axons to their glomerular targets in the AOB. Specifically, axonal arbors are overexuberant and less precise in their targeting, and their refinement is delayed.
Adult connectivity in the AOB is nonrandom
These results caused us to wonder what the importance of this axonal coalescence into well defined glomeruli early in development was for the proper wiring of the system. It has been previously suggested that postsynaptic mitral cells project their dendrites in such a way as to target glomeruli receiving input from vomeronasal sensory neurons expressing the same receptor type (Del Punta et al., 2002), while others have suggested that mitral cells receive input from sensory neurons expressing different receptors, but likely from the same receptor subfamily (Wagner et al., 2006). Further complication has been added by the suggestion that single VSNs likely express multiple receptors (Leinders-Zufall et al., 2009).
To examine the timeline for the development of dendritic projections of mitral cells, we recorded from mitral cells across different ages in control animals and filled each cell with neurobiotin, allowing us to visualize the neuron's morphology post hoc. Cells were allowed to fill for ∼30 min, and the slices were then fixed, stained using the avidin-biotin peroxidase reaction, and mounted to be traced using Neurolucida to compare the dendritic morphology across development (Fig. 7A). Interestingly, we found that early in development (P0-P4), mitral cell dendrites lacked elaborate tufts seen in their mature counterparts (P14–33). Instead, mitral cells projected multiple dendrites with simple point endings. After P4, these endings began to ramify in well defined tufts in their respective glomeruli and continued to refine through postnatal day 30.
Figure 7.
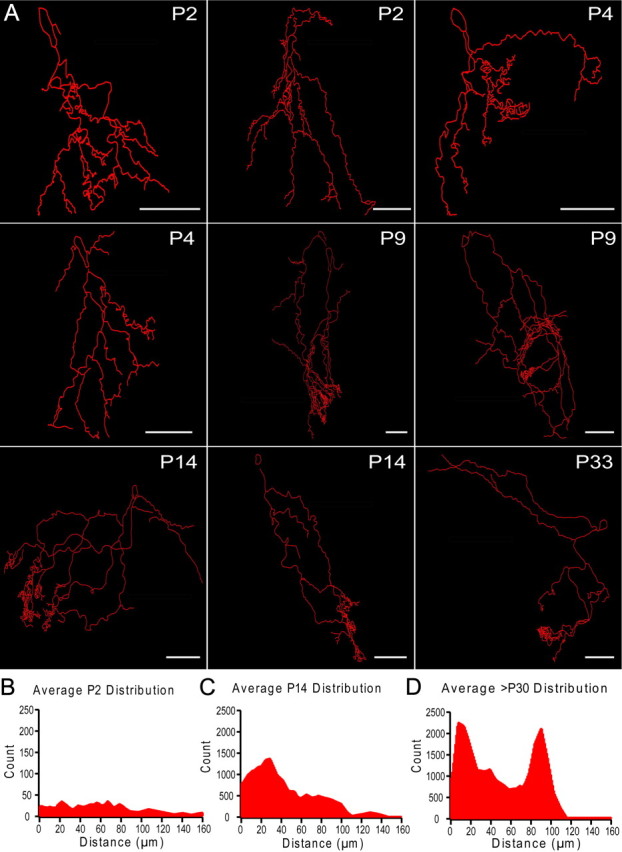
Mitral cell dendritic morphology undergoes dramatic refinement during the first four postnatal weeks. A, Neurolucida reconstructions of mitral cells across development (P2–33). Mitral cells were targeted, patched, and filled with neurobiotin. Slices were fixed post hoc and stained to be traced and reconstructed using Neurolucida. B–D, Point ending distributions across development. Neurolucida tracings were used and each point ending within the glomerular layer was identified. The histogram of all the distances between each point ending was calculated and averaged for mitral cells from different age groups. P2–4 (B, n = 4), P9–14 (C, n = 4), and P30 and older (D, n = 4). Scale bars, 50 μm.
To quantify this, we assessed the changes in clustering of dendritic endings from Neurolucida tracings of mitral cells across development. We compared the average distributions of distances between end points within the glomerular layer across development. The point endings in young mitral cells (P0-P4, n = 4) were distributed uniformly in space (Fig. 7B). The spatial distribution of point endings became increasingly bimodal with age (P9-P14, n = 4 and >P30, n = 4; Fig. 7C,D), indicative of tuft ramification within glomeruli and coinciding with the average size of glomeruli in the AOB.
Since AOB mitral cells innervate multiple glomeruli, we desired a means of examining the dendritic architecture of all or most of the mitral cells that projected to a given glomerulus that was innervated by axons of V2r1b-expressing VSNs. Utilizing an electroporation method previously developed by our laboratory (Hovis et al., 2010), we chose to electroporate GFP-positive glomeruli with a charged Alexa Fluor hydrazide dye, in turn labeling many of the postsynaptic dendrites of mitral cells innervating that glomerulus (Fig. 8A,B). After electroporation, the neurons were allowed to fill for ∼30 min and then fixed and mounted for confocal imaging.
Figure 8.

Electroporation reveals highly precise adult connectivity in the AOB. A, Slice electroporation of an identified glomerulus innervated by V2r1b-GFP expressing sensory neuron axons labels several downstream mitral cells and their subsequent dendrites with a red fluorescent dye. B, Higher magnification view of A, showing the targeting of a single GFP-positive glomerulus and revealing the morphology of several labeled mitral cells. C, Higher magnification view of A showing multiple dendrites of labeled mitral cells targeting other GFP-positive glomeruli. D, E, Higher magnification view of C showing two individual GFP-positive glomeruli along with multiple red fluorescent dendrites innervating them. Note size of scale bars.
To evaluate the targeting of connectivity within the glomerular layer of mitral cell dendrites, the dendritic tufts of electroporated mitral cells were examined. As expected, nearly all electroporated mitral cells innervated the electroporated, GFP-positive glomerulus. We also examined the subsequent tufts of mitral cells that were not in the electroporated glomerulus. We examined >20 tufts of mitral cells from multiple slices and found that 21 of 22 of those tufts terminated in other, GFP-positive glomeruli (Fig. 8C–E). It could not be confirmed whether the remaining tuft terminated in a GFP-positive glomerulus. (data not shown).
These results suggest that connectivity between mitral cells and axons from sensory neurons in the vomeronasal organ is specifically targeted and that this specificity provides a substrate for proper information processing in this system. In turn, it seems possible that the proper refinement of axonal arborizations early in development (P0–4) may be important for postsynaptic mitral cell dendrites to correctly target their presynaptic partners later in development (P5–30) as their dendrites begin to cluster and form tufts in glomeruli receiving input from axons of receptor neurons expressing a specific receptor type.
Discussion
We have described the neonatal vomeronasal system in mice in which vomeronasal sensory neurons at birth are exposed to external stimuli and capable of neurotransmitter release on postsynaptic targets in the brain. In addition, we demonstrated that at least one MHC-I peptide was present in urine at concentrations >1000-fold above what is likely to activate specific vomeronasal receptors. Moreover, application of these peptides to the nose was able to activate immediate early gene expression in AOB mitral cells. Utilizing these peptides as a means of increasing sensory activity in a subset of VSNs, we showed that activity did not significantly affect V2r1b-expressing sensory neuron number or volume of the VNO, but did significantly alter the targeting and refinement of axons from these neurons in the AOB. Finally, we show here that dendritic targeting of mitral cells to glomeruli containing axons of sensory neurons occurs after axonal coalescence and requires precise targeting to glomeruli, all of which receive input from sensory neurons expressing the same receptor type.
This study suggests that the first two postnatal weeks are a critical period of development and growth consistent with previous reports for both the growth of the vomeronasal organ (Weiler et al., 1999) and the accessory olfactory bulb (Roos et al., 1988). During this epoch, VSN axons and mitral cell dendrites achieve a high degree of specificity in the synaptic connections between them, despite the complex anatomical architecture of the AOB. This anatomical precision reflects an important prerequisite within this system and is essential to understanding how this system is processing chemical information.
The role of the young vomeronasal system
Our results suggest that despite previous reports indicating that the vomeronasal system duct is immature and not patent at birth, it is open enough that small molecules from the environment can access sensory neuron receptors in the VNO. Previously, Coppola and colleagues tested the functionality of vomeronasal system by injecting fluorescent beads into the amniotic fluid surrounding the mouse fetus. After examination of sections in all regions of the nasal cavity, fluorescence was found in all regions of the nasal cavity except the lumen of the VNO (Coppola and O'Connell, 1989). Coppola and colleagues later examined serial sections of the VNO duct from E19 through P25. Although the duct was clearly obstructed at E19, its morphology had significantly changed at P1 although they claimed it was still immature and did not become patent until sometime after the first day of life (Coppola et al., 1993).
However, we directly tested whether the VNO was indeed open enough to allow for access to external stimuli. It has been demonstrated by other groups that fluorescent dyes could be used as a means for evaluating access to both the VNO lumen and the olfactory epithelium in adults. For example, adult guinea pigs were allowed to investigate urine containing rhodamine and were shown to exhibit fluorescence in their vomeronasal organs but not in the olfactory epithelium (Wysocki et al., 1980). Our results here suggest that although the VNO duct may be at an immature stage just after birth, the duct is still capable of allowing molecules as large as 1000 Da access to the lumen, similar to the molecular weight of the MHC peptides used in this study. Alternatively, the possibility that these stimuli may reach the VNO receptors by some route other than the VNO duct cannot be ruled out.
The results here raise the question of the functional role for the accessory olfactory system in early postnatal life. The main olfactory system is known to be critical in the survival of newborns in several species. For example, olfactory cues have been implicated in species such as the wallaby to direct the neonate to its mother's pouch (Schneider et al., 2008, 2009), in kittens in the guidance of nipple attachment and suckling (Raihani et al., 2009), and in rabbits the role of the “nipple-search pheromone” in nipple attachment of pups (Hudson et al., 2002). Although it is clear that pheromones are essential in triggering this behavior (Hudson and Distel, 1983), there is no direct evidence that the accessory olfactory system is essential in mediating it, and in fact the main olfactory system is clearly implicated by some of these findings such as nipple search.
Instead, studies have suggested that these behaviors do not depend on the vomeronasal to accessory olfactory bulb system (Hudson and Distel, 1986) and that maternal odors induce immediate early genes in the main, but not accessory olfactory bulbs in neonatal ferrets (Chang et al., 2001). Based on the results presented here, the circuitry of the vomeronasal system is functional, yet highly imprecise at early time points of postnatal life. Given the time course of the morphological refinement that we see, both with regard to VSN axonal coalesce and mitral cell dendritic clustering, as well as the effect of activity we show here, it may be that exposure to stimuli in the postnatal animal is critical for directing the specificity of this connectivity. We propose that if the accessory olfactory system is playing a function in processing maternal olfactory information in newborn pups, it certainly is quite different than the function of this circuit in adult animals. Alternatively, the “function” of having early chemical access to the VNO might not be to regulate behavior but rather to allow activity to influence the development of the system.
Comparison to the main olfactory system
Development in the vomeronasal system has parallels with the main olfactory system in that axon coalescence into glomeruli occurs during the first few postnatal days (Potter et al., 2001). Evidence also suggests that these receptor neuron axons play a pivotal role in glomerular formation (Treloar et al., 1999). Similarly, mitral cell dendritic development in the main olfactory bulb resembles that of the AOB with immature mitral cells extending multiple dendrites into the glomerular layer as late as P5 and show mature morphology by P10–15 (Matsutani and Yamamoto, 2000; Blanchart et al., 2006). These dendritic endings also appear to cross the olfactory nerve layer/external plexiform layer border and unite with olfactory sensory neuron (OSN) axons by E16 (Blanchart et al., 2006), with electron microscopy highlighting the appearance of functional synapses just before birth (Hinds and Hinds, 1976; Treloar et al., 1999; Blanchart et al., 2008). Electrophysiological studies have demonstrated monosynaptic olfactory receptor neuron input onto external tufted cells from the earliest time point studied (P1), consistent with the idea that these early circuits are functional (Grubb et al., 2008).
Axonal sorting into glomeruli
Similar timelines of development have also been reported for the main olfactory systems in both opossums and rats. After the coalescence of OSN axons into glomeruli early in development, immature mitral cells exhibit multiple primary dendrites which innervate several adjacent glomeruli that, with maturation, retract to leave a single primary dendrite bearing a glomerular tuft. (Malun and Brunjes, 1996). Given these similarities, it is possible that, as in the main olfactory bulb, presynaptic axonal sorting in the AOB into specific glomeruli may be determined by the identity imparted by the receptor itself to guide axons and mediate homotypic interactions (Feinstein and Mombaerts, 2004) or by activity-dependent mechanisms mediated by particular ion channels such as hyperpolarization-activated cation channels, which have been suggested to mediate axon outgrowth and coalescence in olfactory sensory neurons (Mobley et al., 2010). Likewise, this time course of glomerular maturation of V2r1b-expressing receptor neuron axons may proceed along different time courses compared to the maturation of other receptor types (Zou et al., 2004) and could possibly be also guided by receptor axon–glial interactions (Bailey et al., 1999).
Mitral cell dendritic development
Although little is known about the role of OSNs in regulating mitral cell development, in vitro studies have suggested a role for trophic activity in the main olfactory epithelia that promote embryonic mitral and tufted cell dendritic elaboration (Tran et al., 2008). Given the presence of synaptic contacts at or before birth in the present study, and the fact that the strong activation of sensory neurons perturbs glomerular refinement, it seems likely that contact-mediated interactions between sensory neurons and mitral cells may play a role in mitral cell dendritic targeting and morphology.
Indeed, this activity-dependent regulation has been implicated in the differentiation and removal of secondary dendrites in mitral cells of the main olfactory bulb with OCNC1KN animals displaying slightly delayed dendritic pruning (Lin et al., 2000). Furthermore, unilateral naris closure at P1 results in an increase in the percentage of mature mitral cells having multiple primary dendrites (Matsutani and Yamamoto, 2000). However, in order for us to directly test the effect of activity on dendritic clustering, we would need a means of identifying and reconstructing mitral cells known to receive input from V2r1b-expressing sensory neurons. Given that individual GFP-positive glomeruli cannot be identified live in slice until close to P12, it prohibited us from electroporating very young glomeruli to examine specific mitral cells in exposed animals. Despite this limitation, our data strongly suggest that these mechanisms play a role in regulating the dendritic development of mitral cells in the AOB.
Footnotes
This work was funded by National Institute on Deafness and Other Communication Disorders Grants R01 DC005798-01 and R21 DC006631-01 (N.N.U.), and National ResService Award predoctoral fellowship F31 DC009376-01 (K.R.H.). We are thankful to the Molecular Biosensor and Imaging Center at Carnegie Mellon University for the use of their confocal microscope and the Center for Molecular Analysis for the use of their mass spectrometer (NSF DBI-9729351).
References
- Bailey MS, Puche AC, Shipley MT. Development of the olfactory bulb: evidence for glia-neuron interactions in glomerular formation. J Comp Neurol. 1999;415:423–448. [PubMed] [Google Scholar]
- Belluscio L, Koentges G, Axel R, Dulac C. A map of pheromone receptor activation in the mammalian brain. Cell. 1999;97:209–220. doi: 10.1016/s0092-8674(00)80731-x. [DOI] [PubMed] [Google Scholar]
- Blanchart A, De Carlos JA, López-Mascaraque L. Time frame of mitral cell development in the mice olfactory bulb. J Comp Neurol. 2006;496:529–543. doi: 10.1002/cne.20941. [DOI] [PubMed] [Google Scholar]
- Blanchart A, Romaguera M, García-Verdugo JM, de Carlos JA, López-Mascaraque L. Synaptogenesis in the mouse olfactory bulb during glomerulus development. Eur J Neurosci. 2008;27:2838–2846. doi: 10.1111/j.1460-9568.2008.06283.x. [DOI] [PubMed] [Google Scholar]
- Brennan PA, Keverne EB. Neural mechanisms of mammalian olfactory learning. Prog Neurobiol. 1997;51:457–481. doi: 10.1016/s0301-0082(96)00069-x. [DOI] [PubMed] [Google Scholar]
- Chang YM, Kelliher KR, Baum MJ. Maternal odours induce Fos in the main but not the accessory olfactory bulbs of neonatal male and female ferrets. J Neuroendocrinol. 2001;13:551–560. doi: 10.1046/j.1365-2826.2001.00670.x. [DOI] [PubMed] [Google Scholar]
- Coppola DM, Millar LC. Stimulus access to the accessory olfactory system in the prenatal and perinatal rat. Neuroscience. 1994;60:463–468. doi: 10.1016/0306-4522(94)90257-7. [DOI] [PubMed] [Google Scholar]
- Coppola DM, O'Connell RJ. Stimulus access to olfactory and vomeronasal receptors in utero. Neurosci Lett. 1989;106:241–248. doi: 10.1016/0304-3940(89)90170-5. [DOI] [PubMed] [Google Scholar]
- Coppola DM, Budde J, Millar L. The vomeronasal duct has a protracted postnatal-development in the mouse. J Morphol. 1993;218:59–64. doi: 10.1002/jmor.1052180105. [DOI] [PubMed] [Google Scholar]
- Del Punta K, Puche A, Adams NC, Rodriguez I, Mombaerts P. A divergent pattern of sensory axonal projections is rendered convergent by second-order neurons in the accessory olfactory bulb. Neuron. 2002;35:1057–1066. doi: 10.1016/s0896-6273(02)00904-2. [DOI] [PubMed] [Google Scholar]
- Dulac C, Torello AT. Molecular detection of pheromone signals in mammals: from genes to behaviour. Nat Rev Neurosci. 2003;4:551–562. doi: 10.1038/nrn1140. [DOI] [PubMed] [Google Scholar]
- Feinstein P, Mombaerts P. A contextual model for axonal sorting into glomeruli in the mouse olfactory system. Cell. 2004;117:817–831. doi: 10.1016/j.cell.2004.05.011. [DOI] [PubMed] [Google Scholar]
- Grubb MS, Nissant A, Murray K, Lledo PM. Functional maturation of the first synapse in olfaction: development and adult neurogenesis. J Neurosci. 2008;28:2919–2932. doi: 10.1523/JNEUROSCI.5550-07.2008. [DOI] [PMC free article] [PubMed] [Google Scholar]
- Guo J, Zhou A, Moss RL. Urine and urine-derived compounds induce c-fos mRNA expression in accessory olfactory bulb. Neuroreport. 1997;8:1679–1683. doi: 10.1097/00001756-199705060-00024. [DOI] [PubMed] [Google Scholar]
- He J, Ma L, Kim S, Nakai J, Yu CR. Encoding gender and individual information in the mouse vomeronasal organ. Science. 2008;320:535–538. doi: 10.1126/science.1154476. [DOI] [PMC free article] [PubMed] [Google Scholar]
- Hinds JW, Hinds PL. Synapse formation in mouse olfactory-bulb. II. Morphogenesis. J Comp Neurol. 1976;169:41–61. doi: 10.1002/cne.901690104. [DOI] [PubMed] [Google Scholar]
- Hovis KR, Padmanabhan K, Urban NN. A simple method of in vitro electroporation allows visualization, recording, and calcium imaging of local neuronal circuits. J Neurosci Methods. 2010;191:1–10. doi: 10.1016/j.jneumeth.2010.05.017. [DOI] [PMC free article] [PubMed] [Google Scholar]
- Hudson R, Distel H. Nipple location by newborn rabbits: behavioral evidence for pheromonal guidance. Behaviour. 1983;85:260–275. [Google Scholar]
- Hudson R, Distel H. Pheromonal release of suckling in rabbits does not depend on the vomeronasal organ. Physiol Behav. 1986;37:123–128. doi: 10.1016/0031-9384(86)90394-x. [DOI] [PubMed] [Google Scholar]
- Hudson R, Labra-Cardero D, Mendoza-Soylovna A. Sucking, not milk, is important for the rapid learning of nipple-search odors in newborn rabbits. Dev Psychobiol. 2002;41:226–235. doi: 10.1002/dev.10073. [DOI] [PubMed] [Google Scholar]
- Inamura K, Kashiwayanagi M, Kurihara K. Regionalization of Fos immunostaining in rat accessory olfactory bulb when the vomeronasal organ was exposed to urine. Eur J Neurosci. 1999;11:2254–2260. doi: 10.1046/j.1460-9568.1999.00646.x. [DOI] [PubMed] [Google Scholar]
- Jia C, Goldman G, Halpern M. Development of vomeronasal receptor neuron subclasses and establishment of topographic projections to the accessory olfactory bulb. Brain Res Dev Brain Res. 1997;102:209–216. doi: 10.1016/s0165-3806(97)00097-7. [DOI] [PubMed] [Google Scholar]
- Leinders-Zufall T, Brennan P, Widmayer P, Chandramani S P, Maul-Pavicic A, Jäger M, Li XH, Breer H, Zufall F, Boehm T. MHC class I peptides as chemosensory signals in the vomeronasal organ. Science. 2004;306:1033–1037. doi: 10.1126/science.1102818. [DOI] [PubMed] [Google Scholar]
- Leinders-Zufall T, Ishii T, Mombaerts P, Zufall F, Boehm T. Structural requirements for the activation of vomeronasal sensory neurons by MHC peptides. Nat Neurosci. 2009;12:1551–1558. doi: 10.1038/nn.2452. [DOI] [PubMed] [Google Scholar]
- Lin DM, Wang F, Lowe G, Gold GH, Axel R, Ngai J, Brunet L. Formation of precise connections in the olfactory bulb occurs in the absence of odorant-evoked neuronal activity. Neuron. 2000;26:69–80. doi: 10.1016/s0896-6273(00)81139-3. [DOI] [PubMed] [Google Scholar]
- Luo M, Fee MS, Katz LC. Encoding pheromonal signals in the accessory olfactory bulb of behaving mice. Science. 2003;299:1196–1201. doi: 10.1126/science.1082133. [DOI] [PubMed] [Google Scholar]
- Malun D, Brunjes PC. Development of olfactory glomeruli: temporal and spatial interactions between olfactory receptor axons and mitral cells in opossums and rats. J Comp Neurol. 1996;368:1–16. doi: 10.1002/(SICI)1096-9861(19960422)368:1<1::AID-CNE1>3.0.CO;2-7. [DOI] [PubMed] [Google Scholar]
- Matsutani S, Yamamoto N. Differentiation of mitral cell dendrites in the developing main olfactory bulbs of normal and naris-occluded rats. J Comp Neurol. 2000;418:402–410. [PubMed] [Google Scholar]
- Mobley AS, Miller AM, Araneda RC, Maurer LR, Müller F, Greer CA. Hyperpolarization-activated cyclic nucleotide-gated channels in olfactory sensory neurons regulate axon dxtension and glomerular formation. J Neurosci. 2010;30:16498–16508. doi: 10.1523/JNEUROSCI.4225-10.2010. [DOI] [PMC free article] [PubMed] [Google Scholar]
- Potter SM, Zheng C, Koos DS, Feinstein P, Fraser SE, Mombaerts P. Structure and emergence of specific olfactory glomeruli in the mouse. J Neurosci. 2001;21:9713–9723. doi: 10.1523/JNEUROSCI.21-24-09713.2001. [DOI] [PMC free article] [PubMed] [Google Scholar]
- Raihani G, González D, Arteaga L, Hudson R. Olfactory guidance of nipple attachment and suckling in kittens of the domestic cat: inborn and learned responses. Dev Psychobiol. 2009;51:662–671. doi: 10.1002/dev.20401. [DOI] [PubMed] [Google Scholar]
- Ramon y Cajal S. Reprint. Madrid: Consejo Superior de Investigaciones Cientificas; 1911. Histologie du système nerveux de l'homme et des vertébrés. 1952. [Google Scholar]
- Rodriguez I, Feinstein P, Mombaerts P. Variable patterns of axonal projections of sensory neurons in the mouse vomeronasal system. Cell. 1999;97:199–208. doi: 10.1016/s0092-8674(00)80730-8. [DOI] [PubMed] [Google Scholar]
- Roos J, Roos M, Schaeffer C, Aron C. 1988 Sexual differences in the. [Google Scholar]
- Schneider NY, Fletcher TP, Shaw G, Renfree MB. The vomeronasal organ of the tammar wallaby. J Anat. 2008;213:93–105. doi: 10.1111/j.1469-7580.2008.00933.x. [DOI] [PMC free article] [PubMed] [Google Scholar]
- Schneider NY, Fletcher TP, Shaw G, Renfree MB. The olfactory system of the tammar wallaby is developed at birth and directs the neonate to its mother's pouch odours. Reproduction. 2009;138:849–857. doi: 10.1530/REP-09-0145. [DOI] [PubMed] [Google Scholar]
- Takami S, Graziadei PP. Morphological complexity of the glomerulus in the rat accessory olfactory bulb–a Golgi study. Brain Res. 1990;510:339–342. doi: 10.1016/0006-8993(90)91387-v. [DOI] [PubMed] [Google Scholar]
- Tran H, Chen H, Walz A, Posthumus JC, Gong Q. Influence of olfactory epithelium on mitral/tufted cell dendritic outgrowth. PLoS One. 2008;3:e3816. doi: 10.1371/journal.pone.0003816. [DOI] [PMC free article] [PubMed] [Google Scholar]
- Treloar HB, Purcell AL, Greer CA. Glomerular formation in the developing rat olfactory bulb. J Comp Neurol. 1999;413:289–304. [PubMed] [Google Scholar]
- Urban NN, Castro JB. Tuft calcium spikes in accessory olfactory bulb mitral cells. J Neurosci. 2005;25:5024–5028. doi: 10.1523/JNEUROSCI.0297-05.2005. [DOI] [PMC free article] [PubMed] [Google Scholar]
- Wagner S, Gresser AL, Torello AT, Dulac C. A multireceptor genetic approach uncovers an ordered integration of VNO sensory inputs in the accessory olfactory bulb. Neuron. 2006;50:697–709. doi: 10.1016/j.neuron.2006.04.033. [DOI] [PubMed] [Google Scholar]
- Weiler E, McCulloch MA, Farbman AI. Proliferation in the vomeronasal organ of the rat during postnatal development. Eur J Neurosci. 1999;11:700–711. doi: 10.1046/j.1460-9568.1999.00476.x. [DOI] [PubMed] [Google Scholar]
- Wysocki CJ, Wellington JL, Beauchamp GK. Access of urinary nonvolatiles to the mammalian vomeronasal organ. Science. 1980;207:781–783. doi: 10.1126/science.7352288. [DOI] [PubMed] [Google Scholar]
- Yamaguchi T, Inamura K, Kashiwayanagi M. Increases in Fos-immunoreactivity after exposure to a combination of two male urinary components in the accessory olfactory bulb of the female rat. Brain Res. 2000;876:211–214. doi: 10.1016/s0006-8993(00)02651-2. [DOI] [PubMed] [Google Scholar]
- Zou DJ, Feinstein P, Rivers AL, Mathews GA, Kim A, Greer CA, Mombaerts P, Firestein S. Postnatal refinement of peripheral olfactory projections. Science. 2004;304:1976–1979. doi: 10.1126/science.1093468. [DOI] [PubMed] [Google Scholar]