

Abstract
Axonal spheroids occur as part of the pathology of a variety of neurologic diseases. Reactive oxygen species (ROS) trigger formation of spheroids, axonal severing, and Ca2+ overload. The mechanisms by which ROS lead to the spheroid formation at specific axonal sites remain elusive. Here, using adult mouse primary neurons, we investigate the role of Ca2+, its regulating systems, and cytoskeletal changes in formation of axonal spheroids triggered by ROS. The results reveal that dramatically higher axoplasmic Ca2+ levels occur at the sites of axonal spheroids than in the rest of the axon. High focal axoplasmic Ca2+ levels correlate with focal aggregation of the reverse Na+/Ca2+ exchanger 1, voltage-gated N-type Ca2+ channel α1B subunit, and actin at the sites of spheroids in individual axons. This study provides new insights into the mechanism of a spheroid formation at specific sites along axons undergoing oxidative stress and a basis for new neuroprotective strategies.
Introduction
Oxidative stress is common in a number of neurologic diseases, such as multiple sclerosis (MS), ischemia, amyotrophic lateral sclerosis, Alzheimer's disease, Huntington's disease, and Parkinson's disease (Sayre et al., 2008). Characteristic morphology of neurodegeneration, axonal spheroids, is also found in these disorders. In a mouse model of MS, experimental autoimmune encephalomyelitis (EAE), it has recently been shown that inflammatory processes lead to an increase in extracellular reactive oxygen species (ROS) in acute EAE lesions (Nikić et al., 2011). This in vivo study established a direct link between high extracellular ROS and the formation of axonal spheroids and subsequent severing of the axons at the site of spheroid formation. These morphological changes are characteristic of Wallerian-like degeneration (Beirowski et al., 2010), which is recognized as a primary pathologic event in a number of neurologic disorders where it precedes neuronal cell body injury. These observations suggest that ROS may be an important cause of formation of axonal spheroids and degeneration in a variety of neurologic diseases.
Formation of axonal spheroids begins with the creation of smaller axonal swellings (Coleman, 2005). To date, a number of events associated with spheroid formation have been described and include increases in extracellular ROS, global axoplasmic Ca2+ increases, aggregation of dysfunctional mitochondria, and protease activation (Coleman, 2005; Nikić et al., 2011; Wang et al., 2012). Essential for neuroprotective strategies, spheroid formation may be a reversible process as shown by a direct application of an antioxidant mixture in vivo (Nikić et al., 2011). However, the molecular details of how spheroids form at particular axonal sites are uncertain.
Extracellular ROS trigger an increase in neuronal Ca2+ (Barsukova et al., 2011b), which has been steadily emerging as a key player in neurodegeneration. Quenching or removal of extracellular Ca2+ has been shown to be most effective in preventing spheroid formation in neuronal cultures (Beirowski et al., 2010). Regulation of axoplasmic Ca2+ involves interplay of Ca2+ channels, Na+/Ca2+ exchanger on the axolemma, and endoplasmic reticulum and mitochondria within the axoplasma. Therefore, elucidating the role of these Ca2+-regulating systems in spheroid formation is critical to a development of neuroprotective strategies. Here, using high-resolution imaging, we investigate Ca2+-regulating systems and focal Ca2+ elevation at sites of axonal spheroids in live cortical neurons from adult and postnatal mice during exposure to ROS. Our results establish specific roles for the reverse Na+/Ca2+ exchanger 1 (NCX1) and voltage-gated N-type Ca2+ channel (VGCC) α1B subunit in ROS-mediated focal axoplasmic Ca2+ elevation at the sites of axonal spheroid formation. The findings suggest that NCX1 and VGCC aggregation, associated with actin aggregation, drives dramatic focal increases of axoplasmic Ca2+. Prevention of ROS-driven focal Ca2+rise, spheroid formation and axonal severing in the presence of ROS is successfully achieved by inhibition of the reverse NCX1, N-type, and L-type VGCCs or with the actin stabilizing agent. This study provides new insights into the mechanism of a spheroid formation at specific sites along axons undergoing oxidative stress.
Materials and Methods
Cell cultures and transfection.
Primary cortical cultures were prepared from adult 2- to 4-month-old and postnatal day 0 (P0) wild-type B6 mice of either sex as described previously (Nathan et al., 2004; Barsukova et al., 2011a,b). The entire cerebral cortex was dissected from the brain and placed in 2 ml of B27/Hibernate A medium (B27/HA; Invitrogen) with 0.5 mm glutamine (Sigma-Aldrich) at 4°C. The cortex was sliced (0.5 mm thickness) and transferred to a 50 ml tube containing 5 ml of B27/HA. After warming for 8 min at 30°C, slices were digested with 6 ml of a 2 mg/ml papain (Sigma-Aldrich) solution in B27/HA for 30 min at 30°C in a gyrating water bath. The slices were transferred to 2 ml of B27/HA. After 2 min at room temperature, the slices were triturated 10 times with a siliconized 9 inch Pasteur pipette and allowed to settle for 1 min. Approximately 2 ml of the supernatant was transferred to another tube, and the sediment was resuspended in 2 ml of B27/HA. The above step was repeated twice, and a total of 6 ml was collected. The resultant supernatant was subjected to density gradient centrifugation at 800 × g for 15 min. The density gradient was prepared in four 1 ml layers of 35, 25, 20, and 15% Optiprep (Invitrogen) in B27/HA medium (v/v). Debris above the neuron-enriched fraction was discarded. The neuron-enriched fraction was collected and diluted in 5 ml of B27/HA. After centrifuging twice at 200 × g for 2 min., the cell pellets were resuspended in 3 ml of B27/Neurobasal A medium (Invitrogen) with 0.5 mm glutamine and 0.01 mg/ml gentamicin (Sigma-Aldrich). For transfection, neuronal pellets were resuspended in 100 μl of nucleofection solution with 3 μg/ml of each plasmid construct and electroporated following an electroporation system (Amaxa Biosystems) for neurons, modified by the use of a Ca2+-free buffer immediately after the electroporation, which maintained neuronal viability (Barsukova et al., 2011a,b). A total of 3 × 10⁴ cells were plated in 30 μl aliquots in the center of glass coverslips (25 mm diameter) that were coated overnight with poly-d-lysine (50 mg/ml; Sigma-Aldrich). After a 1 h incubation in a humidified incubator at 37°C and 5% CO2, each coverslip was rinsed with B27/HA and transferred to a six-well plate containing B27/neurobasal A medium. Routinely, 10% of adult neurons were successfully transfected, and the signal was detectable at 48 h after transfection.
Constructs.
For imaging of axonal β-tubulin III, F-actin, and mitochondria, neurons were transfected with genetically encoded constructs EGFP-TubbIII, RFP-actin, and mito-RFP, respectively, kindly provided by Dr. G. Banker (Oregon Health & Science University, Portland, OR).
Reverse Na+/Ca2+ exchanger and Ca2+ channel blockers.
Reverse Na+/Ca2+ exchanger was blocked with 1 μm KB-R7943 (Sigma-Aldrich), the concentration below the range capable of blocking mitochondrial Ca2+ uniporter. N-type VGCCs were blocked by a 30 min pretreatment with 50 nm ω-conotoxin GVIA (Sigma-Aldrich). L-type VGCCs were blocked by pretreatment with 1 μm amlodipine (Sigma-Aldrich) for 30 min.
Ca2+ and Na+ measurement.
For axoplasmic Ca2+ measurements, neurons were loaded with ratiometric Ca2+ dyes fura-2 AM or fura-FF (340 and 380 nm excitation, 505 nm emission; Invitrogen) (Fig. 1A). The results reported by fura-2 (high-affinity calcium indicator) were compared with cytosolic Ca2+ response reported by fura-2FF (low-affinity calcium indicator). Consequently, fura-FF was not used because it did not accurately report changes in Ca2+ levels in neurons of either age in response to H2O2. For axoplasmic Na+ measurements, neurons were loaded with ratiometric Na+ dye SBFI (340 and 380 nm excitation, 505 nm emission; Invitrogen). Cells were incubated with 5 μm fura-2 AM or SBFI in imaging buffer (in mm: 142 NaCl, 4 NaHCO3, 10 Na-HEPES, 2.5 KCl, 1.2 MgCl2, 2 CaCl2, and 10 glucose, pH 7.4) containing 2% BSA (Sigma-Aldrich) and 0.01% pluronic acid at 37°C for 20 min or 2 h, respectively (Barsukova et al., 2011a,b). Cells were washed with imaging buffer containing 0.25% BSA for 10 min at 37°C before recording.
Figure 1.

Real-time axoplasmic Ca2+ response to ROS in adult and postnatal cortical neurons. A, Image of a cultured cortical neuron from an adult mouse loaded with fura-2 (60×, oil). In red boxes are 20–30 μm axonal segments chosen for high-resolution imaging. Scale bar, 10 μm. B, Representative axonal segment used for axoplasmic Ca2+ analysis (super-high resolution, 150×, oil). Scale bar, 5 μm. C, Axoplasmic Ca2+ response to 100 μm H2O2 in adult neurons (n = 16 cells). D, Axoplasmic Ca2+ response in P0 neurons (n = 23 cells). Before treatments, axoplasmic Ca2+ levels among neurons of both ages were similar (0–1 min). E, Absence of axonal spheroids in P0 neurons at 30 min of H2O2 exposure (n = 18 cells).
Fluorescence live imaging.
Imaging was performed after 4–5 d in culture. Neurons were treated with 50 or 100 μm H2O2 for 30 min starting at 1 min in the presence of a 5% CO2 air mixture at 37°C (heated stage; Warner Instruments). Before H2O2 treatment, axoplasmic Ca2+ or Na+ levels among neurons of either age were similar. Neurons were also treated with 90 mm potassium chloride (Sigma-Aldrich). Imaging was performed using an inverted microscope (IX81; Olympus) equipped with a cooled CCD camera (Cascade II; Intelligent Imaging Innovations), a high-speed wavelength switcher (Lambda DG-5; Sutter Instruments) controlled by SlideBook software (Intelligent Imaging Innovations), and appropriate Chroma filters. Exposure time was 500 ms, and frames were taken every 10 s. Axoplasmic Ca2+ and Na+ were evaluated in various axonal segments, from 2 to 30 μm, with 1500 magnification (Olympus; 150×, UPlan, NA 1.45, oil) (Fig. 1A,B).
Immunocytochemistry.
Neurons were fixed with ice-cold acetone for 5 min, rinsed with cold PBS, permeabilized for 15 min in 0.02% Triton X-100, and blocked in 1% BSA for 1 h. Neurons were then treated with rabbit anti-calcium channel (α1B subunit, N-type channel) antibody (Sigma-Aldrich) or NCX1 antibody (Covance), 1:1000 in 1% BSA for 2 h. After three washes with PBS, neurons were treated with appropriate anti-rabbit RFP or anti-mouse GFP secondary antibodies (1:200; Invitrogen) for 30 min. After three washes with PBS, neurons were coated with anti-photobleach oil, and coverslips were sealed.
Image analysis.
Fluorescence changes in axoplasm were evaluated using SlideBook software version 4.2.0. The background fluorescence was taken from fields not containing axons. Data obtained from 10–50 segments per axon were averaged to represent the response per cell (10–15 cells per experiment).
Statistical analysis.
Each experiment was replicated three times using neurons obtained from three different animals per age (n = 3). Data from each experiment were analyzed by t test or one-way ANOVA with SPSS statistical software. The data from all evaluated cells from all animals per age group are presented as mean ± SEM in the bar graphs described in Results.
Results
Neuronal model
To investigate the effect of extracellular ROS on axoplasmic Ca2+ and the role of elevated Ca2+ in spheroid formation, we established a neuronal model based on primary cultured cortical neurons from adult mice after comparing these cultures with the more commonly used P0 primary cortical neurons. We used pathophysiological levels of hydrogen peroxide previously detected in the brain in vivo during ischemia (Hyslop et al., 1995) and used in an in vivo spheroid formation study (Nikić et al., 2011). In each case, axoplasmic Ca2+ was assessed with fura-2 during 30 min exposure to H2O2 at 100 μm. A remarkable difference in axoplasmic Ca2+ elevation, measured in 20–30 μm axonal segments, was detected between neuronal ages. By 15 min, Ca2+ in P0 axons did not significantly change from the base level, while in adult axons it doubled (Fig. 1C,D). By 30 min, P0 axons had only a 1.8-fold fura-2 fluorescence rise, whereas in adult axons the fluorescence rise reached a 3.6-fold increase, twice the level of P0 axons (Fig. 1C,D; Student's t test, **p < 0.01). By 30 min, adult axons showed formation of spheroids (Fig. 2A,B) whereas the P0 axons did not (Fig. 1E). There were thus significant differences in responses of cultured adult and P0 axons within the first 30 min of exposure to H2O2. For all other studies, we selected the adult neurons based on rapid dynamic changes in their axons, which were not observed in postnatal cultures and as more representative of what occurs in neurons in adult EAE mice (Nikić et al., 2011) and in adult-onset diseases in humans, such as MS.
Figure 2.
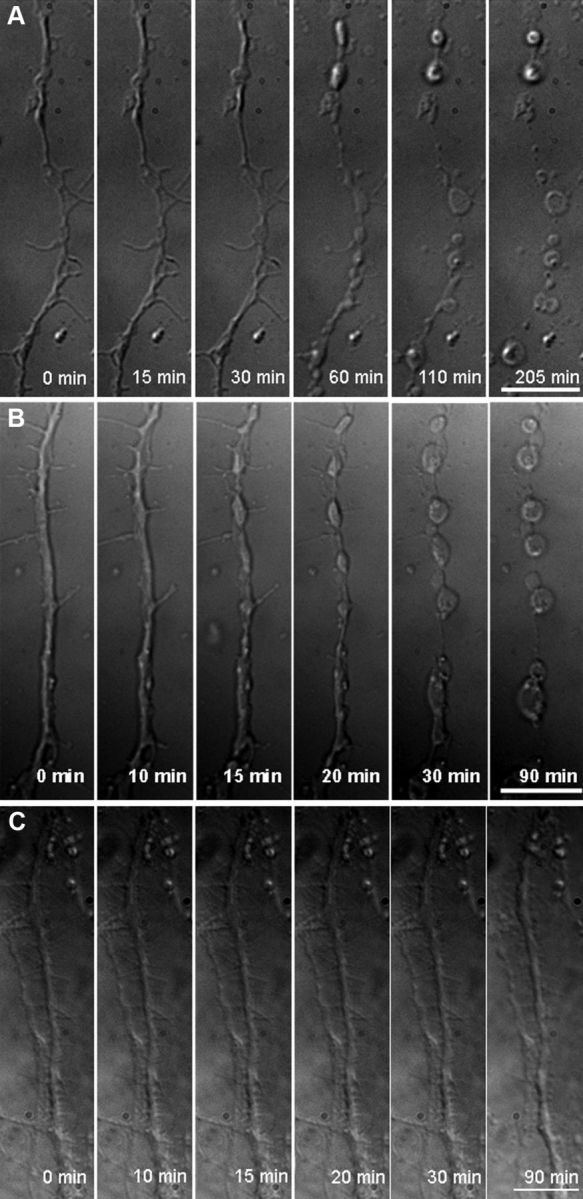
Spheroid formation and severing of axons triggered by ROS in live adult neurons. A, Swellings form at 30 min, spheroids form at 60 min, and an axon severs by 205 min in the presence of 50 μm H2O2 (n = 9 cells). B, Swellings appear at 15 min, spheroids appear by 30 min, and an axon severs by 90 min in the presence of 100 μm H2O2 (n = 15 cells). C, In the absence of H2O2, imaging stress leads only to axonal swellings by 90 min (n = 5 cells) (150×, oil). Scale bar, 10 μm.
Spheroid formation and axoskeletal changes
Axonal morphology and axoskeletal changes in live adult neurons were examined during oxidative stress with high magnification (150× lens). Morphology of 40–50 μm axonal segments was followed with time-lapse differential interference contrast (DIC) microscopy. H2O2 was continuously present starting at min 1. After continuous exposure to H2O2, axons underwent progressive morphologic changes. Formation of focal swellings in axons began at ∼30 min in response to 50 μm H2O2 (Fig. 2A) and ∼15 min in response to 100 μm H2O2 (Fig. 2B). Swellings progressed to spheroids around 60 and 30 min for 50 μm H2O2 and 100 μm H2O2, respectively (Fig. 2A,B). At the same time, segments of axons between the spheroids decreased in diameter. Disruption of axons at spheroids occurred at ∼205 min with 50 μm H2O2 and ∼90 min with 100 μm H2O2 (Fig. 2A,B). Therefore, the timing of development of swellings, formation of spheroids, and axonal severing occurred in an H2O2 concentration-dependent manner. To minimize the contribution of the imaging stress, which led to axonal swellings by 90 min (Fig. 2C) and severing at about 6 h in the absence of H2O2, 100 μm H2O2 was chosen for all other experiments.
The formation of spheroids coincided with changes in mitochondria, β-tubulin III, and F-actin. Changes in mitochondrial morphology in live neurons and its colocalization with spheroids were detected by the use of mitochondrially targeted genetic construct mito-RFP (Fig. 3A,B). Swelling and rounding of mitochondria began ∼15 min of exposure. Swollen mitochondria were localized within the spheroids by 30 min.
Figure 3.

Cytoskeletal changes in axons of live adult neurons during spheroid formation triggered by ROS. A, Axon of a neuron transfected with fluorescent constructs labeling β-tubulin III (green) and mitochondria (red). B, Colocalization of rounded mitochondria and tubulin in spheroids after 30 min exposure to 100 μm H2O2 (n = 12 cells). C, Neurons transfected with a fluorescent construct for F-actin (red). D, Aggregation of F-actin in spheroids after 30 min exposure to 100 μm H2O2 (n = 15 cells). E, Quantification of fluorescence intensities of tubulin and F-actin inside and outside the spheroids at 30 min (one-way ANOVA, **p < 0.001). A.U., Arbitrary units. F, Pretreatment with 1 μm Taxol does not prevent spheroid formation (image at 30 min of H2O2 exposure; n = 10 cells). G, Pretreatment with cytochalasin D (10 μg/ml) attenuates spheroid formation (image at 30 min of H2O2 exposure; n = 9 cells; 150×, oil). Scale bars, 10 μm.
β-Tubulin III and F-actin were labeled with the genetic constructs EGFP-TubbIII and RFP-actin, respectively. Before the application of H2O2, actin was more concentrated in the philopodia of axon terminals and at points of axonal branching, whereas tubulin was evenly distributed along axons. Dynamic changes in tubulin and F-actin were detected during spheroid formation. Significantly higher fluorescence density of tubulin and actin labeling was detected in spheroids than in segments outside the spheroids of live neurons at 30 min with 100 μm H2O2 exposure (Fig. 3A–E). Faster actin responses in a form of aggregation occurred in the retracting philopodia and small axonal branches than along the axon during the H2O2 treatment (Fig. 3C,D).
Pretreatment of neurons with tubulin-stabilizing agent Taxol did not prevent spheroid formation (Fig. 3, compare F, B). Pretreatment with the actin-stabilizing agent cytochalasin D greatly attenuated spheroid formation (Fig. 3, compare G, D); only formation of swelling was observed at 30 min, which did not progress to spheroid formation. These data demonstrate that spheroid formation and narrowing of an axon between spheroids is accompanied by active cytoskeletal restructuring during oxidative stress and, as has been described in vivo, by morphologic changes in mitochondria (Nikić et al., 2011).
Axoplasmic Ca2+ in spheroids
Global increases of axoplasmic Ca2+ have been previously associated with axonal spheroid formation and disruption. Because distinct microdomains with transient high focal Ca2+ were previously demonstrated in healthy neurons (Chen et al., 2011), we sought to determine whether axoplasmic Ca2+ increased uniformly along axons undergoing oxidative stress or whether there might be focal increases at sites of spheroid formation. To determine this, we measured axoplasmic Ca2+ response to H2O2 in 2–3 μm axonal segments (Fig. 4F) instead of 20–30 μm segments used in initial studies (Fig. 1A). Such measurements allowed for comparison of Ca2+ levels inside the spheroids and in the segments between the spheroids (Fig. 4A–F). Importantly, the ratiometric property of the Ca2+ dye fura-2 controls for the artifacts arising from volume change in the axon. For example, fura-2 reported a similar base level and a rise in Ca2+ in the neuronal soma, with its large volume, and in 20–30 μm axonal segments (Fig. 5A,B).
Figure 4.

Ca2+ in an axon of a live adult neuron during spheroid formation triggered by ROS. A–E, Axonal swelling formation at 15 min, followed by spheroids at 20–30 min, coincides with focal Ca2+ increase at spheroid sites as assessed by fura-2 (green) and DIC (gray) during 30 min exposure to 100 μm H2O2 (n = 15 cells; 150×, oil). Scale bar, 10 μm. F, Representative 2–3 μm regions chosen for focal Ca2+ analysis. G, Ca2+ levels at the sites of spheroids. H, Ca2+ levels in axonal segments between the spheroids.
Figure 5.

Fura-2 Ca2+ reporting is not affected by the sample thickness. A, Fura-2 (green) in a soma and an axon of an adult cortical neuron. In red boxes are areas of interest where Ca2+ was analyzed in response to H2O2. B, Identical Ca2+ increase reported by Fura-2 in a soma and an axon, regions that vary greatly in thickness. C, Removal of H2O2 after 10 min, instead of 30 min, results in only swellings and no spheroids by 30 min (right) in an axon of an adult neuron. D, Removal of H2O2 attenuates axoplasmic Ca2+ increase but does not lower it to baseline, as measured in 20–30 μm segments (n = 9 cells; compare response with Fig. 1C).
Analysis of a micrometer-range axoplasmic Ca2+ response to H2O2 showed a significant difference in Ca2+ at the sites of swelling and spheroid formation and the neighboring segments beginning at 15 min. A significantly higher Ca2+ level was detected at sites of swellings (Fig. 4C,G,H; 1.90 ± 0.18 vs 1.56 ± 0.13; Student's t test, **p < 0.001) before formation of spheroids. Subsequent formation of spheroids at 20 min continued to coincide with significantly higher Ca2+ within the spheroids than the neighboring segments (Fig. 4D,E,G,H; 4.06 ± 0.42 vs 2.63 ± 0.30; Student's t test, **p < 0.001). Removal of H2O2 after 10 min of exposure, when first swellings begin to form (Fig. 4C), prevented spheroid formation but not swellings, which still developed (Fig. 5C). Earlier removal of H2O2 attenuated further axoplasmic Ca2+ rise observed during 30 min exposure to H2O2, although axoplasmic Ca2+ did not return to baseline within 20 min (Fig. 5D). These results suggest the existence of a local Ca2+-regulating mechanism responsible for a significantly higher Ca2+ accumulation at the sites of spheroids.
Role of Ca2+ sources in spheroid formation
We next compared extracellular and intracellular Ca2+ contributions to axoplasmic Ca2+ elevation in response to H2O2. Varying axonal segments of adult neurons ranging from 2 to 30 μm were analyzed. Elimination of the extracellular Ca2+ led to a substantial reduction from 3.6-fold (Fig. 1C) to 2-fold by 30 min in fura-2 fluorescence rise and prevented axonal swellings and spheroid formation (Fig. 6A,B,I). Since the absence of extracellular Ca2+ did not completely abolish axoplasmic Ca2+ increases, the contribution of Ca2+ released from mitochondria to the H2O2-mediated cytosolic Ca2+ increase was next evaluated. Mitochondria released Ca2+ during exogenous oxidative stress via formation of permeability transition pore (PTP) (Barsukova et al., 2011b). Consequently, the absence of extracellular Ca2+ combined with application of cyclosporin A (CsA, 10 μm, 30 min pretreatment), which binds cyclophilin D (CyPD) and thereby inhibits PTP activation in mitochondria, completely abolished increases in axoplasmic Ca2+ (Fig. 6C,D,I) (Forte et al., 2007). CsA pretreatment alone in the presence of extracellular Ca2+ led to a significant axoplasmic Ca2+ reduction (Fig. 6E,F,I), and prevented axonal spheroid formation but did not prevent formation of axonal swellings (Fig. 6E). Another approach, which also leads to a sustained extracellular Ca2+ influx, was tested next. Neurons were subjected to a sustained depolarization with KCl, which led to spheroids formation within 4 min (Fig. 6H), strikingly faster when compared with 20 min in response to H2O2 (Fig. 1C). Fura-2 fluorescence rise reached threefold under KCl at 30 min (Fig. 6G). Together, these results demonstrate a primary role of extracellular Ca2+ and a secondary role of mitochondrial PTP activation in spheroid formation and axonal severing in response to ROS.
Figure 6.

Extracellular and intracellular Ca2+ contribution during spheroid formation triggered by ROS in adult neurons. A, B, Absence of extracellular Ca2+ prevents swellings/spheroids as it attenuates axoplasmic Ca2+ increase during 30 min exposure to 100 μm H2O2 and fura-2 (green) (n = 16 cells; 150×, oil). Scale bar, 10 μm. C, D, CsA combined with the absence of extracellular Ca2+ completely abolishes Ca2+ increase and swellings/spheroids (n = 8 cells). E, F, CsA in the presence of extracellular Ca2+ leads to only swellings and lowers Ca2+ increase (n = 12 cells). G, H, Sustained depolarization with KCl results in spheroids within 4 min (n = 11 cells). I, Ca2+ response to above treatments is compared with Ca2+ response to H2O2 in regular buffer measured in 20–30 μm segments (as shown in Fig. 1C) (one-way ANOVA, **p < 0.001).
Role of axolemmal Ca2+-regulating systems in spheroid formation
The axolemmal Ca2+ regulators, such as the reverse NCX of the plasma membrane and the VGCCs, have been implicated in anoxia, ischemia and MS pathology (Kornek et al., 2001; Pilitsis et al., 2001; Craner et al., 2004a,b; Brand-Schieber and Werner, 2004; Stys 2004, 2005; Annunziato et al., 2007; Tsutsui and Stys, 2012). NCX, operating in reverse mode, could pump Ca2+ into the cytoplasm while extruding Na+, opposite to its normal function of Ca2+ extrusion (Tsutsui and Stys, 2012). Consequently, we assessed whether ROS might stimulate reversal of NCX1 and thereby contribute to the axoplasmic Ca2+ elevation and spheroid formation. To examine this issue, axonal segments of adult neurons ranging from 2 to 30 μm were analyzed in the presence of the NCX1 inhibitor, KB-R7943, applied within 30 s of H2O2 exposure. The results showed that inhibition of NCX1 activity with a single application of KB-R7943 completely prevented swelling and spheroid formation and significantly attenuated axoplasmic Ca2+ elevation from 3.6-fold (Fig. 1C) to 1.8-fold at 30 min (Fig. 7A,B,K). Moreover, consequent application of KB-R7943 within 14 min of the first application completely abolished axoplasmic Ca2+ elevation under H2O2 (Fig. 7C,D,K). Remarkably, KB-R7943 completely prevented accelerated swelling and spheroid formation under sustained depolarization with KCl and lowered axoplasmic Ca2+ to the baseline by 15 min (compare Figs. 6G, H and 7E, F; at 15 min, 2.63 ± 0.72 vs 1.12 ± 0.17; at 30 min; 3.23 ± 0.82 vs 1.00 ± 0.09; Student's t test, **p < 0.0001). Pretreatment with N-type or L-type VGCC blockers, ω-conotoxin GVIA and amlodipine, respectively, attenuated axoplasmic Ca2+ increases, but less than did KB-R7953. Importantly, these blockers also prevented formation of swellings and spheroids (Fig. 7G–K). These results demonstrate the contributions of the reverse NCX1 and Ca2+ channels to axoplasmic Ca2+ rise and their key role in spheroid formation in response to ROS.
Figure 7.

Role of axolemmal Ca2+-regulating systems in spheroid formation triggered by ROS in adult neurons. A, B, KB-R7943, a reverse NCX1 inhibitor, prevents swellings/spheroids as it attenuates axoplasmic Ca2+ increase during 30 min exposure to 100 μm H2O2 and fura-2 (green) (n = 12 cells; 150×, oil). Scale bar, 10 μm. C, D, Dual sequential application of KB-R7943 completely abolishes Ca2+ increase and swellings/spheroids during 30 min exposure to H2O2 (n = 10 cells). E, F, KB-R7943 prevents spheroids and lowers Ca2+ during sustained depolarization with KCl (n = 16 cells). G–J, ω-Conotoxin (G, H), an N-type VGCC inhibitor, and amlodipine (I, J), an L-type VGCC inhibitor, prevent swellings/spheroids as they attenuate Ca2+ increase (n = 13 cells and n = 14 cells, respectively). K, Ca2+ response to above treatments is compared with Ca2+ response to H2O2 alone measured in 20–30 μm segments (as shown in Fig. 1C) (one-way ANOVA, **p < 0.001).
Aggregation of axolemmal Ca2+-regulating systems in spheroids
Distinct axoplasmic Ca2+ elevation within swellings/spheroids during exogenous oxidative stress, demonstrated in Figure 4, could be most easily explained by focal increased influx of extracellular Ca2+ at the sites of spheroid formation. This scenario would predict that NCX1 (operating in reverse mode) and N-type VGCC α1B subunit, previously shown to accumulate in axonal lesions in EAE (Kornek et al., 2001; Craner et al., 2004a), accumulate at sites of spheroid formation in response to ROS. Accordingly, we performed immunocytochemistry for these Ca2+-specific regulators implicated in MS in untreated neurons and in neurons exposed to H2O2. NCX1 and N-type VGCC α1B subunit were evenly distributed along untreated axons (Fig. 8A,C). However, after 30 min of H2O2 exposure, NCX1 and N-type VGCC α1B subunit were densely aggregated at the sites of axonal spheroids and sparsely distributed in axonal segments between the spheroids (Fig. 8B,D). Analysis of the fluorescence intensity showed a significant difference in intensity of NCX1 or N-type VGCC α1B immunolabeling between spheroids and axonal areas outside spheroids (Fig. 8E). In the absence of the permeabilization step, similar aggregation was observed (Fig. 8F,G). NCX1 or N-type VGCC α1B accumulation on the axolemma began by 15 min, before spheroid formation (Fig. 8H,I). Pretreatment of cultures with KB-R7943 or ω-conotoxin attenuated NCX1 or N-type VGCC α1B aggregation and spheroid formation (Fig. 8J,K). These data demonstrate ROS-driven aggregation of reverse NCX1 and N-type VGCC α1B subunit and suggest that the focal increase in Ca2+ at sites of future spheroid formation may result from the aggregation of NCX1 and Ca2+ channels at these sites.
Figure 8.

Aggregation of axolemmal Ca2+-regulating systems during spheroid formation triggered by ROS in adult neurons. A, NCX1 distribution in an untreated axon (green) (150×, oil). Scale bar, 5 μm. B, NCX1 aggregation in spheroids at 30 min of exposure to 100 μm H2O2 (n = 15 cells). C, N-type VGCC α1B subunit (red) distribution in an untreated axon. D, N-type VGCC α1B subunit aggregation in spheroids at 30 min of exposure to 100 μm H2O2 (n = 14 cells). E, Quantification of fluorescence intensities of NCX1 and N-type VGCC α1B subunit immunolabeling (one-way ANOVA, **p < 0.001). F, G, NCX1 (green) and N-type VGCC α1B subunit (red) aggregation in axolemma of spheroids at 30 min of exposure to 100 μm H2O2, in the absence of permeabilization (n = 9 cells and n = 10 cells, respectively). H, I, NCX1 and N-type VGCC α1B subunit aggregation before spheroid formation, at 15 min of exposure to H2O2 (n = 12 cells and n = 11 cells, respectively). J, K, Attenuation of NCX1 and N-type VGCC α1B subunit aggregation in the presence of KB-R7943 or ω-conotoxin (n = 14 cells and n = 12 cells, respectively). L, M, Axoplasmic Na+ response during spheroid formation triggered by ROS in adult neurons (n = 12 cells). L, Na+ levels at the sites of spheroids. M, Na+ levels in axonal segments between the spheroids.
Axoplasmic Na+ in spheroids
If NCX1 operates in reverse mode at sites of axonal swelling, Na+ would be extruded from the axoplasm by focal aggregation of NCX1 and reflected in uneven dynamic distribution of Na+ along the axon. To assess this and confirm our earlier results, we also assessed axoplasmic Na+ in spheroids and neighboring segments with the Na+-specific ratiometric dye SBFI. Axoplasmic Na+ increase was significantly lower within spheroids than in the segments outside the spheroids starting at 15 min in response to H2O2, as reported by SBFI fluorescence (Fig. 8L,M; at 15 min, 1.10 ± 0.14 vs 1.38 ± 0.19; at 30 min, 1.40 ± 0.15 vs 1.66 ± 0.21; Student's t test, **p < 0.001). The difference in Na+ between spheroids and segments outside is an inverted image of the differences in the case of Ca2+ (compare Figs. 4G, H and 8L, M). These results are consistent with the demonstrated aggregation of the reverse NCX1 at the sites of spheroids.
Discussion
While ROS-induced axonal spheroid formation and its association with increased axoplasmic Ca2+ have been described previously, the molecular details of the connection between Ca2+, spheroid formation, and axonal rupture are uncertain. In the present study, we demonstrate for the first time focal increases of axoplasmic Ca2+ that precede spheroid formation in axons exposed to ROS. In addition, we demonstrate the aggregation of the reverse NCX1, N-type VGCC, and actin at sites of focal Ca2+ increase and spheroids and the ability to block spheroid formation with inhibitors of NCX1, VGCC, and an actin-stabilizing agent. These findings suggest a series of concerted responses to ROS that lead to focal accumulations of the reverse NCX1 and N-type VGCC and focal increases in axoplasmic Ca2+ that result in spheroid formation and axonal disruption.
What key players determined the sites of spheroid formation? Our results show that focal increases in Ca2+ preceded spheroid formation. At 15 min of exposure to ROS, Ca2+ levels at the sites of future spheroids were significantly higher than in other axonal segments. By 30 min, fura-2 fluorescence rise in spheroids was over 1.5 times higher than in the rest of the axon. This difference in Ca2+ levels points to a key role of focal Ca2+ increase in spheroid formation. Focal high Ca2+ is consistent with transient high Ca2+ domains in healthy neurons (Chen et al., 2011). However, during ROS exposure these domains become persistent and mark sites of damage.
Our results demonstrate that extracellular Ca2+ is a primary source of ROS-mediated axoplasmic Ca2+ increase. Removal of extracellular Ca2+ was significantly more efficient in lowering axoplasmic Ca2+ and preventing spheroids than inhibition of mitochondrial Ca2+ stores release. The inhibition of the reverse NCX1 completely prevented Ca2+ increase and spheroid formation in the presence of ROS, suggesting that reverse NCX1 is responsible for the bulk of Ca2+ influx. A rise of axoplasmic Na+ preceded Ca2+ increase in response to ROS (Figs. 4G,H, 8L,M), suggesting the initial role of Na+ channels in rising Na+ and consequent activation of the reverse NCX1. The inhibition of N-type or L-type VGCCs also completely prevented spheroid formation in the presence of ROS and is consistent with neuroprotection achieved with the inhibition of N-type or L-type VGCCs in EAE and blocking N-type VGCC in autoimmune optic neuritis (Kornek et al., 2001; Brand-Schieber and Werner, 2004; Gadjanski et al., 2009). Interestingly, while preventing spheroid formation, blocking N-type or L-type VGCCs did not completely abolish Ca2+ rise. What conclusions can be drawn from these findings? First, the reverse NCX1-driven Ca2+ contribution is greater than the Ca2+ channel-driven Ca2+ contribution to ROS-mediated axoplasmic Ca2+ rise. Second, both axolemmal reverse NCX1 and Ca2+ channels play a key role in spheroid formation. Finally, the formation of spheroids seems to require a certain threshold of Ca2+ that needs to be reached, and inhibition of Ca2+ channels alone allows a Ca2+ rise that does not reach that threshold.
Focal aggregation of reverse NCX1 and N-type VGCC seems to be critical to spheroid formation. Our results show a high density of reverse NCX1 and N-type VGCC within spheroids after exposure to ROS. These findings are consistent with N-type VGCC α1B subunit aggregation in dystrophic axons in EAE and MS (Kornek et al., 2001) and colocalization of NCX and an axonal injury marker, β-amyloid precursor protein, in demyelinated axons in EAE (Craner et al., 2004a). Our data suggest that extracellular ROS lead to active axolemmal changes involving redistribution of NCX1 and VGCC; any swelling solely driven by changes in osmolarity would lead to a spreading of the axolemmal elements, organelles, and cytoskeleton, not focal aggregation. These findings suggest that the aggregation of the reverse NCX1 and N-type VGCC govern the excessive channeling of extracellular Ca2+ into the sites of spheroids. Furthermore, opposite dynamics of Ca2+ and Na+ increases inside and outside the spheroids confirms the role of focal aggregation of the reverse NCX1.
Other intra-axonal changes associated with spheroids were detected. Accumulation of swollen mitochondria in spheroids in response to ROS shown here and previously in vivo (Nikić et al., 2011) is likely to occur in response to high focal Ca2+ in spheroids, leading to opening of mitochondrial PTP (Barsukova et al., 2011b). It is plausible that ROS-driven activation of the PTP, loss of ATP, and release of pro-apoptotic agents are primary events responsible for spheroid formation. However, pretreatment of neurons with CsA, which inhibits PTP activation, did not prevent axonal swellings during ROS exposure. These results point to a secondary role of ROS-driven mitochondrial dysfunction in spheroid formation. A high density of fluorescent labeling for F-actin was found in spheroids. Since Ca2+ regulates actin dynamics (Brünig et al., 2004; Oertner and Matus, 2005; Akopian et al., 2006), F-actin aggregation within spheroids is likely to stem from the effect of Ca2+ rise on normal F-actin concentration at branching points (Andersen et al., 2011). Indeed, the majority of spheroids formed at branching points along the axon (Fig. 2A,B). Retraction of small branches preceded formation of spheroids at branching sites. Attenuation of spheroid formation with the actin-stabilizing agent cytochalasin D, shown here, and the reversible nature of spheroid formation previously shown in vivo (Nikić et al., 2011) support the idea that active cytoskeletal restructuring occurs in response to ROS. Furthermore, it is consistent with the previous findings that depolymerization of actin with cytochalasin D stabilizes intracellular free Ca2+ and protects hippocampal neurons (Furukawa et al., 1995). Actin thus may play a dual role in the formation of spheroids: a structural and a Ca2+-regulating role. While a high density of the punctuate fluorescent labeling for tubulin occurred in spheroids, suggesting the presence of disrupted microtubules, Taxol, which stabilizes microtubules, did not prevent spheroid formation, suggesting a secondary role of microtubule destabilization.
Together, these results suggest the following scenario of axonal spheroid formation in response to ROS. Elevated exogenous H2O2 associated with pathologic inflammation (Nikić et al., 2011) leads to axoplasmic Na+ increase. Rising Na+ activates the reverse mode of NCX, leading to a fast uniform Ca2+ increase along the axon. Rising Ca2+ leads to further aggregation of F-actin normally found concentrated at axonal branching points and axon terminals. Fast actin response and its aggregation is likely to drive axolemmal changes, such as aggregation of reverse NCX and VGCCs. Increased focal density of reverse NCX and VGCC results in focal Ca2+ increases at the sites of axonal swelling. Disrupted axonal transport contributes to swellings progressing into spheroids. Rapidly rising focal Ca2+ in spheroids triggers local mitochondrial Ca2+ overload, PTP activation, and release of pro-apoptotic agents. Removal of ROS or application of antioxidants reverses the direction of NCX, allowing for the extrusion of axoplasmic Ca2+ excess, deaggregation of actin, and restoration of axonal transport.
This study does not address cellular sources of ROS that occur in vivo, such as activated microglia, and whether ROS-producing inflammatory cells would induce focal Ca2+ rise at sites of spheroid formations. Our in vitro system contains unmyelinated axons, and whether myelinated axons would develop focal Ca2+ increases at sites of spheroid formations in response to ROS is also uncertain. However, our study may be of relevance to MS, in which loosely myelinated or demyelinated segments present an unprotected axonal surface for interaction with elevated levels of ROS produced by microglia in MS lesions (Lassmann, 2010; Abourbeh et al., 2012). Importantly, demyelination in MS leads to Nav1.6 and Nav1.2 channel redistribution (Craner et al., 2004b) and their increase in demyelinated segments. That would facilitate focal Na+ rise, reversal of NCX and Ca2+ rise, which makes our proposed model of Ca2+-dependent spheroid formation even more relevant to MS. Upregulation of Na+ influx shown here is also characteristic of trauma (Iwata A et al., 2004) and anoxia/ischemia, suggesting that the proposed model is a common pathway for axonal degeneration. While the relative specificity of KB-R7943 could be a limitation at 10 μm via nonspecific block of L-type Ca2+ channels (Ouardouz et al., 2005), we used an order of magnitude lower concentration of 1 μm KB-R7943. Importantly, when L-type Ca2+ channels were blocked with amlodipine, we saw only a modest effect on axoplasmic Ca2+ regulation (Fig. 7, J vs B, D). These results implicate the influx of Ca2+ via reverse NCX1 as a key event in the onset of spheroid formation. CsA binds not only to CyPD in mitochondria but other cyclophilins as well. However, CsA pretreatment did not affect the cytosolic Ca2+ level in adult neurons in which CyPD was genetically eliminated but other cyclophilins remained intact (our unpublished observations). Therefore, we believe CsA was sufficiently specific for the assessment of the contribution of mitochondria to increases in axoplasmic Ca2+ in response to ROS.
In summary, our findings suggest that ROS-mediated spheroid formation is driven by three main events: fast actin response and its aggregation, focal aggregation of NCX and VGCC, and focal Ca2+ rise. These results create a basis for developing new neuroprotective strategies that would prevent spheroid formation by targeting Ca2+–actin interactions and Ca2+ regulating systems—actin interactions in axons undergoing oxidative stress.
Footnotes
This work was supported by grants from the National Institutes of Health (1R01NS057433 and 1R01GM069883; training grant T32 NS007381), the National Multiple Sclerosis Society (CA-1055-A-3), the Department of Veterans Affairs, the Office of Research and Development, the Biomedical Laboratory of Research and Development, the Laura Fund for Innovation in Multiple Sclerosis Research, the Nancy Davis Center Without Walls, and the St. Laurent Foundation of Vancouver. The study was also supported by NIH NINDS Grant P30NS061800.
References
- Abourbeh G, Thézé B, Maroy R, Dubois A, Brulon V, Fontyn Y, Dollé F, Tavitian B, Boisgard R. Imaging microglial/macrophage activation in spinal cords of experimental autoimmune encephalomyelitis rats by positron emission tomography using the mitochondrial 18 kDa translocator protein radioligand [18F]DPA-714. J Neurosci. 2012;32:5728–5736. doi: 10.1523/JNEUROSCI.2900-11.2012. [DOI] [PMC free article] [PubMed] [Google Scholar]
- Akopian A, Szikra T, Cristofanilli M, Krizaj D. Glutamate-induced Ca2+ influx in third-order neurons of salamander retina is regulated by the actin cytoskeleton. Neuroscience. 2006;138:17–24. doi: 10.1016/j.neuroscience.2005.11.002. [DOI] [PMC free article] [PubMed] [Google Scholar]
- Andersen EF, Asuri NS, Halloran MC. In vivo imaging of cell behaviors and F-actin reveals LIM-HD transcription factor regulation of peripheral versus central sensory axon development. Neural Dev. 2011;6:27. doi: 10.1186/1749-8104-6-27. [DOI] [PMC free article] [PubMed] [Google Scholar]
- Annunziato L, Pignataro G, Boscia F, Sirabella R, Formisano L, Saggese M, Cuomo O, Gala R, Secondo A, Viggiano D, Molinaro P, Valsecchi V, Tortiglione A, Adornetto A, Scorziello A, Cataldi M, Di Renzo GF. ncx1, ncx2, and ncx3 gene product expression and function in neuronal anoxia and brain ischemia. Ann N Y Acad Sci. 2007;1099:413–426. doi: 10.1196/annals.1387.050. [DOI] [PubMed] [Google Scholar]
- Barsukova A, Komarov A, Hajnóczky G, Bernardi P, Bourdette D, Forte M. Activation of the mitochondrial permeability transition pore modulates Ca2+ responses to physiological stimuli in adult neurons. Eur J Neurosci. 2011a;33:831–842. doi: 10.1111/j.1460-9568.2010.07576.x. [DOI] [PMC free article] [PubMed] [Google Scholar]
- Barsukova AG, Bourdette D, Forte M. Mitochondrial calcium and its regulation in neurodegeneration induced by oxidative stress. Eur J Neurosci. 2011b;34:437–447. doi: 10.1111/j.1460-9568.2011.07760.x. [DOI] [PMC free article] [PubMed] [Google Scholar]
- Beirowski B, Nógrádi A, Babetto E, Garcia-Alias G, Coleman MP. Mechanisms of axonal spheroid formation in central nervous system Wallerian degeneration. J Neuropathol Exp Neurol. 2010;69:455–472. doi: 10.1097/NEN.0b013e3181da84db. [DOI] [PubMed] [Google Scholar]
- Brand-Schieber E, Werner P. Calcium channel blockers ameliorate disease in a mouse model of multiple sclerosis. Exp Neurol. 2004;189:5–9. doi: 10.1016/j.expneurol.2004.05.023. [DOI] [PubMed] [Google Scholar]
- Brünig I, Kaech S, Brinkhaus H, Oertner TG, Matus A. Influx of extracellular calcium regulates actin-dependent morphological plasticity in dendritic spines. Neuropharmacology. 2004;47:669–676. doi: 10.1016/j.neuropharm.2004.07.038. [DOI] [PubMed] [Google Scholar]
- Chen X, Leischner U, Rochefort NL, Nelken I, Konnerth A. Functional mapping of single spines in cortical neurons in vivo. Nature. 2011;475:501–505. doi: 10.1038/nature10193. [DOI] [PubMed] [Google Scholar]
- Coleman M. Axon degeneration mechanisms: commonality amid diversity. Nat Rev Neurosci. 2005;6:889–898. doi: 10.1038/nrn1788. [DOI] [PubMed] [Google Scholar]
- Craner MJ, Hains BC, Lo AC, Black JA, Waxman SG. Co-localization of sodium channel Nav1.6 and the sodium-calcium exchanger at sites of axonal injury in the spinal cord in EAE. Brain. 2004a;127:294–303. doi: 10.1093/brain/awh032. [DOI] [PubMed] [Google Scholar]
- Craner MJ, Newcombe J, Black JA, Hartle C, Cuzner ML, Waxman SG. Molecular changes in neurons in multiple sclerosis: altered axonal expression of Nav1.2 and Nav1.6 sodium channels and Na+/Ca2+ exchanger. Proc Natl Acad Sci U S A. 2004b;101:8168–8173. doi: 10.1073/pnas.0402765101. [DOI] [PMC free article] [PubMed] [Google Scholar]
- Forte M, Gold BG, Marracci G, Chaudhary P, Basso E, Johnsen D, Yu X, Fowlkes J, Rahder M, Stem K, Bernardi P, Bourdette D. Cyclophilin D inactivation protects axons in experimental autoimmune encephalomyelitis, an animal model of multiple sclerosis. Proc Natl Acad Sci U S A. 2007;104:7558–7563. doi: 10.1073/pnas.0702228104. [DOI] [PMC free article] [PubMed] [Google Scholar]
- Furukawa K, Smith-Swintosky VL, Mattson MP. Evidence that actin depolymerization protects hippocampal neurons against excitotoxicity by stabilizing [Ca2+]i. Exp Neurol. 1995;133:153–163. doi: 10.1006/exnr.1995.1018. [DOI] [PubMed] [Google Scholar]
- Gadjanski I, Boretius S, Williams SK, Lingor P, Knöferle J, Sättler MB, Fairless R, Hochmeister S, Sühs KW, Michaelis T, Frahm J, Storch MK, Bähr M, Diem R. Role of n-type voltage-dependent calcium channels in autoimmune optic neuritis. Ann Neurol. 2009;66:81–93. doi: 10.1002/ana.21668. [DOI] [PubMed] [Google Scholar]
- Hyslop PA, Zhang Z, Pearson DV, Phebus LA. Measurement of striatal H2O2 by microdialysis following global forebrain ischemia and reperfusion in the rat: correlation with the cytotoxic potential of H2O2 in vitro. Brain Res. 1995;671:181–186. doi: 10.1016/0006-8993(94)01291-o. [DOI] [PubMed] [Google Scholar]
- Iwata A, Stys PK, Wolf JA, Chen XH, Taylor AG, Meaney DF, Smith DH. Traumatic axonal injury induces proteolytic cleavage of the voltage-gated sodium channels modulated by tetrodotoxin and protease inhibitors. J Neurosci. 2004;19:4605–4613. doi: 10.1523/JNEUROSCI.0515-03.2004. [DOI] [PMC free article] [PubMed] [Google Scholar]
- Kornek B, Storch MK, Bauer J, Djamshidian A, Weissert R, Wallstroem E, Stefferl A, Zimprich F, Olsson T, Linington C, Schmidbauer M, Lassmann H. Distribution of a calcium channel subunit in dystrophic axons in multiple sclerosis and experimental autoimmune encephalomyelitis. Brain. 2001;124:1114–1124. doi: 10.1093/brain/124.6.1114. [DOI] [PubMed] [Google Scholar]
- Lassmann H. Axonal and neuronal pathology in multiple sclerosis: what have we learnt from animal models. Exp Neurol. 2010;225:2–8. doi: 10.1016/j.expneurol.2009.10.009. [DOI] [PubMed] [Google Scholar]
- Nathan BP, Barsukova AG, Shen F, McAsey M, Struble RG. Estrogen facilitates neurite extension via apolipoprotein E in cultured adult mouse cortical neurons. Endocrinology. 2004;145:3065–3073. doi: 10.1210/en.2003-1707. [DOI] [PubMed] [Google Scholar]
- Nikić I, Merkler D, Sorbara C, Brinkoetter M, Kreutzfeldt M, Bareyre FM, Bruck W, Bishop D, Misgeld T, Kerschensteiner M. A reversible form of axon damage in experimental autoimmune encephalomyelitis and multiple sclerosis. Nat Med. 2011;17:495–499. doi: 10.1038/nm.2324. [DOI] [PubMed] [Google Scholar]
- Oertner TG, Matus A. Calcium regulation of actin dynamics in dendritic spines. Cell Calcium. 2005;37:477–482. doi: 10.1016/j.ceca.2005.01.016. [DOI] [PubMed] [Google Scholar]
- Ouardouz M, Zamponi GW, Barr W, Kiedrowski L, Stys PK. Protection of ischemic rat spinal cord white matter: dual action of KB-R7943 on Na+/Ca2+ exchange and L-type Ca2+ channels. Neuropharmacology. 2005;48:566–575. doi: 10.1016/j.neuropharm.2004.12.007. [DOI] [PubMed] [Google Scholar]
- Pilitsis JG, Diaz FG, O'Regan MH, Phillis JW. Inhibition of Na(+)/Ca(2+) exchange by KB-R7943, a novel selective antagonist, attenuates phosphoethanolamine and free fatty acid efflux in rat cerebral cortex during ischemia-reperfusion injury. Brain Res. 2001;916:192–198. doi: 10.1016/s0006-8993(01)02896-7. [DOI] [PubMed] [Google Scholar]
- Sayre LM, Perry G, Smith MA. Oxidative stress and neurotoxicity. Chem Res Toxicol. 2008;21:172–188. doi: 10.1021/tx700210j. [DOI] [PubMed] [Google Scholar]
- Stys PK. White matter injury mechanisms. Curr Mol Med. 2004;4:113–130. doi: 10.2174/1566524043479220. [DOI] [PubMed] [Google Scholar]
- Stys PK. General mechanisms of axonal damage and its prevention. J Neurol Sci. 2005;233:3–13. doi: 10.1016/j.jns.2005.03.031. [DOI] [PubMed] [Google Scholar]
- Tsutsui S, Stys PK. Metabolic injury to axons and myelin. Exp Neurol. 2012 doi: 10.1016/j.expneurol.2012.04.016. [DOI] [PubMed] [Google Scholar]
- Wang JT, Medress ZA, Barres BA. Axon degeneration: Molecular mechanisms of a self-destruction pathway. J Cell Biol. 2012;196:7–18. doi: 10.1083/jcb.201108111. [DOI] [PMC free article] [PubMed] [Google Scholar]