

ABSTRACT
Natural transformation by competent bacteria is a primary means of horizontal gene transfer; however, evidence that competence drives bacterial diversity and evolution has remained elusive. To test this theory, we used a retrospective comparative genomic approach to analyze the evolutionary history of Aggregatibacter actinomycetemcomitans, a bacterial species with both competent and noncompetent sister strains. Through comparative genomic analyses, we reveal that competence is evolutionarily linked to genomic diversity and speciation. Competence loss occurs frequently during evolution and is followed by the loss of clustered regularly interspaced short palindromic repeats (CRISPRs), bacterial adaptive immune systems that protect against parasitic DNA. Relative to noncompetent strains, competent bacteria have larger genomes containing multiple rearrangements. In contrast, noncompetent bacterial genomes are extremely stable but paradoxically susceptible to infective DNA elements, which contribute to noncompetent strain genetic diversity. Moreover, incomplete noncompetent strain CRISPR immune systems are enriched for self-targeting elements, which suggests that the CRISPRs have been co-opted for bacterial gene regulation, similar to eukaryotic microRNAs derived from the antiviral RNA interference pathway.
IMPORTANCE
The human microbiome is rich with thousands of diverse bacterial species. One mechanism driving this diversity is horizontal gene transfer by natural transformation, whereby naturally competent bacteria take up environmental DNA and incorporate new genes into their genomes. Competence is theorized to accelerate evolution; however, attempts to test this theory have proved difficult. Through genetic analyses of the human periodontal pathogen Aggregatibacter actinomycetemcomitans, we have discovered an evolutionary connection between competence systems promoting gene acquisition and CRISPRs (clustered regularly interspaced short palindromic repeats), adaptive immune systems that protect bacteria against genetic parasites. We show that competent A. actinomycetemcomitans strains have numerous redundant CRISPR immune systems, while noncompetent bacteria have lost their CRISPR immune systems because of inactivating mutations. Together, the evolutionary data linking the evolution of competence and CRISPRs reveals unique mechanisms promoting genetic heterogeneity and the rise of new bacterial species, providing insight into complex mechanisms underlying bacterial diversity in the human body.
Introduction
Natural transformation is a primary means of bacterial horizontal gene transfer (HGT). Natural transformation occurs when environmental cues trigger the expression of competence genes, which allow the bacterium to take up DNA from its environment and incorporate new genes into its genome. Bacterial competence systems can vary among species, but all systems involve DNA transport proteins and machinery that incorporates the new DNA into the chromosome via homologous recombination (1–10). Because of their genetic complexities, competence systems are thought to be ancestral traits in many bacterial lineages; however, competence loss within bacterial families is common (9, 10). Evolutionary models predict that HGT and homologous recombination by natural transformation can accelerate adaptation to new environments and allow organisms to more rapidly reach fitness equilibria (11, 12). Despite predictions that competence is a beneficial trait, many bacteria are noncompetent and, among competent bacteria, competence genes are sometimes lost by strains within a species (13, 9). This leads to the hypothesis that, throughout evolution, naturally competent bacterial populations are constantly giving rise to noncompetent siblings, and at certain points, noncompetent genomes are selected for over the dynamic genomes of competent bacteria.
To test this hypothesis, we focused on the evolutionary history of the opportunistic human periodontal pathogen Aggregatibacter actinomycetemcomitans, of which ~30% of the isolated strains are naturally competent (13). A. actinomycetemcomitans is a member of Pasteurellaceae, a family of bacteria predicted to have descended from a competent ancestor (10). An experimental survey testing natural transformation demonstrated that A. actinomycetemcomitans competence loss is clonal (13), suggesting that noncompetent strains arose and radiated into noncompetent lineages. The persistence of noncompetent A. actinomycetemcomitans strains during evolution allows us to utilize genome sequence information to delineate the evolutionary history of competence loss and genome stability. Using comparative genomics, we have found that competence loss has occurred multiple times during A. actinomycetemcomitans evolution in parallel. Compared to competent strains, noncompetent A. actinomycetemcomitans strains have smaller genomes with fewer rearrangements, as demonstrated by whole-genome alignments. Pairwise strain average nucleotide identity (ANI) calculations reveal that competence loss is tied to evolutionary divergence among A. actinomycetemcomitans strains. Moreover, the loss of competence is directly correlated with the loss of A. actinomycetemcomitans CRISPR-cas adaptive immune systems, resulting in noncompetent strains that have more parasitic genetic elements than competent siblings do. In noncompetent strains, remnants of CRISPR-cas systems that remain appear to have been co-opted for A. actinomycetemcomitans self gene regulation, similar to eukaryotic microRNAs. Together, these results support a model of A. actinomycetemcomitans evolution whereby competence and noncompetence are means to genetic diversity and stability, respectively.
RESULTS AND DISCUSSION
Parallel loss of competence by common mechanisms.
Because the Pasteurellaceae common ancestor is predicted to be competent, we sought to determine the genetic nature of competence loss throughout A. actinomycetemcomitans evolution. Therefore, it was important to generate an accurate evolutionary history of the species and map competence loss to this phylogeny. The alignment of concatenated core genes can be used to accurately determine phylogenetic relationships among bacteria (14). We aligned core genes from 17 sequenced A. actinomycetemcomitans genomes, including 14 previously sequenced strains (15–18) and 3 genomes sequenced in this study (see Table S1 in the supplemental material). The concatenated core gene superalignment was subjected to maximum-likelihood phylogenetic analysis to determine evolutionary relationships between strains, revealing the presence of three major A. actinomycetemcomitans lineages (Fig. 1). Of these 17 strains, 7 have previously been subjected to natural transformation assays and 2 were found to be competent (13, 19). Subsequent alignment of multiple individual competence genes from the 17 sequenced A. actinomycetemcomitans genomes reveals that this bacterial lineage derived from a competent ancestor, and throughout evolutionary history, several noncompetent lineages have arisen via inactivation or deletion of genes critical for DNA uptake and incorporation into the chromosome (Fig. 1; see Fig. S1 in the supplemental material). The results indicate the presence of 3 competent and 14 noncompetent sequenced strains, which reflects the prevalence of noncompetent strains in larger A. actinomycetemcomitans populations (13). Importantly, the bioinformatic predictions for competent and noncompetent strains correlate with results of previously published natural transformation assays. Overall, noncompetence has arisen on at least six independent occasions (Fig. 1), with the most common mutation (three occasions) occurring via the insertion of a site-specific mobile DNA element into comM (see Fig. S1), whose gene product is important for efficient incorporation of DNA onto the chromosome following uptake (3). This pattern of A. actinomycetemcomitans competence loss contrasts with that of other naturally competent bacteria, like Haemophilus influenzae, in which competence loss is common but occurs randomly throughout evolution and typically by many unique mechanisms (9, 20). Because A. actinomycetemcomitans competence loss occurred multiple times during evolution in more than one lineage, these data support a model of the parallel evolution of competence loss. While parallel evolution is indicative of natural selection, this does not signify that competence loss is adaptive; in fact, it may be neutral, but the genome content of the stably maintained noncompetent strains is presumably beneficial.
FIG 1 .

Competence loss occurs throughout A. actinomycetemcomitans evolution. The evolutionary history of 17 A. actinomycetemcomitans strains was determined from the alignment of 30 concatenated core genes by the maximum-likelihood method on the basis of the Tamura-Nei model with 100 bootstrap replicates, using A. aphrophilus ATCC 3392 and NJ8700 as the outgroup (Out) (44–47). Competence is traced with green branches. Red branches represent ancestral noncompetent lineages, while blue branches are recent noncompetent strains. Roman numerals indicate noncompetence branch points. Bootstrap values are above the branches, and branches reproduced in less than 70% of the bootstrap replicates are collapsed.
Divergence and speciation of noncompetent strains.
Competence is a primary mechanism of HGT and DNA acquisition in bacteria (21), and as expected, the genomes of competent A. actinomycetemcomitans strains are, on average, 200,000 bp larger than those of noncompetent strains (2.3 Mb versus 2.1 Mb, respectively; P = 9 × 10⁻⁵, two-tailed unpaired t test). A major consequence of competence loss is the inability to acquire new traits via genomic exchange with related species, leading to the hypothesis that competence loss leads to genetic isolation, which could ultimately result in speciation. To test this hypothesis, we analyzed noncompetent and competent genomes for genomic rearrangements and ANI across whole genomes. Our results revealed that noncompetent strains have similar syntenic genomes (i.e., similar gene arrangements), while competent strains have dynamic genomes with multiple rearrangements (Fig. 2; see Fig. S2 in the supplemental material). Further differences were revealed by ANI. On the basis of a proposed modern species definition (ANI of >95%) (22), the noncompetent strain with the most ancient branch point (lineage 1, Fig. 1) is a different species than strains within lineage 2 and lineage 3 (Fig. 3; see Fig. S3). Interestingly, ANI comparisons of strains within lineage 2 and within lineage 3 show that strains within these lineages are ~99% identical; however, comparisons of strains in lineages 2 and 3 reveal that they differ significantly (ANI of ~97%; P < 0.001). Thus, lineage 2 and 3 strains have clearly begun to diverge into distinct populations. This supports a model in which competence loss leads to genetic isolation and ultimately divergence in A. actinomycetemcomitans.
FIG 2 .
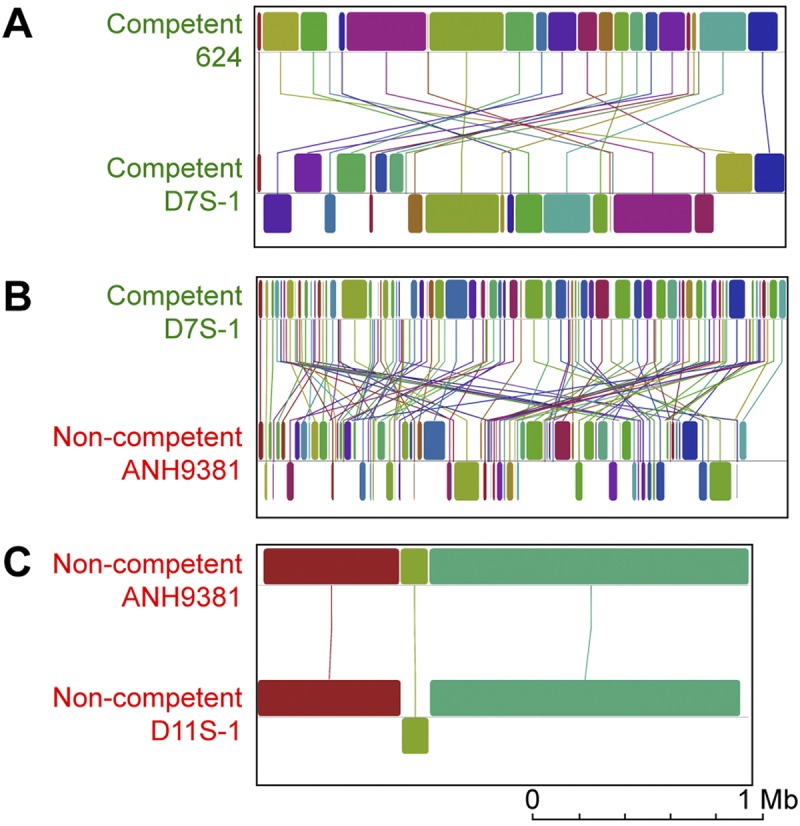
Noncompetent strains have highly syntenic genomes, and competent genomes have multiple rearrangements. Shown are whole-genome alignments of two competent strains (A), a competent and a noncompetent strain (B), and two noncompetent strains (C). Blocks represent collinear genomic segments, and lines indicate rearrangements.
FIG 3 .

Speciation of noncompetent A. actinomycetemcomitans. Pairwise whole-genome ANIs within A. actinomycetemcomitans lineages (lineage 3 versus lineage 3, n = 21; lineage 2 versus lineage 2, n = 36), between A. actinomycetemcomitans lineages (lineage 2 versus lineage 3, n = 63; lineage 1 versus lineages 2 and 3, n = 16), and between A. actinomycetemcomitans (Aa) and Aggregatibacter aphrophilus (n = 17). Each point represents a pairwise genome comparison. Bars indicate means, and error bars are standard errors of the means. ANIs between lineages are significantly different (analysis of variance, P < 0.001), while within-lineage comparisons are not.
Noncompetent strain diversity due to mobile genetic elements.
Despite the fact that noncompetent genomes had high synteny and ANI, some differences among noncompetent genomes were observed. We hypothesized that noncompetent strains of A. actinomycetemcomitans, having eliminated a predominant pathway for HGT, would utilize alternative mechanisms for HGT to maintain evolutionary fitness. Indeed, mathematical modeling suggests that in the absence of HGT and homologous recombination, genetic drift resulting from the accumulation of random neutral mutations will ultimately lead to decreased fitness (12), indicating that at least some nominal level of HGT is required for a strain to remain fit. Transducing phage and conjugative plasmids are also sources of HGT, and on average, there were about five unique plasmid- and phage-related DNA elements in each noncompetent genome, significantly more than were observed in competent lineages, which had about two (two-tailed unpaired t test, P = 0.02). The unique DNA elements in the noncompetent strains include two self-replicating plasmids, 14 integrated plasmid elements, and 22 prophage elements. Thus, while noncompetent strains possess increased synteny and smaller genomes than competent strains (Fig. 2; see Fig. S2 in the supplemental material), the observed differences between the DNA contents of these strains are almost entirely due to the incorporation of plasmid and prophage DNA.
Noncompetent strains have compromised CRISPR adaptive immune systems.
The presence of plasmids and prophage in the noncompetent strains suggests that their defenses against foreign nucleic acids were potentially compromised. Bacterial adaptive immune systems called CRISPRs have evolved to protect against phage- and plasmid-mediated HGT (23–25). Many variations of CRISPRs exist, and they have been extensively reviewed (26, 27). Briefly, CRISPRs are genetic loci consisting of direct repeats and spacers (28). Spacers are often derived from phage and plasmid DNA (29). During an infection, short CRISPR RNAs (crRNAs) are transcribed from the CRISPR loci and base pair with foreign (plasmid and bacteriophage) DNA via spacer-encoded sequences (24). Both the invading DNA and crRNA are cleaved by proteins encoded by CRISPR-associated cas genes, thereby eliminating the phage and plasmid DNA (23, 25, 30, 31). Recent work has shown that bacteria readily lose CRISPRs under certain selective conditions. Specifically, enterococci lost CRISPRs allowing the acquisition of parasite-encoded antibiotic resistance genes and Mycoplasma gallisepticum lost CRISPRs following the shift to a new avian host (32, 33). Because CRISPR loss is common in other organisms, we predicted that noncompetent A. actinomycetemcomitans strains were more susceptible to phage and plasmids because of CRISPR-mediated compromised immunity. To test this prediction, we examined the CRISPR-cas contents of competent and noncompetent A. actinomycetemcomitans strains. On the basis of phylogeny, the common ancestor of A. actinomycetemcomitans possessed two CRISPR-cas systems, CRISPR1-cas and CRISPR3-cas, duplicated from a single system in a more ancient ancestor (Fig. 4). Indeed, Aggregatibacter aphrophilus has only one CRISPR-cas system related to A. actinomycetemcomitans CRISPR1-cas and CRISPR3-cas (see Fig. S4 in the supplemental material), supporting the hypothesis that they were duplicated from an ancient system. The competent A. actinomycetemcomitans strains in our study contain both of these ancient CRISPR-cas systems and have acquired a third intact CRISPR-cas system (Fig. 4). In contrast, the CRISPR-cas systems in ancient noncompetent lineage 1 and 2 strains have lost cas genes to deletion and/or acquired nonsense mutations in cas genes (Fig 5A; see Fig. S5 in the supplemental material). On the basis of these mutations, CRISPR elements in noncompetent lineage 1 and 2 strains are predicted to be nonfunctional. CRISPR-cas loss was evident even in the most recently evolved (lineage 3) noncompetent strains, indicating that loss of CRISPR-cas occurs quickly within evolutionary time. The most parsimonious evolutionary history is that competence loss preceded CRISPR-cas loss among A. actinomycetemcomitans strains. This inference can be drawn because lineage 2 strains have the same disruption of the comM competence gene; however, they have many different CRISPR-cas mutations and deletions. These data indicate that the emergence of noncompetence in A. actinomycetemcomitans is correlated with the loss of CRISPR-based adaptive immunity.
FIG 4 .

The representative A. actinomycetemcomitans CRISPR-cas systems in D7S-1. (A) Representations include the cas genes (arrows) and CRISPRs (black diamonds, direct repeats; gray rectangles, spacers). CRISPR-cas locus names and types are indicated above each map. Approximate genomic coordinates of CRISPR-cas loci are indicated at the right and left ends of each map. Direct-repeat sequences are indicated above the respective maps. Numbers within arrows represent A. actinomycetemcomitans D7S-1 open reading frame designations (e.g., 0188 represents D7S_0188). Green arrows represent core cas genes found in all loci, blue arrows represent subtype-specific cas genes, and variable genes not previously associated with CRISPRs are shown as black arrows. (B) Genome map with annotated CRISPR-cas loci. Boxes indicate locations of individual CRISPR-cas systems; names are shown, as well as CRISPR-cas class types. Aa, A. actinomycetemcomitans.
FIG 5 .

CRISPR-cas loss and the evolution of self-targeting CRISPR spacers in noncompetent A. actinomycetemcomitans. (A) Noncompetent strains (red, n = 14) have a lower percentage of intact cas genes than competent strains do (green, n = 3) (*, P = 0.009, two-tailed unpaired t test). Error bars represent standard errors of the means. (B) Noncompetent strains’ CRISPRs are enriched for self-targeting spacers. Spacer targets were determined by BLASTn analysis (35) (see Table S2 in the supplemental material). The white wedge represents spacers with unknown targets, and the black wedge represents spacers with known targets. The bar graphs represent the proportions of spacers that are known to target self genes (red), phage (blue), and plasmids (green).
Evolution of CRISPR self gene regulation in noncompetent strains.
Despite the fact that noncompetent strains have lost many cas genes required for immunity, most of these strains maintain one CRISPR with a small number of spacers. A current hypothesis is that “broken” CRISPR-cas loci tend toward autoimmunity and acquire self-targeting spacers (34) that are used to control the expression of chromosomal genes. To test this hypothesis, we identified spacers in all of our strains and predicted their targets (35, 36). Most spacers target unknown sequences (Fig 5B; see Fig. S6 in the supplemental material). However, identifiable targets in competent strains were predominantly phage and plasmids, while strains in noncompetent lineages were enriched for spacers with specificity for A. actinomycetemcomitans genes (Fig 5B; see Fig S6 and Table S2 in the supplemental material). Some of these self-targeting spacers within the noncompetent strains are antisense to coding genes, indicating that they could regulate self gene expression similar to that observed for an orphan crRNA in Listeria monocytogenes (37). These data suggest that noncompetent A. actinomycetemcomitans strains are co-opting CRISPRs for A. actinomycetemcomitans chromosomal gene regulation, reminiscent of eukaryotic microRNAs that have been co-opted from the RNA interference immune surveillance system in higher eukaryotes (38). To test whether the self-targeting CRISPRs could be used for self gene regulation, we used Northern blot analysis to probe for the self-targeting crRNA in A. actinomycetemcomitans VT1169. Similar to the orphan CRISPR in L. monocytogenes, the A. actinomycetemcomitans self-targeting spacer is expressed primarily during exponential-phase growth as part of an unprocessed ~650-nucleotide (nt) crRNA (Fig. 6A). The VT1169 crRNA is antisense to glgP, which encodes glycogen phosphorylase, and is predicted to bind with perfect complementarity across 35 nt near the 3′ end of the glgP mRNA (Fig. 6B). Further experiments are required to determine whether crRNA-based gene regulation impacts mRNA stability or translation and if there is a fitness benefit to this recently evolved regulation.
FIG 6 .

A. actinomycetemcomitans VT1169 self-targeting crRNA is expressed and predicted to target glycogen phosphorylase mRNA. (A) The self-targeting A. actinomycetemcomitans VT1169 crRNA is expressed primarily as an unprocessed transcript. Cells were grown to exponential phase (Exp.) and stationary phase (Stat.), and total RNA was harvested and subjected to Northern blot analysis with a probe for the self-targeting crRNA. The ethidium bromide-stained rRNA (right panel, top two bands) demonstrates equal RNA loading and RNA integrity. The radiolabeled RNA Century Marker-plus (M) is overexposed at the left to serve as the molecular size standard. Molecular sizes in nucleotides are shown on the left. The Northern blot assay shown is representative of three biological replicates. (B) Predicted binding interaction between A. actinomycetemcomitans VT1169 crRNA and the glgP mRNA.
An evolutionary model of the effects of competence and CRISPRs on fitness.
We have discovered an instance in which bacterial speciation is correlated with competence loss and the subsequent loss of bacterial adaptive immunity. While several models take our results into account, we propose an evolutionary model in which competence-mediated HGT promotes A. actinomycetemcomitans genetic diversity while noncompetence promotes genome stability. On the basis of this model, dynamic competent bacterial genomes quickly drive evolution, benefiting the organism under changing environmental conditions. However, noncompetent siblings constantly arising in the population are selected for when the organisms have beneficial genome content in a relatively constant environment. One potential consequence of the concomitant loss of CRISPR-cas immunity by these noncompetent strains is that they can sample and adjust to small changes in the environment through phage- and plasmid-mediated HGT. An important component of this model is that competent bacteria have genomes that are more dynamic than those of noncompetent strains, consistent with our observations that competent bacteria have larger genomes with increased genome rearrangements (Fig. 2). While this is an appealing model, the selective force(s) that drives loss of competence and CRISPR is not known and may not be linked. An alternate model that explains the link between CRISPRs and competence is the possible greater susceptibility of competent bacteria than their noncompetent siblings to genetic parasites. This is supported by the presence of large amounts of extracellular DNA in bacterial biofilms (39, 40) that potentially contains parasitic DNA from lysed neighboring cells. This hypothesis is bolstered by recent elegant experiments with Streptococcus pneumoniae in which an artificial CRISPR-cas system prevented the natural transformation of a CRISPR-targeted capsule gene into a nonvirulent rough strain, indicating that CRISPR-cas is capable of preventing natural transformation (41). Regardless, the evolutionary history of A. actinomycetemcomitans reveals a strong correlation between the evolution of competence loss and CRISPR adaptive immunity and provides new insights into mechanisms of bacterial diversity and speciation.
MATERIALS AND METHODS
DNA isolation, genome sequencing, and genome assembly.
A. actinomycetemcomitans 624, Y4, and VT1169 were routinely grown in tryptic soy broth supplemented with 0.5% yeast extract (TSBYE), and DNA was purified using standard methods for genome sequencing (42). The A. actinomycetemcomitans 624, VT1169, and Y4 genomes were sequenced and assembled de novo from Roche/454 FLX pyrosequencing reads using the Newbler assembler (43) (see Table S1 in the supplemental material). Life Technologies SOLiD V4 and 454 sequencing reads from A. actinomycetemcomitans 624, VT1169, and Y4 were aligned with the complete A. actinomycetemcomitans reference genomes (A. actinomycetemcomitans HK1651, D7S-1, and D11S-1) using CLC Genomics Workbench software (see Table S1). Supplemental sequencing of VT1169 CRISPR1 was carried out by capillary sequencing of a PCR product (obtained with primers C1-For [5′ ACGCAAATTCACACCCAC 3′] and C1-Rev [5′ TGGATGGTTTTGAGTGAC 3′]).
Multiple sequence alignments, ANI calculations, and phylogenetic tree construction
Complete and draft genome sequences for all A. actinomycetemcomitans strains were generated in this study or downloaded from GenBank and Oralgen (http://www.oralgen.lanl.gov/_index.html) (15–18). When complete gene sequences were not found in the de novo genome assembly of VT1169, consensus gene sequences were inferred from alignment with HK1651. The core gene phylogenetic tree was constructed from the sequence alignment of 30 concatenated core genes (pyrG, rplA, rplB, rplC, rplD, rplF, rplK, rplM, rplP, rplS, rpsC, rpsE, rpsI, rpsJ, rpsM, rpsS, smpB, tsf, frr, rplE, rpoB, rpsB, dam, dnaN, dnaQ, holB, holD, recR, rpoA, and rpoH) by the maximum-likelihood method using the Tamura-Nei model in MEGA5 using MUSCLE with 100 bootstrap replicates (44–47). Whole-genome alignments were performed with progressive MAUVE to identify genome rearrangements, local collinear genomic blocks, and variable mobile elements (48). ANI values for pairwise genome comparison were calculated using JSpecies with BLAST (ANIb) and MUMMER (ANIm) (22). Individual competence genes were aligned with MUSCLE in MEGA5 (44, 45, 47). Whole cas operons were aligned with CLC Sequence Viewer. The consensus gene sequences from VT1169 sequencing read alignment with HK1651 were used when genes were unassembled de novo.
CRISPR detection and characterization.
CRISPRs were identified with CRISPRfinder (36). CRISPR spacers were subjected to BLASTn analysis against the nr/nt database, and hits with >94% identity were recorded (49). Hits were classified as directed toward plasmid, prophage, phage, or self, while negative results were classified as unknowns.
Northern blot analysis.
A. actinomycetemcomitans VT1169 was grown to mid-exponential phase (optical density at 600 nm [OD600], 0.80) and stationary phase (OD600, 1.60) in TSBYE, and total RNA was harvested using RNA bee (Tel-Test) as described previously (50). Northern blotting was carried out by using previously described methods (50). Briefly, 10 µg RNA was separated on an 8% polyacrylamide–8 M urea denaturing gel, stained with ethidium bromide, transferred to nitrocellulose, UV cross-linked, blocked for 1 h at 55°C in UltraHyb buffer (Ambion), and probed for 16 h at 38.5°C with a radiolabeled DNA oligonucleotide anti-crRNA probe (5′ GGCGGGTACGGAAGCCTCCGGCACC 3′). The radiolabeled RNA Century Marker-plus (Ambion) was synthesized according to the manufacturer’s protocol and served as a size standard. Prior to transfer, gels were stained with ethidium bromide and imaged with a G:BOX apparatus (Syngene) to visualize rRNA, which served as the loading control.
SUPPLEMENTAL MATERIAL
Parallel evolution of competence gene loss. (A) Individual competence genes from all 17 A. actinomycetemcomitans strains were aligned to identify nonsense mutations and insertions disrupting genes (44, 47). Intact genes are black, genes with nonsense mutations are red, and genes disrupted by insertions are orange. Sites of nonsense mutations and insertions disrupting genes are shown by red and orange triangles, respectively. The process that each competence gene is involved in is indicated above the tree, i.e., regulation (Reg.), DNA uptake, and transformation (Transform.). The phylogenetic tree in Fig. 1 represents evolutionary relationships between strains. (B) Insertions disrupt A. actinomycetemcomitans comM in all three lineages. Three insertions by a mobile element disrupt A. actinomycetemcomitans comM across the three lineages. Five genes are identical in all three insertions near the 3′ end of the insertion (black arrows), while four genes are conserved in insertions 2 and 3 near the 5′ end (gray arrows), and genes unique to each insertion type are noted (blue, green, and purple arrows in insertions 1, 2, and 3, respectively). Strain SCC2302 has a unique deletion in the middle of the rhs element gene near the middle of the insertion, as indicated by the red line underneath the gene. Scale bars are shown for both panels A and B. Download Figure S1, PDF file, 0.5 MB.
Whole-genome alignments reveal highly syntenic noncompetent genomes. (A) Alignment grid showing pairwise alignments of competent and noncompetent genomes. Only closed genomes or high-quality draft genomes with fewer than 20 scaffolds were included in the analysis. (B) Heat map summarizing rearrangements (dark blue, more different) and synteny (dark orange, more syntenic) between genomes from whole-genome alignments. Synteny was determined by the number of local collinear blocks (LCBs) (i.e., perfectly syntenic genomes would have one LCB). Download Figure S2, PDF file, 2.2 MB.
Speciation of noncompetent A. actinomycetemcomitans strains. The matrix at the top represents pairwise ANI calculations for genomes using both BLAST (ANIb) and MUMMER (ANIm). A. aphrophilus served as a species definition control. Comparisons revealing different species are colored red (ANI of <95%), comparisons with divergence are orange (ANI of 95% to 99%), and comparisons of strains that are highly similar are colored green (ANI of >99%). Download Figure S3, PDF file, 0.6 MB.
A. aphrophilus CRISPR1-cas. Shown are cas genes (arrows) and CRISPRs (black diamonds, direct repeats; gray rectangles, spacers). The CRISPR-cas locus name and type are indicated above the locus. The approximate genomic coordinates of the CRISPR1-cas locus are indicated at the right and left. The direct-repeat sequence is shown at the top. Variable hypothetical genes not previously associated with CRISPRs are shown as black arrows. The map is not drawn to scale. Download Figure S4, PDF file, 0.4 MB.
A. actinomycetemcomitans cas gene loss in noncompetent lineages. Shown are representations of cas operon alignments from CRISPR1-cas, CRISPR2-cas, and CRISPR3-cas (A, B, and C). Intact cas genes are black, while genes with nonsense mutations are red, with red triangles indicating the sites of nonsense mutations. Red lines indicate deletions, sequencing gaps between contigs are shown as dashed brown lines, and variable regions within cas operons in individual strains are indicated by black lines. Core gene phylogenetic trees represent the evolutionary histories of the strains. Scale bars are associated with each CRISPR-cas locus at the bottom right. Download Figure S5, PDF file, 0.4 MB.
A. actinomycetemcomitans CRISPRs and spacer targets. CRISPR1, CRISPR2, and CRISPR3 (A, B, and C) are shown. In CRISPR1 and CRISPR3, spacers are indicated by rectangles. Spacers that are the same color have identical sequences. White rectangles represent unique spacers that are not found in any other strains. Spacer target types are within rectangles when targets had significant nucleotide BLAST hits (>90% identity; see legend). CRISPRs are oriented from the oldest spacers to the newest spacers. Blank spaces after strain names indicate a lack of CRISPRs. The topological core gene phylogenetic trees at the left represent the evolutionary histories of the strains. Download Figure S6, PDF file, 0.4 MB.
A. actinomycetemcomitans genome sequencing statistics for de novo genome assembly and read mapping to complete reference genomes.
A. actinomycetemcomitans CRISPR spacer targets.
ACKNOWLEDGMENTS
This work was supported by grants from the NIH (1R01DE020100 to M.W. and 5F31DE021633-02 to P.J. and M.W.). M.W. is a Burroughs Wellcome investigator in the pathogenesis of infectious disease.
We thank the Whiteley lab members and members of the University of Texas Section of Molecular Genetics and Microbiology for critical discussion of the manuscript.
Footnotes
Citation Jorth P, Whiteley M. 2012. An evolutionary link between natural transformation and CRISPR adaptive immunity. mBio 3(5):e00309-12. doi:10.1128/mBio.00309-12.
REFERENCES
- 1. Bhattacharjee MK, Fine DH, Figurski DH. 2007. tfoX (sxy)-dependent transformation of Aggregatibacter (Actinobacillus) actinomycetemcomitans. Gene 399:53–64 [DOI] [PMC free article] [PubMed] [Google Scholar]
- 2. Chandler MS. 1992. The gene encoding cAMP receptor protein is required for competence development in Haemophilus influenzae Rd. Proc. Natl. Acad. Sci. U. S. A. 89:1626–1630 [DOI] [PMC free article] [PubMed] [Google Scholar]
- 3. Gwinn ML, Ramanathan R, Smith HO, Tomb JF. 1998. A new transformation-deficient mutant of Haemophilus influenzae Rd with normal DNA uptake. J. Bacteriol. 180:746–748 [DOI] [PMC free article] [PubMed] [Google Scholar]
- 4. Karudapuram S, Zhao X, Barcak GJ. 1995. DNA sequence and characterization of Haemophilus influenzae dprA+, a gene required for chromosomal but not plasmid DNA transformation. J. Bacteriol. 177:3235–3240 [DOI] [PMC free article] [PubMed] [Google Scholar]
- 5. McCarthy D. 1989. Cloning of the rec-2 locus of Haemophilus influenzae. Gene 75:135–143 [DOI] [PubMed] [Google Scholar]
- 6. Mullen LM, et al. 2008. Pasteurellaceae ComE1 proteins combine the properties of fibronectin adhesins and DNA binding competence proteins. PLoS One 3:e3991 [DOI] [PMC free article] [PubMed] [Google Scholar]
- 7. Tarry M, et al. 2011. The extra-membranous domains of the competence protein HofQ show DNA binding, flexibility and a shared fold with type I KH domains. J. Mol. Biol. 409:642–653 [DOI] [PubMed] [Google Scholar]
- 8. Wang Y, Shi W, Chen W, Chen C. 2003. Type IV pilus gene homologs pilABCD are required for natural transformation in Actinobacillus actinomycetemcomitans. Gene 312:249–255 [DOI] [PubMed] [Google Scholar]
- 9. Maughan H, Redfield RJ. 2009. Extensive variation in natural competence in Haemophilus influenzae. Evolution 63:1852–1866 [DOI] [PubMed] [Google Scholar]
- 10. Redfield RJ, et al. 2006. Evolution of competence and DNA uptake specificity in the Pasteurellaceae. BMC Evol. Biol. 6:82 [DOI] [PMC free article] [PubMed] [Google Scholar]
- 11. Levin BR, Cornejo OE. 2009. The population and evolutionary dynamics of homologous gene recombination in bacterial populations. PLoS Genet. 5:e1000601 [DOI] [PMC free article] [PubMed] [Google Scholar]
- 12. Wylie CS, Trout AD, Kessler DA, Levine H. 2010. Optimal strategy for competence differentiation in bacteria. PLoS Genet. 6:e1001108 [DOI] [PMC free article] [PubMed] [Google Scholar]
- 13. Fujise O, Lakio L, Wang Y, Asikainen S, Chen C. 2004. Clonal distribution of natural competence in Actinobacillus actinomycetemcomitans. Oral Microbiol. Immunol. 19:340–342 [DOI] [PubMed] [Google Scholar]
- 14. Wu M, Eisen JA. 2008. A simple, fast, and accurate method of phylogenomic inference. Genome Biol. 9:R151 [DOI] [PMC free article] [PubMed] [Google Scholar]
- 15. Chen C, Kittichotirat W, Chen W, Downey JS, Bumgarner R. 2012. Genome sequence of a serotype b non-JP2 Aggregatibacter actinomycetemcomitans strain, ANH9381, from a periodontally healthy individual. J. Bacteriol. 194:1837 [DOI] [PMC free article] [PubMed] [Google Scholar]
- 16. Chen C, et al. 2010. Genome sequence of naturally competent Aggregatibacter actinomycetemcomitans serotype A strain D7S-1. J. Bacteriol. 192:2643–2644 [DOI] [PMC free article] [PubMed] [Google Scholar]
- 17. Chen C, Kittichotirat W, Si Y, Bumgarner R. 2009. Genome sequence of Aggregatibacter actinomycetemcomitans serotype C strain D11S-1. J. Bacteriol. 191:7378–7379 [DOI] [PMC free article] [PubMed] [Google Scholar]
- 18. Kittichotirat W, Bumgarner RE, Asikainen S, Chen C. 2011. Identification of the pangenome and its components in 14 distinct Aggregatibacter actinomycetemcomitans strains by comparative genomic analysis. PLoS One 6:e22420 [DOI] [PMC free article] [PubMed] [Google Scholar]
- 19. Wang Y, Goodman SD, Redfield RJ, Chen C. 2002. Natural transformation and DNA uptake signal sequences in Actinobacillus actinomycetemcomitans. J. Bacteriol. 184:3442–3449 [DOI] [PMC free article] [PubMed] [Google Scholar]
- 20. Maughan H, Redfield RJ. 2009. Tracing the evolution of competence in Haemophilus influenzae. PLoS One 4:e5854 [DOI] [PMC free article] [PubMed] [Google Scholar]
- 21. Thomas CM, Nielsen KM. 2005. Mechanisms of, and barriers to, horizontal gene transfer between bacteria. Nat. Rev. Microbiol. 3:711–721 [DOI] [PubMed] [Google Scholar]
- 22. Richter M, Rosselló-Móra R. 2009. Shifting the genomic gold standard for the prokaryotic species definition. Proc. Natl. Acad. Sci. U. S. A. 106:19126–19131 [DOI] [PMC free article] [PubMed] [Google Scholar]
- 23. Barrangou R, et al. 2007. CRISPR provides acquired resistance against viruses in prokaryotes. Science 315:1709–1712 [DOI] [PubMed] [Google Scholar]
- 24. Brouns SJ, et al. 2008. Small CRISPR RNAs guide antiviral defense in prokaryotes. Science 321:960–964 [DOI] [PMC free article] [PubMed] [Google Scholar]
- 25. Garneau JE, et al. 2010. The CRISPR/Cas bacterial immune system cleaves bacteriophage and plasmid DNA. Nature 468:67–71 [DOI] [PubMed] [Google Scholar]
- 26. Makarova KS, et al. 2011. Evolution and classification of the CRISPR-Cas systems. Nat. Rev. Microbiol. 9:467–477 [DOI] [PMC free article] [PubMed] [Google Scholar]
- 27. Wiedenheft B, Sternberg SH, Doudna JA. 2012. RNA-guided genetic silencing systems in bacteria and archaea. Nature 482:331–338 [DOI] [PubMed] [Google Scholar]
- 28. Godde JS, Bickerton A. 2006. The repetitive DNA elements called CRISPRs and their associated genes: evidence of horizontal transfer among prokaryotes. J. Mol. Evol. 62:718–729 [DOI] [PubMed] [Google Scholar]
- 29. Mojica FJ, Díez-Villaseñor C, García-Martínez J, Soria E. 2005. Intervening sequences of regularly spaced prokaryotic repeats derive from foreign genetic elements. J. Mol. Evol. 60:174–182 [DOI] [PubMed] [Google Scholar]
- 30. Hale CR, et al. 2009. RNA-guided RNA cleavage by a CRISPR RNA-Cas protein complex. Cell 139:945–956 [DOI] [PMC free article] [PubMed] [Google Scholar]
- 31. Marraffini LA, Sontheimer EJ. 2008. CRISPR interference limits horizontal gene transfer in staphylococci by targeting DNA. Science 322:1843–1845 [DOI] [PMC free article] [PubMed] [Google Scholar]
- 32. Delaney NF, et al. 2012. Ultrafast evolution and loss of CRISPRs following a host shift in a novel wildlife pathogen, Mycoplasma gallisepticum. PLoS Genet. 8 e1002511 [DOI] [PMC free article] [PubMed] [Google Scholar]
- 33. Palmer KL, Gilmore MS. 2010. Multidrug-resistant enterococci lack CRISPR-cas. mBio 1:e00227-10 [DOI] [PMC free article] [PubMed] [Google Scholar]
- 34. Stern A, Keren L, Wurtzel O, Amitai G, Sorek R. 2010. Self-targeting by CRISPR: gene regulation or autoimmunity? Trends Genet. 26:335–340 [DOI] [PMC free article] [PubMed] [Google Scholar]
- 35. Altschul SF, et al. 1997. Gapped BLAST and PSI-BLAST: a new generation of protein database search programs. Nucleic Acids Res. 25:3389–3402 [DOI] [PMC free article] [PubMed] [Google Scholar]
- 36. Grissa I, Vergnaud G, Pourcel C. 2007. CRISPRFinder: a web tool to identify clustered regularly interspaced short palindromic repeats. Nucleic Acids Res. 35:W52–W57 [DOI] [PMC free article] [PubMed] [Google Scholar]
- 37. Mandin P, Repoila F, Vergassola M, Geissmann T, Cossart P. 2007. Identification of new noncoding RNAs in Listeria monocytogenes and prediction of mRNA targets. Nucleic Acids Res. 35:962–974 [DOI] [PMC free article] [PubMed] [Google Scholar]
- 38. Carthew RW, Sontheimer EJ. 2009. Origins and mechanisms of miRNAs and siRNAs. Cell 136:642–655 [DOI] [PMC free article] [PubMed] [Google Scholar]
- 39. Izano EA, et al. 2008. Poly-N-acetylglucosamine mediates biofilm formation and detergent resistance in Aggregatibacter actinomycetemcomitans. Microb. Pathog. 44:52–60 [DOI] [PMC free article] [PubMed] [Google Scholar]
- 40. Periasamy S, Kolenbrander PE. 2009. Aggregatibacter actinomycetemcomitans builds mutualistic biofilm communities with Fusobacterium nucleatum and Veillonella species in saliva. Infect. Immun. 77:3542–3551 [DOI] [PMC free article] [PubMed] [Google Scholar]
- 41. Bikard D, Hatoum-Aslan A, Mucida D, Marraffini LA. 2012. CRISPR interference can prevent natural transformation and virulence acquisition during in vivo bacterial infection. Cell Host Microbe 12:177–186 [DOI] [PubMed] [Google Scholar]
- 42. Avery OT, Macleod CM, McCarty M. 1944. Studies on the chemical nature of the substance inducing transformation of pneumococcal types: induction of transformation by a desoxyribonucleic acid fraction isolated from pneumococcus type III. J. Exp. Med. 79:137–158 [DOI] [PMC free article] [PubMed] [Google Scholar]
- 43. Margulies M, et al. 2005. Genome sequencing in microfabricated high-density picolitre reactors. Nature 437:376–380 [DOI] [PMC free article] [PubMed] [Google Scholar]
- 44. Edgar RC. 2004. MUSCLE: multiple sequence alignment with high accuracy and high throughput. Nucleic Acids Res. 32:1792–1797 [DOI] [PMC free article] [PubMed] [Google Scholar]
- 45. Felsenstein J. 1985. Confidence limits on phylogenies: an approach using the bootstrap. Evolution 39:783–791 [DOI] [PubMed] [Google Scholar]
- 46. Tamura K, Nei M. 1993. Estimation of the number of nucleotide substitutions in the control region of mitochondrial DNA in humans and chimpanzees. Mol. Biol. Evol. 10:512–526 [DOI] [PubMed] [Google Scholar]
- 47. Tamura K, et al. 2011. MEGA5: molecular evolutionary genetics analysis using maximum likelihood, evolutionary distance, and maximum parsimony methods. Mol. Biol. Evol. 28:2731–2739 [DOI] [PMC free article] [PubMed] [Google Scholar]
- 48. Darling AE, Mau B, Perna NT. 2010. Progressivemauve: multiple genome alignment with gene gain, loss and rearrangement. PLoS One 5:e11147 [DOI] [PMC free article] [PubMed] [Google Scholar]
- 49. Zhang Z, Schwartz S, Wagner L, Miller W. 2000. A greedy algorithm for aligning DNA sequences. J. Comput. Biol. J. Comput. Mol. Cell Biol. 7:203–214 [DOI] [PubMed] [Google Scholar]
- 50. Jorth P, Whiteley M. 2010. Characterization of a novel riboswitch-regulated lysine transporter in Aggregatibacter actinomycetemcomitans. J. Bacteriol. 192:6240–6250 [DOI] [PMC free article] [PubMed] [Google Scholar]
Associated Data
This section collects any data citations, data availability statements, or supplementary materials included in this article.
Supplementary Materials
Parallel evolution of competence gene loss. (A) Individual competence genes from all 17 A. actinomycetemcomitans strains were aligned to identify nonsense mutations and insertions disrupting genes (44, 47). Intact genes are black, genes with nonsense mutations are red, and genes disrupted by insertions are orange. Sites of nonsense mutations and insertions disrupting genes are shown by red and orange triangles, respectively. The process that each competence gene is involved in is indicated above the tree, i.e., regulation (Reg.), DNA uptake, and transformation (Transform.). The phylogenetic tree in Fig. 1 represents evolutionary relationships between strains. (B) Insertions disrupt A. actinomycetemcomitans comM in all three lineages. Three insertions by a mobile element disrupt A. actinomycetemcomitans comM across the three lineages. Five genes are identical in all three insertions near the 3′ end of the insertion (black arrows), while four genes are conserved in insertions 2 and 3 near the 5′ end (gray arrows), and genes unique to each insertion type are noted (blue, green, and purple arrows in insertions 1, 2, and 3, respectively). Strain SCC2302 has a unique deletion in the middle of the rhs element gene near the middle of the insertion, as indicated by the red line underneath the gene. Scale bars are shown for both panels A and B. Download Figure S1, PDF file, 0.5 MB.
Whole-genome alignments reveal highly syntenic noncompetent genomes. (A) Alignment grid showing pairwise alignments of competent and noncompetent genomes. Only closed genomes or high-quality draft genomes with fewer than 20 scaffolds were included in the analysis. (B) Heat map summarizing rearrangements (dark blue, more different) and synteny (dark orange, more syntenic) between genomes from whole-genome alignments. Synteny was determined by the number of local collinear blocks (LCBs) (i.e., perfectly syntenic genomes would have one LCB). Download Figure S2, PDF file, 2.2 MB.
Speciation of noncompetent A. actinomycetemcomitans strains. The matrix at the top represents pairwise ANI calculations for genomes using both BLAST (ANIb) and MUMMER (ANIm). A. aphrophilus served as a species definition control. Comparisons revealing different species are colored red (ANI of <95%), comparisons with divergence are orange (ANI of 95% to 99%), and comparisons of strains that are highly similar are colored green (ANI of >99%). Download Figure S3, PDF file, 0.6 MB.
A. aphrophilus CRISPR1-cas. Shown are cas genes (arrows) and CRISPRs (black diamonds, direct repeats; gray rectangles, spacers). The CRISPR-cas locus name and type are indicated above the locus. The approximate genomic coordinates of the CRISPR1-cas locus are indicated at the right and left. The direct-repeat sequence is shown at the top. Variable hypothetical genes not previously associated with CRISPRs are shown as black arrows. The map is not drawn to scale. Download Figure S4, PDF file, 0.4 MB.
A. actinomycetemcomitans cas gene loss in noncompetent lineages. Shown are representations of cas operon alignments from CRISPR1-cas, CRISPR2-cas, and CRISPR3-cas (A, B, and C). Intact cas genes are black, while genes with nonsense mutations are red, with red triangles indicating the sites of nonsense mutations. Red lines indicate deletions, sequencing gaps between contigs are shown as dashed brown lines, and variable regions within cas operons in individual strains are indicated by black lines. Core gene phylogenetic trees represent the evolutionary histories of the strains. Scale bars are associated with each CRISPR-cas locus at the bottom right. Download Figure S5, PDF file, 0.4 MB.
A. actinomycetemcomitans CRISPRs and spacer targets. CRISPR1, CRISPR2, and CRISPR3 (A, B, and C) are shown. In CRISPR1 and CRISPR3, spacers are indicated by rectangles. Spacers that are the same color have identical sequences. White rectangles represent unique spacers that are not found in any other strains. Spacer target types are within rectangles when targets had significant nucleotide BLAST hits (>90% identity; see legend). CRISPRs are oriented from the oldest spacers to the newest spacers. Blank spaces after strain names indicate a lack of CRISPRs. The topological core gene phylogenetic trees at the left represent the evolutionary histories of the strains. Download Figure S6, PDF file, 0.4 MB.
A. actinomycetemcomitans genome sequencing statistics for de novo genome assembly and read mapping to complete reference genomes.
A. actinomycetemcomitans CRISPR spacer targets.