Abstract
Acclimation of photosynthesis to elevated CO2 has previously been shown to be more pronounced when N supply is poor. Is this a direct effect of N or an indirect effect of N by limiting the development of sinks for photoassimilate? This question was tested by growing a perennial ryegrass (Lolium perenne) in the field under elevated (60 Pa) and current (36 Pa) partial pressures of CO2 (pCO2) at low and high levels of N fertilization. Cutting of this herbage crop at 4- to 8-week intervals removed about 80% of the canopy, therefore decreasing the ratio of photosynthetic area to sinks for photoassimilate. Leaf photosynthesis, in vivo carboxylation capacity, carbohydrate, N, ribulose-1,5-bisphosphate carboxylase/oxygenase, sedoheptulose-1,7-bisphosphatase, and chloroplastic fructose-1,6-bisphosphatase levels were determined for mature lamina during two consecutive summers. Just before the cut, when the canopy was relatively large, growth at elevated pCO2 and low N resulted in significant decreases in carboxylation capacity and the amount of ribulose-1,5-bisphosphate carboxylase/oxygenase protein. In high N there were no significant decreases in carboxylation capacity or proteins, but chloroplastic fructose-1,6-bisphosphatase protein levels increased significantly. Elevated pCO2 resulted in a marked and significant increase in leaf carbohydrate content at low N, but had no effect at high N. This acclimation at low N was absent after the harvest, when the canopy size was small. These results suggest that acclimation under low N is caused by limitation of sink development rather than being a direct effect of N supply on photosynthesis.
Acclimation of photosynthesis to growth in elevated pCO2 has frequently been shown to be more marked under suboptimal N supply (Drake et al., 1997). Growth in low N limits the development of the shoot and root, and therefore the capacity for utilization of the additional photoassimilate formed under elevated pCO2. Low N may therefore exacerbate the accumulation of carbohydrate observed under elevated pCO2 (Webber et al., 1994; Drake et al., 1997). Alternatively, nitrate accumulation within the plant can alter gene expression (Paul and Driscoll, 1997; Scheible et al., 1997), and could lead to different patterns of acclimation to elevated pCO2 depending on the N supply. Wheat grown under limiting N supply showed a greater loss of Rubisco in response to elevated pCO2 than plants grown with free access to N (Rogers et al., 1996). This appeared to result from an accumulation of soluble carbohydrates in leaves, resulting in sugar repression of the expression of the genes encoding the LSU and the small subunit of Rubisco (rbcL and rbcS, respectively) (Stitt, 1991; Sheen, 1994; Krapp and Stitt, 1995; Koch, 1996).
Most studies of acclimation to elevated pCO2 under different levels of N nutrition have been conducted in containers in the laboratory. However, Arp (1991) demonstrated that such restriction of rooting volume might accentuate acclimation to elevated pCO2. In addition to the physical constraint imposed by container walls, the initially enhanced growth under elevated pCO2 will lead to a more rapid exhaustion of the N within the pot (Pettersson and MacDonald, 1994). In the field there is no restriction on rooting volume, and increased exploration of the soil with accelerated growth under elevated pCO2 would allow the plant to utilize additional sources of N. Enclosures, including open-top chambers, allow the effects of elevated pCO2 to be investigated in the field but impose significant changes in microclimate, which adds other uncertainties as to whether the same effects would be observed in the open air (Lewin et al., 1994). FACE overcomes the limitations imposed by open-top chambers and other field enclosures (Lewin et al., 1994).
We have taken the unique opportunity provided by the FACE experiment on farmland at Eschikon, Switzerland (Zanetti et al., 1996) to examine in open-field conditions the hypotheses that acclimation to elevated pCO2 is accentuated in low N, and that this in turn is an indirect effect resulting from N limitation of the development of sinks for photoassimilate. In this FACE experiment the perennial ryegrass Lolium perenne L. has been managed as a frequently cut herbage crop at low- and high-N supplies and at elevated and current pCO2. L. perenne is a major C3 pasture grass of Western Europe that has evolved under grazing conditions and is therefore adapted to survive periodic partial defoliation. Cutting will abruptly decrease the ratio of source, i.e. photosynthetic tissues, to sinks for photoassimilates, and in addition will lead to an increased demand for carbohydrate in shoot regrowth. Therefore, if increased acclimation of photosynthesis to elevated pCO2 under low N results because sink development is limited by N supply, then in L. perenne cutting should alleviate acclimation. This study is the first, to our knowledge, to test the effects of manipulating the source-sink balance on photosynthetic acclimation to elevated pCO2 in open-field conditions.
MATERIALS AND METHODS
Plants, Growth Conditions, and Experimental Design
Swards of the perennial ryegrass Lolium perenne L. (cv Bastion) were planted according to a split plot, randomized design in three blocks, with each block including an elevated pCO2 ring and an equivalent ring in the current ambient pCO2 of approximately 36 Pa. FACE elevated pCO2 to 60 Pa in each treatment ring. Fumigation began in 1993 and pCO2 was maintained at 60 ± 6 Pa for 92% of the total fumigation time (Zanetti et al., 1996). Within each ring, L. perenne was grown in monoculture at both low and high levels of N application as NH4HO3; 140 and 560 kg N/hectare, respectively. The swards were cut eight times between April and November each year (Hebeisen et al., 1997). L. perenne was cut to a height of 4 cm above ground level. In June, 1994, laminae were sampled the day before the sward was cut and again 7 d later for carbohydrate, N, and protein analysis. Gas-exchange measurements were made in parallel with sampling. In 1995, the sampling procedure was changed to rule out any possibility of a confounding effect of separation of the before- and after-harvest samples in time. One-half of the plot was cut and the other was left uncut. Samples for protein, N, and carbohydrate analysis, and measurements of gas exchange were then made on cut and uncut halves of the plots on the same days. To ensure a similar developmental age, all samples were taken from vegetative tillers and measurements were made on the laminae at about 5 cm from the point of emergence from the pseudostem. Samples for carbohydrate and protein analysis were frozen immediately in liquid N2 and stored at −80°C.
Photosynthetic Gas Exchange
Leaf gas-exchange measurements were made using an open gas-exchange system incorporating a CO2/water vapor IR gas analyzer (version 1.4., CIRAS 1, PP Systems, Hitchin, UK, or version LCA4, ADC, Ltd., Hoddesdon, UK) and a leaf cuvette (PLC version, PP Systems). These systems were calibrated with known water vapor concentrations provided by a water vapor generator (type WG-600, Analytical Development Co., Hoddesden, UK) and with CO2 calibration gas at 60.5 Pa pCO2 (27548-type 30L, Carbagas, Swiss Calibration, Zurich, Switzerland). The derived gas-exchange parameters A and ci were calculated according to the method of von Caemmerer and Farquhar (1981). Projected leaf area was estimated by measuring leaf width and then calculating the area from the chamber diameter. Leaf CO2 uptake in situ was measured for 2 h on either side of solar noon. Within each plot of each pCO2 × N combination, measurements were made of five leaves starting at 11 am, and the cycle was repeated three times until 3 pm. Mean rates of CO2 uptake were therefore based on 45 measurements for each pCO2 × N treatment.
The response of A to variation in ci was determined for two to four leaves per treatment per ring. A stabilized quartz-iodide light source was clipped over the leaf chamber to provide uniform, near-saturating PPFDs (750 μmol m−2 s−1). A stabilized 12-V direct current power supply ensured a constant photon flux for up to 8 h. Measurements were taken before 1 pm and/or were limited to overcast days to minimize the possibility of feedback inhibition of photosynthesis due to carbohydrate accumulation and cytosolic Pi limitation. Vc,max and Jmax (light-saturated potential rate of electron transport [μmol m−2 s−1]) were the key variables determining in vivo Rubisco activity and maximum capacity for RuBP regeneration, respectively. These were calculated by fitting the equations of Farquhar et al. (1980) and Evans and Farquhar (1991), following the procedure of Wullschleger (1993). Because temperature varied significantly between measurements, all estimates of Vc,max and Jmax were corrected to 25°C, following the equations of McMurtrie and Wang (1993).
Carbohydrate Analysis
WSCs were extracted as described in Fischer et al. (1997). The 1994 samples were analyzed using an anthrone/sulfuric acid method modified from Deriaz (1961) and optimized for the simultaneous determination of Glc and Fru. The 1995 samples were analyzed by the similar phenol-sulfuric acid technique as described by Dubois et al. (1956).
Protein Isolation, Western Blotting, Immunodetection, and Quantification
Frozen leaf segments were powdered in liquid N2 with a mortar and pestle. Total protein was extracted with 10% (w/v) TCA in acetone with 0.07% (v/v) β-mercaptoethanol as described by Damerval et al. (1986), followed by three washes in acetone with 0.07% (v/v) β-mercaptoethanol. The resulting dried protein pellet was solubilized in 62 mm Tris, 2% (w/v) SDS, 65 mm DTT, and 10% (v/v) glycerol, pH 6.8. To avoid interference from this solubilization buffer, the protein in a subsample was precipitated with 5% (w/v) TCA, washed in acetone, and resuspended in 0.1 m NaOH prior to determination of the protein content (detergent-compatible microplate protein assay, Bio-Rad). Samples were loaded on an equal-protein basis and resolved on 15% SDS-polyacrylamide gels and electroblotted onto a PVDF membrane (Immobilon-P, Millipore; Trans-Blot, Bio-Rad). The western blots were blocked with 30 g L−1 fat-free, dried milk prior to probing with antibodies raised against Rubisco holoenzyme, FBPase, and SBPase, all from wheat. After washing in PBS in the presence of a mild detergent (0.0005% [v/v] Tween 20), blots were probed with the secondary antibody, a sheep anti-rabbit IgG, horseradish peroxidase conjugate (Serotec Ltd., Oxford, UK). Specific proteins were detected with enhanced chemiluminesence immunodetection (Amersham). Quantification of the individual enhanced chemiluminescence signals was performed from two-dimensional densitometric scanning of the film using a computer-controlled laser-scanning densitometer (model 300A, Molecular Dynamics, Sunnyvale, CA). Because of the nonproportional solubilization step in the preparation of protein samples for SDS-PAGE, determination of protein content per unit leaf area required a separate protein assay. A subsample of the lyophilized TCA protein precipitate was dissolved in 0.1 m NaOH prior to determination of protein content (detergent-compatible microplate protein assay, Bio-Rad).
Leaf N Content
On completion of gas-exchange measurements, leaf segments were cut and dried to constant weight at 80°C. Each individual leaf sample was ground to a fine powder, and total leaf N was determined by combustion and then thermal conductivity separation in an elemental analyzer (PE 2400 series II CHNS/O Analyzer, Perkin-Elmer). The analyzer was previously calibrated with acetanilide standards (Perkin-Elmer).
Statistical Analyses
Differences in Vc,max, WSC, and N were examined by analysis of variance (version 5.04, Systat, Inc., Evanston, IL) using P = 0.05 as the level of significance. The data were analyzed as a split-split block design with pCO2 and block as the main effects and N and cut as split-block factors (Mead et al., 1993). A post hoc Tukey's test was used to examine significant pairwise comparisons. In 1995 no data were collected for the high-N-defoliated treatment. These data were therefore analyzed as two separate analysis of variances: first, analyzing pCO2 × N in the uncut subplots and second, analyzing pCO2 × cutting in the low-N plots. Data were treated as a split-block design, as for the 1994 data. Where significant effects were detected, pairwise comparison of means was by MSD based on Student's t-distribution (Mead et al., 1993). For pCO2 comparisons of WSC levels and Vc,max, critical values of Student's t-distribution for a 1-tailed test were used, since our hypothesis predicts an increase in WSC content and a decrease in Vc,max. All other comparisons used a two-tailed test, since the direction of change was not hypothesized. Comparisons of the absolute levels of Calvin cycle proteins are only possible within a blot, and not between, because of variation in exposure time, chemiluminescence, and the reaction of an individual protein with its antibody. The resulting ratio of a protein at elevated pCO2 to current pCO2 was determined within each block. Data were tested for heteroscedasticity, which, when found, was removed by log transformation (Zar, 1984). The means of the blocks, transformed where necessary, were then compared by Student's t test.
RESULTS
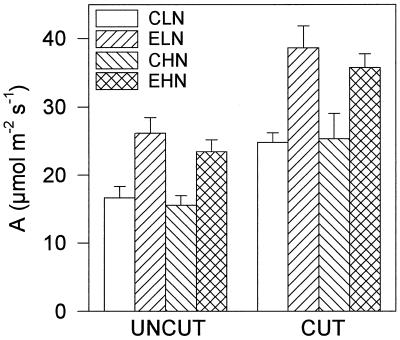
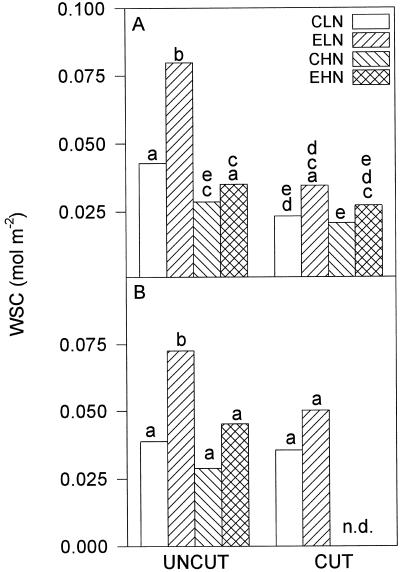
Average midday leaf photosynthetic rates were about 35% higher in leaves growing under elevated pCO2, irrespective of N supply or cutting (Fig. 1). A similar increase was observed in 1995 (Hymus, 1995). In 1994 growth at elevated pCO2 resulted in a significantly higher WSC content (F1,2 = 50.7, P < 0.05; Fig. 2A). There was a strong interaction between pCO2 and N (F1,4 = 39.75, P < 0.05); at low N the soluble carbohydrate content of lamina grown at elevated pCO2 was almost double that of leaves grown at current pCO2 (P < 0.01 post hoc Tukey's test). Conversely, at high N there was no significant difference between the carbohydrate contents in leaves grown at current and elevated pCO2 (Fig. 2). Following cutting, carbohydrate concentration showed a highly significant decline (F1,8 = 299.8, P < 0.01), correlating to the large decrease in the source-to-sink ratio. The difference in WSC between elevated and current pCO2-grown leaves before the cut at low N was absent after the cut (Fig. 2A). A similar pattern was observed when the measurements were repeated in 1995; growth at elevated pCO2 and low N resulted in a significantly higher WSC content (MSD, P < 0.05; Fig. 2B).
Figure 1.
A measurements made for 2 h on either side of solar noon on days with clear skies in June, 1994. Measurements were taken on mature lamina of L. perenne. Plants were grown and measured at current (C; 36 Pa) and at elevated (E; 60 Pa) pCO2. There were two levels of N application; low N (LN; 140 kg hectare−1) and high N (HN; 520 kg hectare−1). Measurements were made before a harvest (UNCUT) and again 7 d after the canopy was partially defoliated (CUT); n = 3 blocks.
Figure 2.
WSC content measured in mature lamina of L. perenne in 1994 (A) and 1995 (B). Treatments and their abbreviations are as in the legend for Figure 1. For 1994, means with a common letter are not significantly different; n = 3 (post hoc Tukey's test; P < 0.05). There was no defoliation experiment at high N in the 1995 season requiring a different method of comparing means. A common letter indicates no significant difference. Statistical comparisons between uncut high-N and cut low-N treatment combinations were not possible for 1995. n = 3 (MSD, P < 0.05). n.d., No data.
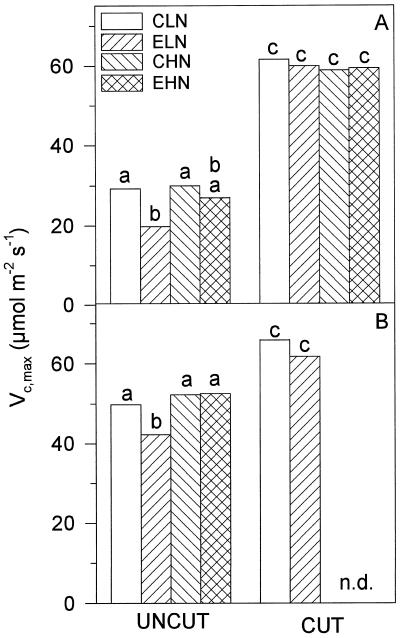
The A/ci response of photosynthesis implied acclimation to elevated pCO2. Before the cut, leaves grown at high pCO2 and low N showed a Vc,max that was 30% below that of controls (P < 0.05, post hoc Tukey's test; Fig. 3A), implying a marked decrease in the amount of active Rubisco. In contrast, Vc,max in leaves grown in high N was unaffected by pCO2 treatment, whereas pCO2 treatment had no effect on Vc,max in leaves grown in either N treatment after the cut (Fig. 3A). In 1995 (Fig. 3B), the pattern was repeated, although the decrease in Vc,max at elevated pCO2 and low N was smaller (MSD, P < 0.05).
Figure 3.
Vc,max measurements determined in parallel with the measurements as described in Figure 2, for 1994 (A) and 1995 (B). Treatments and their abbreviations are as in the legend for Figure 1. Letters above bars are described in the legend for Figure 2. n.d., No data.
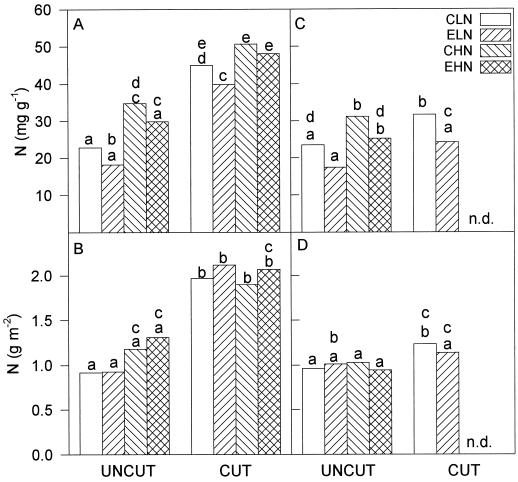
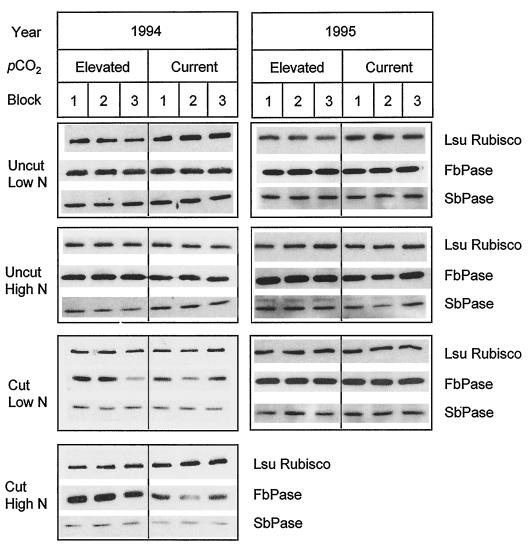
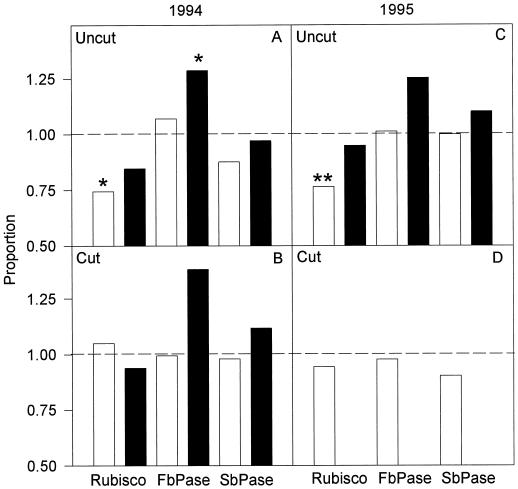
Leaf N content (Fig. 4) and total leaf-protein content (F1,2 = 0.58, P > 0.05) were not significantly decreased by growth at elevated pCO2. In 1994, leaf N contents rose significantly both on a unit leaf-area basis (F1,4 = 7.72, P < 0.05) and a dry-mass basis (F1,4 = 49.17, P < 0.01) after the cut in both N treatments; this may have reflected the application of the fertilizer immediately after the cut. This was confirmed in 1995, when N-fertilizer application was withheld until completion of the measurements and there was no significant rise in leaf N content following cutting of plants grown at elevated pCO2 (Fig. 4, C and D). There was no significant effect of N treatment (F1,8 = 3.21, P > 0.05) or the cut (F1,2 = 5.35, P > 0.05) on total leaf-protein content. Rubisco large subunit showed a significant (Student's t test, P < 0.05) decrease in leaves grown at elevated pCO2 and low N prior to the cut (Figs. 5 and 6A) and corresponding to the significant increase in WSC. This appeared to be a selective effect upon Rubisco content, as there were no significant decreases in the amounts of two other Calvin cycle enzymes, FBPase and SBPase (Fig. 5). In high N before the cut and at high and low N after the cut, there were no significant decreases in Rubisco due to elevated pCO2 (Figs. 5 and 6, A and B). However, at high N before the cut there was a significant increase in the FBPase protein levels (Student's t test, P < 0.05) (Fig. 5 and 6A), a pattern repeated in 1995 (Fig. 5 and 6D).
Figure 4.
Leaf N content of the plants described in the legend for Figure 2 for 1994 (A and B) and 1995 (C and D) expressed on a dry-mass basis (A and C) and a leaf-area basis (B and D). Treatments and their abbreviations are as in the legend for Figure 1. Letters above bars are as described in the legend for Figure 2. n.d., No data.
Figure 5.
Western blots showing levels of LSU, FBPase, and SBPase. Leaves sampled are as described in the legend for Figure 2. For each N and cutting treatment, proteins extracted from each pCO2 treatment and for each replicate block were separated by SDS-PAGE and blotted. Because of variation in exposure time, chemiluminescence, and the reaction of a given protein with its antibody, comparisons are only possible within a blot. This allows for a comparison between pCO2 treatments and any N or cutting treatment, but does not allow for a comparison between N and cutting treatments, except when standardized as a proportion of the control, as in Figure 6.
Figure 6.
Levels of LSU, FBPase, and SBPase as a proportion of the quantity at current pCO2 controls (n = 3). The value for each replicate was the average of three to five repeated western blots. The broken line indicates no difference between elevated/current pCO2. 1994 (A and B) and 1995 (C and D) at low N (□) and high N (▪). There was no defoliation experiment at high N in the 1995 season. *, Statistically significant at the 0.05 level (t, P < 0.05); **, statistically significant at the 0.01 level (t, P < 0.01) two-tailed t test.
DISCUSSION
Our results showed clearly that significant acclimation in L. perenne grown in open-field conditions at elevated pCO2 was absent when N supply was high and when plants grown with a low-N supply were partially defoliated to lower the source-to-sink ratio. In addition, our results lend further support to the hypothesis that acclimation of photosynthesis to growth at elevated pCO2 at low N is an indirect effect resulting from N limitation of the development of sinks for photoassimilate.
Although acclimation decreased Rubisco content by about 25% (Figs. 5 and 6) and Vc,max by 30% (Fig. 2) in the low-N treatment prior to cutting, the stimulation of leaf photosynthesis by elevated pCO2 was similar to that of controls (Fig. 1). This may be explained by the shift in metabolic control away from Rubisco limitation as pCO2 is increased. For leaves grown at the current ambient pCO2 the A/ci response showed that the inflection between Rubisco and RuBP limitation occurred at a pCO2 of about 30 Pa, just above the ci obtained in the current atmosphere (data not shown). This suggests that the amount of Rubisco was just sufficient to support the observed rate of light-saturated photosynthesis in the current atmosphere. Following the calculations of Woodrow (1994) these leaves growing under elevated pCO2 at the mean measurement temperature of 27°C (Bryant, 1994; Hymus, 1995) would have about a 40% excess of Rubisco. This would mean that under elevated pCO2 these leaves could lose 40% of their Rubisco, yet still maintain a photosynthetic rate at elevated pCO2 equal to that of the leaves grown and measured at current pCO2. In this study leaves lost about 25% of their Rubisco when grown at elevated pCO2 and low N, yet still showed a stimulation of A in the field. These lower Rubisco levels may simply reflect a reallocation of resources away from Rubisco, which is in excess under the current growth conditions. In shifting control away from Rubisco, the rate of photosynthesis becomes limited by the regeneration of RuBP (Woodrow, 1994). FBPase and SBPase are considered to be two potential control points for the regeneration of RuBP (Bassham and Krause, 1969; Woodrow and Berry, 1988; Harrison et al., 1998). Neither of these proteins was decreased by growth at elevated pCO2, even under low-N supply. Optimum use of resources would require a system that would allow a decrease in Rubisco but without loss of capacity for RuBP regeneration (Drake et al., 1997).
Under high N no acclimatory loss of Vc,max or Rubisco was observed in elevated pCO2, but FBPase protein increased by about 30%. Although this might imply an increase in capacity for RuBP regeneration, this was not evident in any significant increase in the CO2-saturated rate of photosynthesis in these leaves at elevated pCO2 (data not shown). However, other studies have shown an increase in the maximum CO2-saturated rate of photosynthesis that would result from an increased capacity for regeneration of RuBP (Wong 1979; Sage et al., 1989; Ziska et al., 1991), which in turn implies increased FBPase activity, together with the other activity increases that would be necessary.
Acclimatory loss of Rubisco and carboxylation capacity with growth in elevated CO2 have been phenomenologically linked to an increase in carbohydrate content (Webber et al., 1994; Drake et al., 1997). Our results are consistent with the idea that either an increase in carbohydrate content underlies acclimation or that acclimation and an increase in carbohydrate content at elevated CO2 share a common cause. The absence of acclimation in plants grown at high N and elevated pCO2, and in plants grown at low N and elevated pCO2 when the source-to-sink ratio is low, show that acclimation is neither a direct effect of elevated pCO2 nor directly modified by N supply. The results do show that under conditions that would exacerbate carbohydrate accumulation in the leaf, i.e. a high source-to-sink ratio and low N limiting the development of additional sink capacity, acclimation occurs. Carbohydrate repression of gene expression has been suggested as a cause of this pattern (Sheen, 1994). However, this simple model would not explain a loss of Rubisco without the loss of FBPase or SBPase, two other Calvin cycle enzymes whose expression is affected by carbohydrates (Jones et al., 1996). This might be explained if the threshold levels of carbohydrates required to affect expression differ or if amounts are affected posttranslationally. The relation of bulk carbohydrate content to acclimation is further complicated by compartmentalization, i.e. the fact that only a portion of the leaf carbohydrate could be in a compartment that could influence either gene expression or posttranslational processes (Moore et al., 1997). Nevertheless, and consistent with our hypothesis, acclimation is correlated closely with conditions that induce accumulation of nonstructural carbohydrates in the leaf. In conclusion, this study has shown for the first time to our knowledge that in field conditions acclimation of photosynthesis to growth in elevated CO2 conditions is an indirect effect of N and is dependent on the sink-source balance of the plant.
ACKNOWLEDGMENTS
We thank Martin Parry (IACR Rothamsted Experimental, Harpenden, UK) for the antibodies against Rubisco holoenzyme and Tristan A. Dyer (JIC Norwich, UK) for antibodies against FBPase and SBPase.
Abbreviations:
- A
net rate of CO2 uptake per unit leaf area (μmol m−2 s−1)
- ci
pCO2 in the substomatal cavity
- FACE
free-air CO2 enrichment
- FBPase
chloroplastic Fru-1,6-bisphosphatase
- LSU
large subunit of Rubisco
- MSD
minimum significant difference
- pCO2
partial pressure of CO2 in the atmosphere (Pa)
- RuBP
ribulose-1,5-bisphosphate
- SBPase
sedoheptulose-1,7-bisphosphataseVc,
- max
maximum RuBP-saturated rate of carboxylation in vivo (μmol m−2 s−1)
- WSC
water-soluble carbohydrate
Footnotes
This work was supported by a studentship to A.R. from the Natural Environment Research Council (UK), by the Swiss Federal Institute of Technology, and by grants from the Swiss National Energy Foundation and the Carbon Dioxide Research Program of the Office of Health and Environmental Research of the U.S. Department of Energy.
LITERATURE CITED
- Arp WJ. Effects of source-sink relations on photosynthetic acclimation to elevated CO2. Plant Cell Environ. 1991;14:869–875. [Google Scholar]
- Bassham JA, Krause GH. Free energy changes and metabolic regulation in steady state photosynthesis carbon reduction. Biochim Biopys Acta. 1969;189:207–221. doi: 10.1016/0005-2728(69)90048-6. [DOI] [PubMed] [Google Scholar]
- Bryant JB (1994) The photosynthetic acclimation of Lolium perenne growing in a Free-Air-CO2 Enrichment (FACE) system. MSc thesis. University of Essex, Colchester, UK
- Damerval C, Devienne D, Zing M, Thiellement H. Technical improvements in two-dimensional electrophoresis increase the level of genetic variation detected in wheat-seedling proteins. Electrophoresis. 1986;7:52–54. [Google Scholar]
- Deriaz RE. Routine analysis of carbohydrates and lignin in herbage. J Sci Food Agric. 1961;12:152–160. [Google Scholar]
- Drake BJ, Gonzàlez-Meler MA, Long SP. More efficient plants: a consequence of rising atmospheric CO2? Annu Rev Plant Physiol Plant Mol Biol. 1997;48:609–639. doi: 10.1146/annurev.arplant.48.1.609. [DOI] [PubMed] [Google Scholar]
- Dubois M, Gilles KA, Hamilton JK, Rebers PA, Smith F. Colorimetric method for determination of sugars and related substances. Anal Chem. 1956;28:350–356. [Google Scholar]
- Evans JR, Farquhar GD (1991) Modelling canopy photosynthesis from the biochemistry of the C3 chloroplast. In KJ Boote, RS Loomis, eds, Modeling Crop Photosynthesis: from Biochemistry to Canopy. Crop Science Society of America, Inc., Madison, WI, pp 1–16
- Farquhar GD, Von Caemmerer S, Berry JA. A biochemical model of photosynthetic CO2 assimilation in leaves of C3 species. Planta. 1980;149:78–90. doi: 10.1007/BF00386231. [DOI] [PubMed] [Google Scholar]
- Fischer BU, Frehner M, Hebeissen T, Zanetti S, Stadelmann F, Luscher A, Hartwig UA, Hendry GR, Blum H, Nosberger J. Source-sink relations in Lolium perenne L. as reflected by carbohydrate concentrations in leaves and pseudo-stems during regrowth in a free air carbon dioxide enrichment (FACE) experiment. Plant Cell Environ. 1997;20:945–952. [Google Scholar]
- Harrison EP, Willingham NM, Lloyd JC, Raines CA. Reduced sedoheptulose-1,7-bisphosphate levels in transgenic tobacco lead to decreased photosynthetic capacity and altered carbohydrate accumulation. Planta. 1998;204:27–36. [Google Scholar]
- Hebeisen T, Lücher A, Zanetti S, Fischer BU, Hartwig UA, Frehner M, Hendry GR, Blum H, Nösberger J. Growth response of Trifolium repens L. and Lolium perenne L. as monocultures and bi-species mixture to free air CO2 enrichment and management. Global Change Biol. 1997;3:149–160. [Google Scholar]
- Hymus GJ (1995) The photosynthetic acclimation of Lolium perenne in response to three years growth in a Free-air CO2 Enrichment (FACE) system. MSc thesis. University of Essex, Colchester, UK
- Jones PG, Lloyd JC, Raines CAR. Glucose feeding of intact wheat plants represses the expression of a number of Calvin cycle genes. Plant Cell Environ. 1996;19:231–236. [Google Scholar]
- Koch KE. Carbohydrate-modulated gene expression in plants. Annu Rev Plant Physiol Plant Mol Biol. 1996;37:509–540. doi: 10.1146/annurev.arplant.47.1.509. [DOI] [PubMed] [Google Scholar]
- Krapp A, Stitt M. An evaluation of direct and indirect mechanisms for the ‘sink-regulation’ of photosynthesis in spinach: changes in gas exchange, carbohydrates, metabolites, enzyme activities and steady-state transcript levels after cold-girdling source leaves. Planta. 1995;195:313–323. [Google Scholar]
- Lewin KF, Hendrey G, Nagy J, LaMorte RL. Design and application of a free air carbon dioxide facility. Agric For Met. 1994;70:15–29. [Google Scholar]
- McMurtrie RE, Wang YP. Mathematical models of the photosynthetic response of tree stands to rising CO2 concentrations and temperatures. Plant Cell Environ. 1993;16:1–13. [Google Scholar]
- Mead R, Curnow RN, Hasted AM (1993) Statistical Methods in Agriculture and Experimental Biology, Ed 2. Chapman and Hall, London, UK, pp 130–133
- Moore BD, Palmquist DE, Seeman JR. Influence of plant growth at high CO2 concentrations on leaf content of ribulose-1,5-bisphosphate carboxylase/oxygenase and intracellular distribution of soluble carbohydrates in tobacco, snapdragon, and parsley. Plant Physiol. 1997;115:241–248. doi: 10.1104/pp.115.1.241. [DOI] [PMC free article] [PubMed] [Google Scholar]
- Nie G-Y, Hendrix DL, Webber AN, Kimball BA, Long SP. Increased accumulation of carbohydrates and decreased photosynthetic gene transcript levels in wheat grown at an elevated CO2 concentration in the field. Plant Physiol. 1995;108:975–983. doi: 10.1104/pp.108.3.975. [DOI] [PMC free article] [PubMed] [Google Scholar]
- Paul M, Driscoll SP. Sugar repression of photosynthesis during N deficiency. Plant Cell Environ. 1997;20:110–116. [Google Scholar]
- Pettersson R, McDonald AJS. Effects of nitrogen supply on the acclimation of photosynthesis to elevated CO2. Photosynth Res. 1994;39:389–400. doi: 10.1007/BF00014593. [DOI] [PubMed] [Google Scholar]
- Rogers GS, Milham PJ, Gillings M, Conroy JP. Sink strength may be the key to growth and nitrogen responses in N-deficient wheat at elevated CO2. Aust J Plant Physiol. 1996;23:253–264. [Google Scholar]
- Sage RF, Sharkey TD, Seemann JR. Acclimation of photosynthesis to elevated CO2 in five C3 species. Plant Physiol. 1989;89:590–596. doi: 10.1104/pp.89.2.590. [DOI] [PMC free article] [PubMed] [Google Scholar]
- Scheible W-R, Lauerer M, Schulze E-D, Caboche M, Stitt M. Accumulation of nitrate in the shoot acts as a signal to regulate shoot-root allocation in tobacco. Plant J. 1997;11:671–691. [Google Scholar]
- Sheen J. Feedback control of gene expression. Photosynth Res. 1994;39:427–438. doi: 10.1007/BF00014596. [DOI] [PubMed] [Google Scholar]
- Stitt M. Rising CO2 levels and their potential significance for carbon flow in photosynthetic cells. Plant Cell Environ. 1991;14:741–762. [Google Scholar]
- Von Caemmerer S, Farquhar GD. Some relationships between the biochemistry of photosynthesis and the gas exchange of leaves. Planta. 1981;153:376–387. doi: 10.1007/BF00384257. [DOI] [PubMed] [Google Scholar]
- Webber AN, Nie GY, Long SP. Acclimation of photosynthetic proteins to rising atmospheric CO2. Photosynth Res. 1994;39:413–425. doi: 10.1007/BF00014595. [DOI] [PubMed] [Google Scholar]
- Woodrow IE. Optimal acclimation of the C3 photosynthetic system under enhanced CO2. Photosynth Res. 1994;39:401–412. doi: 10.1007/BF00014594. [DOI] [PubMed] [Google Scholar]
- Woodrow IE, Berry JA. Enzymatic regulation of photosynthetic CO2 fixation in C3 plants. Annu Rev Plant Physiol Plant Mol Biol. 1988;39:533–594. [Google Scholar]
- Wong SC. Elevated atmospheric partial pressure of CO2 and plant growth. I. interactions of nitrogen nutrition and photosynthetic capacity in C3 and C4 plants. Oecologia. 1979;44:68–74. doi: 10.1007/BF00346400. [DOI] [PubMed] [Google Scholar]
- Wullschleger SD. Biochemical limitations to carbon assimilation in C3 plants: a retrospective analysis of the A/ci curves of 109 species. J Exp Bot. 1993;44:907–920. [Google Scholar]
- Zanetti S, Hartwig UA, Lüscher A, Hebeisen T, Frehner M, Fischer BU, Hendry GR, Blum H, Nösberger J. Stimulation of symbiotic N2 fixation in Trifolium repens L. under atmospheric pCO2 in a grassland ecosystem. Plant Physiol. 1996;112:575–583. doi: 10.1104/pp.112.2.575. [DOI] [PMC free article] [PubMed] [Google Scholar]
- Zar JH (1984) Biostatistical Analysis. Prentice-Hall, Upper Saddle River, NJ, p 718
- Ziska LH, Hogan KP, Smith AP, Drake BG. Growth and photosynthetic response of nine tropical species with long-term exposure to elevated carbon dioxide. Oecologia. 1991;86:383–389. doi: 10.1007/BF00317605. [DOI] [PubMed] [Google Scholar]


